* Corresponding author: [email protected]
2017 UTHM Publisher. All right reserved. 1
penerbit.uthm.edu.my/ojs/index.php/jst
Difference of PV Solar Farm Performance between Simulated Results with
Actual Measurement under Climate Condition at Eastern Peninsular
Malaysia
Siti Farhanah Zulkifliª, Hasimah Abdul Rahman
a,b*, Mohammad Yusri Hassan
a,baCentre of Electrical Energy Systems (CEES), Institute of Future Energy, Universiti Teknologi Malaysia (UTM), 81310 Johor Bahru, Johor, Malaysia
bFaculty of Electrical Engineering, Universiti Teknologi Malaysia (UTM), Johor, Malaysia
Abstract: Estimation from simulation tool in feasibility study could be rarely achieved under real operating condition since it calculates the expected output power using algorithms embedded in the tools and synthetic solar irradiance data without considering environmental conditions at the actual site. The aim of this study is to identify the differences in performance between measured data and estimated values using HOMER and PVSyst and to develop a baseline system performance prior installation. A case study at the eastern part of Peninsular Malaysia was conducted to examine the effect of climate condition on the performance of PV solar farm. Findings indicated that PV solar farm in Terengganu has generated 5,416,252.49 kWh of energy in a year while the annual energy estimated by HOMER and PVSyst are 7,124,650.00 kWh and 6,408,925.69 kWh, respectively. This shows that the actual energy production is 15% and 24% lower than PVSyst and HOMER. Hence, baseline developed for PV solar farm at eastern region would comprise energy yield from 1,083.25 kWh/kWp to 1,281.79 kWh/kWp with 12% to 15% capacity factor and performance ratio from 73% to 78% in average. This baseline is useful for PV system integrator as a guideline and reference to estimate the PV system performance prior actual installation.
Keyword: Solar Farm, Grid-connected Photovoltaic, Performance, HOMER, PVSyst
1. Introduction
In 2016, Malaysia has targeted at least 2080 MW of total energy production should be generated by renewable energy sources and by 2020 under 11th Malaysia Plan as an effort to
reduce the impact caused by the emission of greenhouse gasses and to minimise the dependency on fossil fuel as the main energy source [1]. The government has also launched a programme known as “Feed-in Tariff” (FiT) under 9th Malaysia Plan in 2010 as its strategy to enhance renewable energy usage and to encourage PV system integrator to participate and contribute in achieving its target. Through FiT programme, the PV system integrator could sold the produced power to Tenaga Nasional Berhad (TNB) and earn its return on investment within a certain payback period.
Commonly, PV system integrator performs a feasibility study before the PV solar farm is implemented at the proposed location. Performance of the PV solar farm is evaluated and optimised in terms of technical and financial using simulation tool so that the PV solar farm can operate at an optimum performance and give higher return on
investment within a shorter payback time period. The estimation result obtained from the study is used by the PV system integrator as its reference and target for performance and return on investment. However, performance of the PV solar farm depends on climate condition at the site installation, whereas the production of energy is often affected by many factors including solar radiation intensity and ambient temperature. Therefore, there is a probability that the estimation result from simulation tool would give inaccurate estimation. Generally, the intensity of solar radiation in Malaysia declines from north to south, thus a same PV solar farm would have different performance at different location in Malaysia. Terengganu is among the states located under the eastern region in Peninsular Malaysia; hence, the impact of climate condition at this region towards the performance of PV solar farm will be focused in this case study.
2 energy and actual solar radiation with the
result from Standard Test Condition (STC). STC result was used as an input in simulation tool to evaluate performance of the PV solar system; however, its result could not be achieved in the actual operation since it was obtained based on indoor test with constant parameters that hardly present in outdoor condition [7,8]. Energy production involves many equipment and conversion processes; thus, it may cause many losses in the operation such as temperature, mismatch cable, optical reflection, soiling, and technical failures [8].
However, performance ratio will quantify all these losses, making it a suitable parameter to compare different PV solar system [8]. On top of that, total energy production and capacitor capacity can be used to evaluate the performance of PV solar system regarding its ability to generate energy. Baseline of performance PV solar system under the eastern region was developed to provide a realistic reference and guideline for PV solar system at eastern region. Besides, it can be used by the PV system integrator as reference and guideline prior feasibility study as it considers the estimation results from two different simulation tools and actual measurement at site.
2. PV Solar Farm in Terengganu
Terengganu is one of the states located under the eastern region in Peninsular Malaysia with its climate conditions differ with other states in Malaysia due to its geographical location and solar radiation declination. A 5 MWp of PV solar farm with polycrystalline module mounted on the ground at coordinate of 5° 31’ north and 102°45’ east commissioned since 2014 under FiT programme was selected as a case study.
Measurement of parameters such as energy generated and solar radiation intensity were recorded by the monitoring system and the database where all the parameters are logged can be viewed either daily, weekly, monthly or annually. Actual measurement for energy production and solar irradiance received at the site from January to December is shown in Table 1.
Table 1 Actual Measurement for PV Solar Farm at Terengganu
3. Modelling PV Solar Farm using
HOMER
Hybrid Optimisation Model for Electric Renewable Energy or HOMER is one of simulation tools developed to evaluate and optimise any renewable energy system so that the system can give an optimum performance. It can also estimate the performance of renewable energy in terms of technical and economy such as the energy produced, emission of greenhouse gases and financial. Impact of variation in the renewable energy system configuration towards its performance can be determined in sensitivity result, hence optimising the system accordingly.
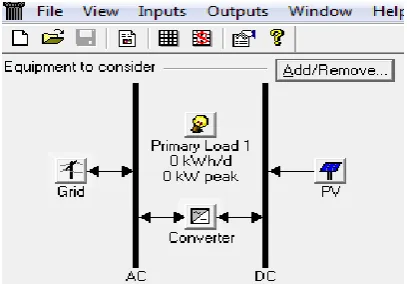
The simulation begins by specifying coordinate for location of the proposed PV solar farm so that it could download monthly average solar irradiance data for the location. Next, all details of the component used in the PV solar farm are defined as shown in Fig. 1, leaving the cost section undefined as the study did not focus on economy aspect. Certain details such as lifetime and efficiency of the component are proposed by HOMER.
Month
Average Solar Irradiance (kWh/m²)
Output Power Production
(kWh)
January 3.237 267,226.04
February 4.638 469,787.11
March 5.475 471,599.31
April 5.025 464,037.65
May 4.988 543,557.70
June 2.632 511,927.95
July 2.747 327,523.30
August 4.155 510,523.63
September 4.163 569,486.28
October 3.623 465,639.89
November 3.207 300,827.64
December 3.237 480,690.68
3
Fig. 1 Modelling PV Solar Farm using HOMER
4. Modelling PV Solar Farm using
PVSYST
PVSyst is a simulation tool developed to evaluate only PV solar system. Its simulation procedure is similar with HOMER where the latitude and longitude of PV solar farm location are specified so that solar irradiance data at the location can be obtained. Unlike HOMER, PVSyst can retrieve solar irradiance data from other solar source providers including NASA and Meteornorm. However, if the data for the specific location is not available, PVSyst will utilise the nearest available data as synthetic data.
All components used in the PV solar farm are also defined in the component details and configurations of PV solar farm such as installation method and shading. Both simulations used solar irradiance data solely obtained from their embedded system so that the estimation can be made based on the simulation tools independently.
5. Performance Measurement
Differences between estimation result from HOMER and PVSyst with actual measurement were evaluated by its total energy production and solar radiation received at the PV solar farm site installation within one year operation. On the other hand, baseline for performance of a PV solar system under eastern region was identified using three parameters, which are energy yield (Yf), performance ratio (PR) and capacity factor (CF). All these parameters were manually calculated using standard equation defined by IEC as below;
PR = Yf × 100 (1) [4,5,9] Yr
Performance ratio is expressed in percentage to describe overall losses in the PV system where Yf is energy yield while Yr is reference yield.
Yf = Ea (2) [4,5,8,9] Ppv rated
Ea is output energy generated in kWh and Ppv rated is total installed power as rated in STC in kWp. Thus, it is a suitable parameter to compare PV solar system with different capacity [7].
Yr = Ht (3) [7,9]
Gstc
Where Ht is actual solar radiation under real operating condition and Gstc is solar radiation defined in STC test in Wh/m².
CF = Yf × 100 (4) [2,3] 8670
Capacity factor define capability of the generation of PV solar farm if it operates with maximum condition for 24 hours per day in a year [2,3].
6. Result
Comparison between estimation result using HOMER and PVSyst with actual measurement for PV solar farm at Terengganu is plotted in Fig. 2 and Fig. 3, respectively, where Fig. 2 represents monthly energy production while Fig. 3 indicates monthly solar radiation intensity received at the PV solar farm site in average. From the Fig. 2, it can be clearly seen that the estimation from HOMER and PVSyst was almost similar with small variation between each other, while actual measurement has shown a lower result compared to both estimations throughout the year.
4 January, July and November where energy
generated in these months was much lower than estimated by HOMER and PVSyst. The energy production was affected by climate conditions at installation site where the PV solar farm generates higher energy under higher solar radiation intensity.
Fig. 2 Comparison of Estimation Result from HOMER and PVSyst with Actual Measurement for Energy Production
On the other hand, HOMER and PVSyst gave a similar estimation result with minimal variation between months, while the actual solar radiation received at PV solar farm was also found lower than both estimations. Annual solar irradiation predicted by HOMER and PVSyst are 5.40 kWh/m² and 4.83 kWh/m² per day in average, respectively, while actual annual solar radiation is 27% and 19% lower than that using HOMER and PVSyst with 3.93 kWh/m² in average. However, monitoring system for the PV solar farm had faced some technical failure where it cannot measure and record a full monthly data for June and July, hence causing the average data for both months to be much lower compared to other months. The monthly average solar radiation is obtained by dividing the cumulative of daily average solar radiation with total monthly period. But, since the system could not record a full monthly daily solar radiation, thus the cumulative result is much lower and caused the monthly average solar radiation also lower. However, June and July were exposed with Southwest Monsoon where the climate condition in these months is drier due to dry wind blew from Australia desert, thus its actual solar radiation shall be
higher or at least comparable with other months.
Solar radiation data predicted by HOMER and PVSyst were observed to be slightly different with each other since they used different methods in estimating the data. HOMER used mathematical algorithm derived by V.A. Graham to create a synthetic solar irradiance at the proposed site location, while PVSyst used the nearest available data at the location. However, all results met with natural climate condition in Terengganu where common phenomena faced by this region, which are El Nino, Southwest and Northeast Monsoon, were included. The climate in Terengganu would be drier and higher under Southwest Monsoon from May to September while wetter and lower from October to March in Northeast Monsoon. The worst scenario would be Terengganu having a heavy rainfall and flood during December to January.
Fig. 3 Comparison of Estimation Result from HOMER and PVSyst with Actual Measurement for Solar Irradiance
5 The performance ratio on June is more than
100% due to the unbalance results between solar radiation and energy generated with STC. The performance ratio could be greater than 100% because of average actual solar radiation is lower where these conditions were also found by Bashir et al [4]. The total energy generated on June is high although solar radiation measured in this month is lower than other months; however, the average solar radiation in this month is low due to the technical failure in monitoring system as elaborated earlier. Therefore, annual performance ratio calculated for actual measurement is 8% higher than HOMER and PVSyst with 78%, while HOMER and PVSyst possessed 72% and 73% of annual performance ratio in average, respectively.
Fig. 4 Comparison of Performance Ratio Calculated using HOMER, PVSyst and Actual Measurement
Thus, a baseline for PV solar system performance under eastern region in Peninsular Malaysia in terms of energy yield, capacity factor and performance ratio was summarised in Table 2. These parameters were categorised by minimum and maximum range where it considers estimation from simulation tools and actual measurement.
Table 2 Baseline for Performance of PV Solar Farm in Terengganu
Parameter Minimum Maximum Energy Yield
(kWh/year/kWp)
1,083.25 1,281.79
Capacity Factor 12 15
Annual Average Performance Ratio
(%)
73 78
5.0 Conclusion
Based on its total overall performance, it can be concluded that estimation result from HOMER and PVSyst have overestimated the capability of PV solar farm in Terengganu where the PV solar farm could not achieved the target as predicted by both simulation tools. The estimation from PV solar farm did not matched with that from HOMER and PVSyst with 23% and 13% in difference for total annual energy generated under actual climate condition. Discrepancies between these results were caused by solar radiation intensity, difference methods in calculating expected energy generated and system losses. On the other hand, baseline developed for PV solar system performance is useful for PV system integrator as a guideline and reference in feasibility study and prior installing PV solar system under the eastern region in Peninsular Malaysia. Thus, PV solar system under the same region would obtain energy yield from 1,083.25 kWh/kWp to 1,281.79 kWh/kWp with capacity factor ranging from 12% to 15% and 73% to 78% of performance ratio in average.
Acknowledgment
Author would like to thank you to University Teknologi Malaysia and the PV solar farm for providing the actual measurement data.
References
[1] TNB Up to Challenges, (pp.6-10), Jurutera, February, 2016.
[2] Kassim, M. P., Abdullah, M. P., Hassan, M. Y., & Hussin, F. (2014, October). Comparison between predicted and measured generation output of a photovoltaic farm. In Energy Conversion
(CENCON), 2014 IEEE Conference
on (pp. 181-184). IEEE.
[3] Kassim, M. P. M., Al-Obaidi, K. M., Munaaim, M. A. C., & Salleh, A. M. (2015). Feasibility study on solar power plant utility grid under Malaysia feed-in tariff. American Journal of Engineering and Applied Sciences, 8(2), (pp 210-222). [4] Bashir, M. A., Ali, H. M., Ali, M., &
6 [5] Cornaro, C., Bartocci, S., Musella, D.,
Strati, C., Lanuti, A., Mastroianni, S. & Brown, T. M. (2015). Comparative analysis of the outdoor performance of a dye solar cell mini-panel for building integrated photovoltaics applications. Progress in Photovoltiacs: Research and Application,
23(2), 215-225.
[6] Fan, J. (2014). Performance of Nine Different Types of PV Modules in the Tropical Region. World Academy of Science, Engineering and Technology,
International Journal of Electrical,
Computer, Energetic, Electronic and
Communication Engineering, 8(9),
1407-1410.
[7] Phaobkaew, K., Ketjoy, N., Rakwichian, W., & Yammen, S. (2007). Performance of a-si, p-si, and HIT PV technological comparison under tropical wet climate condition. International journal of renewable energy, 2(2), 23-24.
[8] Makrides, G., Zinsser, B., Georghiou, G. E., & Norton, M. (2012). Performance of
photovoltaics under actual operating
conditions (pp.201-223). INTECH Open
Access Publisher.