Sci
O p e n H U B f o r S c i e n t i f i c R e s e a r c hForschen
Journal of Psychiatry and Mental Health
Open Access
Volume:1.2 Research Article
Predictors of Hospital Readmission for Children
with Psychiatric Illness who have Received an
Initial Course of Treatment
Robert Kagabo1*, Jaewhan Kim1, Mia Hashibe1, Kristi Kleinschmit2, Claire Clark1 and
Stephen Alder1
1Department of Family and Preventive Medicine, Division of Public Health, University of Utah, Salt Lake
City, Utah, USA
2Department of Psychiatry, University of Utah School of Medicine, Salt Lake City, Utah, USA
Received date: 19 Oct 2016; Accepted date: 29 Nov 2016; Published date: 05 Dec 2016.
Citation: Kagabo R, Kim J, Hashibe M, Kleinschmit K, Clark C, et al. (2016) Predictors of Hospital Readmission for Children with Psychiatric Illness who have Received an Initial Course of Treatment. J Psychiatry Ment Health 1(2): doi
http://dx.doi.org/10.16966/2474-7769.109
Copyright: © 2016 Kagabo R, et al. This is an open-access article distributed under the terms of the Creative Commons Attribution License, which permits unrestricted use, distribution, and reproduction in any medium, provided the original author and source are credited.
*Corresponding author: Robert Kagabo, Department of Family and Preventive Medicine, Division of
Public Health, University of Utah, Salt Lake City, Utah, USA, E-mail: robert.kagabo@hsc.utah.edu
Introduction
The report that one out of every five children in any given year suffers from a mental disorder in the United States [1] is alarming and signifies that mental health among children is a challenge resulting in several public health concerns. Recurrent hospital readmission of children with psychiatric illness has been identified as one of these public health concerns. To begin to research the public health concerns or develop any interventions, it is necessary to identify factors that predict such readmissions. In this study, we used data of children hospitalized for treatment of psychiatric illness at the University of Utah’s Neuropsychiatric Institute between 1999 and 2010. We looked at several factors, such as demographics, insurance type, primary diagnosis at the time of admission, and hospital length of stay to see if they are possible rehospitalizaton predictor variables.
Background
The readmission rates among children with psychiatric illness are increasing [2-3], yet there are fewer studies investigating predictors of such readmissions [4]. In some cases, children with psychiatric illness receive
Abstract
Recurrent hospital readmission for children with psychiatric illness is a public health concern. Any efforts to understand the public health concern or develop an intervention require an understanding of factors that predict such readmissions. The objective of this study was to identify factors that predicted readmission within one year of discharge for children who were inpatients at an academic psychiatric hospital.
This is a retrospective cohort study of 7,265 pediatric patients hospitalized between 1999 and 2010. Using Stata 12, logistic regressions were performed with readmission as the dependent variable. Bivariate or crude and adjusted or multivariate analyses were done with time intervals of 365, 180, 90, and 30 days following discharge. Several variables were investigated as predictor variables which included: demographics, insurance type, hospital length of stay (LOS) in days, discharge disposition, and primary diagnosis. All independent variables were included in multivariate analyses.
The 7,265 patients who were included in the study ranged in age from 3 to 17 years old and 50.70% of them were female. Of the total participants, 1620 (22.30%) of them were readmitted within one year of discharge. The bivariate analysis showed that patients with Utah Medicaid insurance had 1.25 times the odds of readmission (1.099-1.415, 95% CI) and p=0.001, and multivariate odds ratio 1.073 (0.938-1.228, 95% CI) and p=0.304. LOS bivariate odds ratio was 1.010 (1.004-1.016, 95% CI) with p=0.002. Multivariate analysis odds ratio was 1.003 (0.994-1.007,
95% CI) with p=0.923. A number of diagnosis were statistically significant with schizophrenia showing the biggest odds ratio of 3.65 (2.457-5.408,
95% CI) and p<0.001. Compared to discharge to home or self-care, patients discharged to another facility had 1.84 and 1.24 times higher odds of being readmitted within 30 and 365 days of discharge, respectively.
As a conclusion, when considering only bivariate analysis, patients with the Utah Medicaid type of insurance were more likely to be readmitted; however, such prediction disappeared when controlling for other variables. Patients’ readmission was largely dependent on the nature of the
disease and not other suspected variables, such as demographics, insurance, or discharge disposition. A number of specific diagnoses were statistically significant in predicting readmission. Those most common in the prediction were schizophrenia disorders, bipolar disorders, and unspecified psychosis.
Keywords:
Pediatric Psychiatric Patients; Readmission predictors; Public healthmultiple readmissions and this recurrent hospitalization is a public health concern. In a prospective cohort study done in New York State, where 109 children were followed, research found that 37 of them were readmitted within the first year of discharge [2]. Managed care imposed restrictions on length of stay have been cited as possible explanations for possible increases. A study in 1995 which focused on managed care restrictions found that in Massachusetts, the 30-day readmission of children and adolescents was 7.5% before imposing restrictions and increased to 10.1% after the restrictions, while in Tennessee, the 30-day readmissions went from 9.2% in 1995 to 12.2% in 2000. A retrospective cohort design study in Maryland followed 522 Medicaid eligible adolescents who were admitted to psychiatric hospitals between July 1997 and June 1998 and found that out of the 522 adolescents, 198 (37.9%) had at least one readmission encounter within a year of discharge [5].
In a different study, an increase in admission rates was compared to discharges among children and adolescents compared to adults and the elderly. This study used the yearly U.S. National Hospital Discharge Survey data and found that discharges of child and adolescent psychiatric patients had increased significantly from 155 per 100,000 in 1996 to 283
Sci
O p e n H U B f o r S c i e n t i f i c R e s e a r c hForschen
Open Access
per 100,000 in 2007 compared to other age groups, yet the total inpatient days also increased significantly [6]. If there was no increase in admission or readmission, an increase in discharge would indicate a decrease in total inpatient days. The one-year window of observation after discharge from pediatric psychiatric inpatient has revealed a number of outcomes such as: suicide attempts, high mortality risk, and readmissions [2,7,8]. The reports vary but the limited research done indicates that between 25 and 33% of children and adolescents are readmitted within the first year of discharge with most of them occurring within the first 3 months [2,7,9].
Blader [2] followed 109 children, ages 5 to 12, for one year after their discharge from acute inpatient care. His main outcome variable was time to re-hospitalization and he found that 81% of the rehospitalizations occurred within 90 days following discharge. The variables in the study that predicted rehospitalization risk were severe conduct problems, harsh parental discipline, and disengaged parent-child relations. Lyons et al. [10] conducted a study where they followed 255 patients admitted to any of the seven psychiatric hospitals in a regional managed care program in the Chicago area. These patients were followed for a 6-month period and the investigators found that 17.6% of the sample was readmitted within the 6-month period, with 7.1% of the readmissions occurring within 30 days of discharge.
In Taiwan, the relationship between psychiatrist caseload and length of inpatient stay was investigated with a study sample size of N=66959. Thirty-two percent of the sample was readmitted within 30 days. Analysis was done to compare a 30-day readmission rate according to psychiatrists’ caseload categorized as: low, medium, high, and very high. The readmission rate was on average higher for psychiatrists with higher volume of caseload. Another result was the decrease in the length of inpatient stay (LOS) observed with increase in psychiatrist’s caseload. Inpatients had lengths of stay on average that were 1.22, 2.03, and 7.59 days shorter for medium, high, and very high psychiatrists’ caseload volume, respectively, compared to psychiatrists with low caseload volume [11]. These results seem to indicate an association between psychiatrists’ caseload and readmission; and they remained true for the different disorder categories, namely schizophrenia, major depressive disorder, bipolar disorder, and others. In 2010, in another study in Taiwan, the researchers compared readmission rates and predictors in 14 days, one year and five years after discharge. The study consisted of 44,237 first-time psychiatric inpatients discharged in 2000 and then followed for five years. The readmission cumulative incidences reported were 6.1% at 14 days, 22.3% at one year, and 37.8% at five years. Although not completely understood, male gender was found to be highly associated with high readmission rates. Length of stay in days less than 15 was also found to be highly predictive of readmission [12].
In the United States, researchers have reported that there has been a decrease in number of days spent in hospitals as inpatients. Observations of admission to psychiatric inpatient care dropped between 1990 and 2000 from 833 to 714 persons per 100,000, but this was reversed in 2004 when the observed psychiatric admissions were 910 persons per 100,000 according to data from Substance Abuse and Mental Health Services Administration [6]. The dramatic increase in admissions was observed among adolescents and yet this was the same group with most discharges [2,6]. The rates of readmission reported in the range from about 10% within 1 month to as high as 86% for a seven-year observation [12,13]. The introduction of managed care appeared to fuel a significant increase in psychiatric readmissions. Before managed care, about one-quarter of the youth were reported to experience readmission within one year of discharge, but recent results show readmission ranging from 30 to 50% [14,15].
Some studies have found that there has been a trend suggesting a move away from long-term psychiatric hospitalization, but such a move has co-occurred with many more psychiatric readmissions [16-18]. The
readmissions, however, have been documented and studied more among adults and less among adolescents. In one study using data from the youth inpatient unit (YIU) in Christchurch, New Zealand, investigators studied adolescent readmissions; they compared adolescents with a single admission with those with more than one admission in a 12-month period. They found that readmissions were not associated with psychiatric diagnosis, but were associated with child sexual abuse and tended to occur more in the young ages [16].
While the limited research has consistently estimated that about one third of children and adolescents are readmitted within the first 12 months of discharge, [16,17,19,20] the difficult question seems to be the identification of factors predicting such readmissions. In South Wales Sydney, researchers did a chart review study of 112 patients admitted over a one-year period to identify some modifiable factors associated with pediatric psychiatric readmissions. They found that 31% of the patients were readmitted. Males were slightly more likely to be readmitted than females. These same researchers reported a trend of patients with bipolar disorder being more likely to be readmitted and a trend of patients with adjustment disorders being less likely to be readmitted [20].
Methods
A retrospective cohort study was performed where data were collected from 7724 patients between age 3 and 17 who were seen for inpatient care at the University of Utah Neuropsychiatric Institute. These patients were admitted between the years 1999 and 2010 and ethical approval for the study was obtained from the University of Utah Institutional Review Board. We used STATA 12 to analyze data and perform crude and adjusted or multivariate logistic regressions. Participants were retrospectively followed up at 30, 90, 180, and 365 days following discharge.
In the data preparation, 245 participants were eliminated because they had clinical length of stay days (LOS) at the hospital of more than 365 days, which we assumed would put them in a residential treatment. In the early years of the 1990s, part of UNI was a residential setting and patients would stay longer than 365 days. An additional 214 patients who had missing variable information we needed were also eliminated. The exclusion criteria allowed for at least 12 months follow up for all participants after their initial discharge. The final sample included 7,265 participants, all of whom received at least a one-year retrospective observation.
We divided the participants in four age groups as follows: 3-6, 7-11, 12-14, and 15-17 years old. This age categorization follows a similar pattern used in a number of psychological studies. In a children’s pain perspectives study of children 4 to 14 years old, the age categorizations were: 4-6, 7-11, and 12-14 years old. This age categorization follows the stages of development described by Jean Piaget while showing that children have differences in the way they behave, understand, and describe pain at different stages of development [21]. Only patients who were younger than 18 years of age at the time of their inpatient admission or readmission for psychiatric treatment were included in the study.
Results
Sci
O p e n H U B f o r S c i e n t i f i c R e s e a r c hForschen
Open Access
Variable Number of Patients (N=7,265) Percent of Total Patients Number Readmitted (n=1,620) Percent Readmitted (n=22.30%) Readmissions% of Total
Sex
Males 3,629 49.95 800 22.04 49.38
Females 3,636 50.05 820 22.55 50.62
Age group (Years)
3-6 167 2.3 35 20.96 2.16
7-11 1,149 15.82 298 25.94 18.4
12-14 1,978 27.23 457 23.1 28.21
15-17 3,971 54.66 830 20.9 51.23
Race
White 4,470 61.53 1,148 25.68 70.86
Black 162 2.23 42 25.93 2.59
Indian-Alaskan 50 0.69 10 20 0.62
Asian 36 0.5 10 27.78 0.62
Hawaiian-Pacific Islander 14 0.19 2 14.29 0.12
Other 383 5.27 100 26.11 6.17
Other-Undefined 2,150 29.59 308 14.33 19.01 Insurance
UT Commercial 5,382 74.08 1,152 21.4 71.11
UT Medicaid 1,724 23.73 437 25.35 26.98
Other-Category 103 1.42 16 15.53 0.99
UT Misc. Government 54 0.74 15 27.78 0.93
UT Non Government Misc. 2 0.03 0 0 0
Discharge Disposition
Home or Self Care 5,963 82.08 1,283 21.52 79.2
Other Facility 1,268 17.45 329 25.95 20.31
Left Against Medical advice 27 0.37 6 22.22 0.37
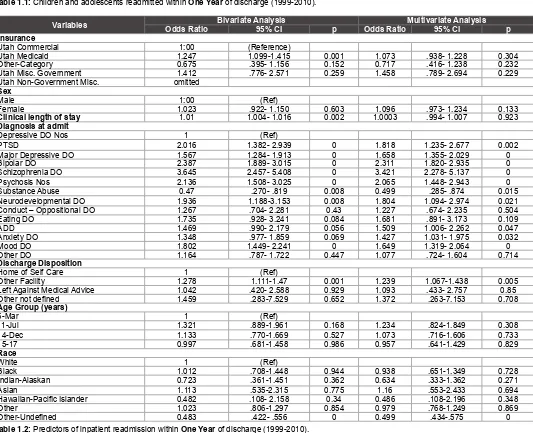
Other not defined 7 0.1 2 28.57 0.12 Table 1.1: Children and adolescents readmitted within One Year of discharge (1999-2010).
Variables Odds Ratio Bivariate Analysis95% CI p Odds RatioMultivariate Analysis95% CI p
Insurance
Utah Commercial 1:00 (Reference)
Utah Medicaid 1.247 1.099-1.415 0.001 1.073 .938- 1.228 0.304
Other-Category 0.675 .395- 1.156 0.152 0.717 .416- 1.238 0.232
Utah Misc. Government 1.412 .776- 2.571 0.259 1.458 .789- 2.694 0.229
Utah Non-Government Misc. omitted
Sex
Male 1:00 (Ref)
Female 1.023 .922- 1.150 0.603 1.096 .973- 1.234 0.133
Clinical length of stay 1.01 1.004- 1.016 0.002 1.0003 .994- 1.007 0.923
Diagnosis at admit
Depressive DO Nos 1 (Ref)
PTSD 2.016 1.382- 2.939 0 1.818 1.235- 2.677 0.002
Major Depressive DO 1.567 1.284- 1.913 0 1.658 1.355- 2.029 0
Bipolar DO 2.387 1.889- 3.015 0 2.311 1.820- 2.935 0
Schizophrenia DO 3.645 2.457- 5.408 0 3.421 2.278- 5.137 0
Psychosis Nos 2.136 1.508- 3.025 0 2.065 1.448- 2.943 0
Substance Abuse 0.47 .270- .819 0.008 0.499 .285- .874 0.015
Neurodevelopmental DO 1.936 1.188-3.153 0.008 1.804 1.094- 2.974 0.021
Conduct – Oppositional DO 1.267 .704- 2.281 0.43 1.227 .674- 2.235 0.504
Eating DO 1.735 .928- 3.241 0.084 1.681 .891- 3.173 0.109
ADD 1.469 .990- 2.179 0.056 1.509 1.006- 2.262 0.047
Anxiety DO 1.348 .977- 1.859 0.069 1.427 1.031- 1.975 0.032
Mood DO 1.802 1.449- 2.241 0 1.649 1.319- 2.064 0
Other DO 1.164 .787- 1.722 0.447 1.077 .724- 1.604 0.714
Discharge Disposition
Home of Self Care 1 (Ref)
Other Facility 1.278 1.111-1.47 0.001 1.239 1.067-1.438 0.005
Left Against Medical Advice 1.042 .420- 2.588 0.929 1.093 .433- 2.757 0.85
Other not defined 1.459 .283-7.529 0.652 1.372 .263-7.153 0.708 Age Group (years)
6-Mar 1 (Ref)
11-Jul 1.321 .889-1.961 0.168 1.234 .824-1.849 0.308
14-Dec 1.133 .770-1.669 0.527 1.073 .716-1.606 0.733
15-17 0.997 .681-1.458 0.986 0.957 .641-1.429 0.829
Race
White 1 (Ref)
Black 1.012 .708-1.448 0.944 0.938 .651-1.349 0.728
Indian-Alaskan 0.723 .361-1.451 0.362 0.634 .333-1.362 0.271
Asian 1.113 .535-2.315 0.775 1.16 .553-2.433 0.694
Hawaiian-Pacific Islander 0.482 .108- 2.158 0.34 0.486 .108-2.196 0.348
Other 1.023 .806-1.297 0.854 0.979 .768-1.249 0.869
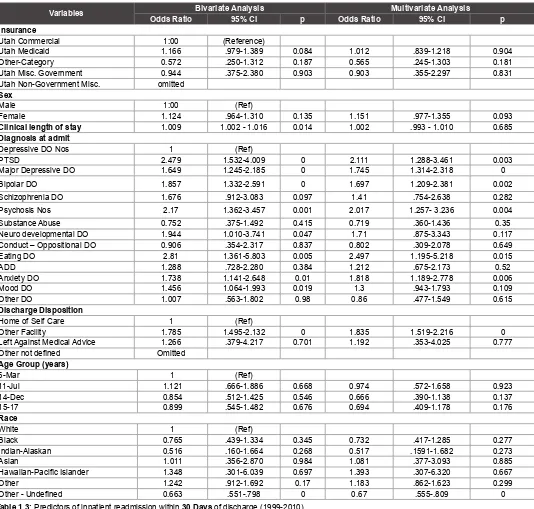
Other-Undefined 0.483 .422- .556 0 0.499 .434-.575 0 Table 1.2: Predictors of inpatient readmission within One Year of discharge (1999-2010).
Sci
O p e n H U B f o r S c i e n t i f i c R e s e a r c hForschen
Open Access
significant with P=0.527. For the multivariate analysis, the results were similar with P=0.733, as shown in table 1.2. For the oldest age group 15-17, in the bivariate analysis, the results showed that this age group was 0.03% less likely to be readmitted compared to the 3-6 age group. These results were still not significant with p=0.986 in the bivariate and p=0.829 in the multivariate analysis, as shown in table 1.2.
The patients were predominantly white at 61.53% of the population and with the largest contribution of readmission of 70.86%. The largest percentage of patients (74.08%) had their care paid by Utah Commercial Insurances followed by Utah Medicaid (23.73%). The majority of the readmits 71.11% and 26.98% were also from those patients paid for by these two insurance types, respectively. The results show the biggest percent of patient 82.08% and 17.45% were discharged to home or
Variables Odds RatioBivariate Analysis95% CI p Odds Ratio Multivariate Analysis95% CI p
Insurance
Utah Commercial 1:00 (Reference)
Utah Medicaid 1.166 .979-1.389 0.084 1.012 .839-1.218 0.904
Other-Category 0.572 .250-1.312 0.187 0.565 .245-1.303 0.181
Utah Misc. Government 0.944 .375-2.380 0.903 0.903 .355-2.297 0.831
Utah Non-Government Misc. omitted
Sex
Male 1:00 (Ref)
Female 1.124 .964-1.310 0.135 1.151 .977-1.355 0.093
Clinical length of stay 1.009 1.002 - 1.016 0.014 1.002 .993 - 1.010 0.685
Diagnosis at admit
Depressive DO Nos 1 (Ref)
PTSD 2.479 1.532-4.009 0 2.111 1.288-3.461 0.003
Major Depressive DO 1.649 1.245-2.185 0 1.745 1.314-2.318 0
Bipolar DO 1.857 1.332-2.591 0 1.697 1.209-2.381 0.002
Schizophrenia DO 1.676 .912-3.083 0.097 1.41 .754-2.638 0.282
Psychosis Nos 2.17 1.362-3.457 0.001 2.017 1.257- 3.236 0.004
Substance Abuse 0.752 .375-1.492 0.415 0.719 .360-1.436 0.35
Neuro developmental DO 1.944 1.010-3.741 0.047 1.71 .875-3.343 0.117
Conduct – Oppositional DO 0.906 .354-2.317 0.837 0.802 .309-2.078 0.649
Eating DO 2.81 1.361-5.803 0.005 2.497 1.195-5.218 0.015
ADD 1.288 .728-2.280 0.384 1.212 .675-2.173 0.52
Anxiety DO 1.738 1.141-2.648 0.01 1.818 1.189-2.778 0.006
Mood DO 1.456 1.064-1.993 0.019 1.3 .943-1.793 0.109
Other DO 1.007 .563-1.802 0.98 0.86 .477-1.549 0.615
Discharge Disposition
Home of Self Care 1 (Ref)
Other Facility 1.785 1.495-2.132 0 1.835 1.519-2.216 0
Left Against Medical Advice 1.266 .379-4.217 0.701 1.192 .353-4.025 0.777
Other not defined Omitted Age Group (years)
6-Mar 1 (Ref)
11-Jul 1.121 .666-1.886 0.668 0.974 .572-1.658 0.923
14-Dec 0.854 .512-1.425 0.546 0.666 .390-1.138 0.137
15-17 0.899 .545-1.482 0.676 0.694 .409-1.178 0.176
Race
White 1 (Ref)
Black 0.765 .439-1.334 0.345 0.732 .417-1.285 0.277
Indian-Alaskan 0.516 .160-1.664 0.268 0.517 .1591-1.682 0.273
Asian 1.011 .356-2.870 0.984 1.081 .377-3.093 0.885
Hawaiian-Pacific Islander 1.348 .301-6.039 0.697 1.393 .307-6.320 0.667
Other 1.242 .912-1.692 0.17 1.183 .862-1.623 0.299
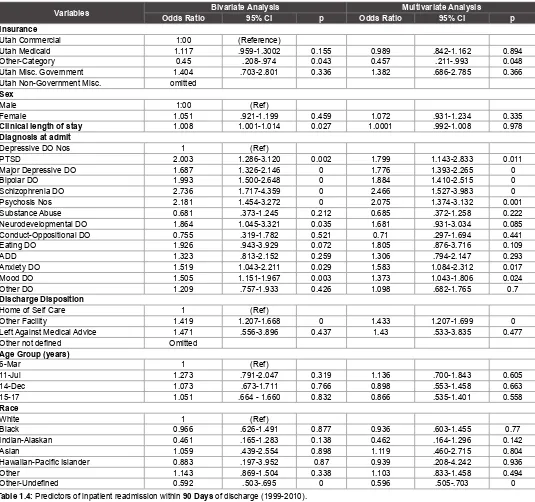
Other - Undefined 0.663 .551-.798 0 0.67 .555-.809 0 Table 1.3: Predictors of inpatient readmission within 30 Days of discharge (1999-2010).
Note: Bivariate analyses are same as crude analyses and in multivariate analyses all independent variables were included.
care and other facility categories, where still most of the readmission of 79.20% and 20.31% came from respectively, as seen in table 1.1. For the year follow up following discharge and in the bivariate analysis, patients with Utah Medicaid insurance were 1.25 times more likely to be readmitted compared to those with Utah Commercial insurance type. This was a significant result at p=0.001 (Table 1.2).
Sci
O p e n H U B f o r S c i e n t i f i c R e s e a r c hForschen
Open Access
Variables Odds Ratio Bivariate Analysis95% CI p Odds RatioMultivariate Analysis95% CI p
Insurance
Utah Commercial 1:00 (Reference)
Utah Medicaid 1.117 .959-1.3002 0.155 0.989 .842-1.162 0.894
Other-Category 0.45 .208-.974 0.043 0.457 .211-.993 0.048
Utah Misc. Government 1.404 .703-2.801 0.336 1.382 .686-2.785 0.366
Utah Non-Government Misc. omitted
Sex
Male 1:00 (Ref)
Female 1.051 .921-1.199 0.459 1.072 .931-1.234 0.335
Clinical length of stay 1.008 1.001-1.014 0.027 1.0001 .992-1.008 0.978
Diagnosis at admit
Depressive DO Nos 1 (Ref)
PTSD 2.003 1.286-3.120 0.002 1.799 1.143-2.833 0.011
Major Depressive DO 1.687 1.326-2.146 0 1.776 1.393-2.265 0
Bipolar DO 1.993 1.500-2.648 0 1.884 1.410-2.515 0
Schizophrenia DO 2.736 1.717-4.359 0 2.466 1.527-3.983 0
Psychosis Nos 2.181 1.454-3.272 0 2.075 1.374-3.132 0.001
Substance Abuse 0.681 .373-1.245 0.212 0.685 .372-1.258 0.222
Neurodevelopmental DO 1.864 1.045-3.321 0.035 1.681 .931-3.034 0.085
Conduct-Oppositional DO 0.755 .319-1.782 0.521 0.71 .297-1.694 0.441
Eating DO 1.926 .943-3.929 0.072 1.805 .876-3.716 0.109
ADD 1.323 .813-2.152 0.259 1.306 .794-2.147 0.293
Anxiety DO 1.519 1.043-2.211 0.029 1.583 1.084-2.312 0.017
Mood DO 1.505 1.151-1.967 0.003 1.373 1.043-1.806 0.024
Other DO 1.209 .757-1.933 0.426 1.098 .682-1.765 0.7
Discharge Disposition
Home of Self Care 1 (Ref)
Other Facility 1.419 1.207-1.668 0 1.433 1.207-1.699 0
Left Against Medical Advice 1.471 .556-3.896 0.437 1.43 .533-3.835 0.477
Other not defined Omitted Age Group (years)
6-Mar 1 (Ref)
11-Jul 1.273 .791-2.047 0.319 1.136 .700-1.843 0.605
14-Dec 1.073 .673-1.711 0.766 0.898 .553-1.458 0.663
15-17 1.051 .664 - 1.660 0.832 0.866 .535-1.401 0.558
Race
White 1 (Ref)
Black 0.966 .626-1.491 0.877 0.936 .603-1.455 0.77
Indian-Alaskan 0.461 .165-1.283 0.138 0.462 .164-1.296 0.142
Asian 1.059 .439-2.554 0.898 1.119 .460-2.715 0.804
Hawaiian-Pacific Islander 0.883 .197-3.952 0.87 0.939 .208-4.242 0.936
Other 1.143 .869-1.504 0.338 1.103 .833-1.458 0.494
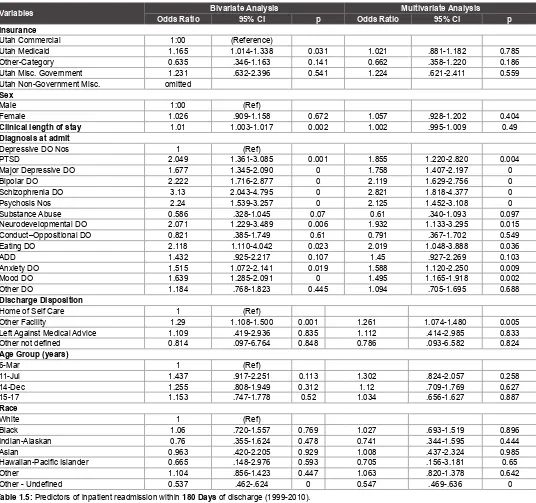
Other-Undefined 0.592 .503-.695 0 0.596 .505-.703 0 Table 1.4: Predictors of inpatient readmission within 90 Days of discharge (1999-2010).
Note: Bivariate analyses are same as crude analyses and in multivariate analyses all independent variables were included.
A number of diagnoses were found statistically significant. Some of these diagnoses are, PTSD with the odds ratio 2.02 (1.382-2.939) and p<0.001, major depressive disorder with odds ratio 1.57 (1.284-1.913, 95% CI) and p<0.001, and psychosis with odds ratio 2.14 (1.508-3.025, 95% CI) and p<0.001. Schizophrenia showed the biggest odds ratio of 3.65 (2.457-5.408, 95% CI) and p<0.001, followed by bipolar disorders with odds ratio of 2.39 (1.889-3.015, 95% CI) and p<0.001, in the bivariate analysis as shown in table 1.2.
Other than diagnosis, one variable that consistently predicted readmission for the time periods looked at was other facility as a discharge disposition. Discharge to other facility was highly statistically significant both in the bivariate and multivariate analysis. Compared to discharge to home or self-care, patients discharged to another facility had 1.84 and 1.24 times higher odds of being readmitted within 1 and 12 months of
discharge, respectively. While controlling for other predictor variables, the odds ratios were as follows: within 1 month 1.84 (p<0.001; 95% CI=1.519-2.216), 3 months 1.43 (p<0.001; 95% CI=1.207-1.699), 6 months 1.26 (p=0.005; 95% CI=1.074-1.480), and 12 months 1.24 (p=0.005; 95% CI=1.067-1.38) of discharge (Table 1.2-1.5).
Discussion
Sci
O p e n H U B f o r S c i e n t i f i c R e s e a r c hForschen
Open Access
major psychosocial issues [22]. In this study, results show that the two major diagnoses that were readmission predictors were schizophrenia and bipolar disorders, with psychosis as third.
In the models used, predictors like Insurance and length of stay are no longer statistically significant while controlling for other variables as seen the multivariate side of tables 1.2-1.5. Almost every diagnosis however, that was a significant predictor in the bivariate analysis still remained a predictor of readmission in the multivariate analysis. In the multivariate analysis, schizophrenia and bipolar disorders still remained as diagnoses that strongly predicted readmission with odds ratio of 3.42 (2.278-5.137, 95% CI), p<0.001, and 2.31 (1.820-2.935, 95% CI), p<0.001, respectively (Table 1.2). These results suggest that more than any other factors, the diagnosis type stands out as a major predictor of readmission in pediatric psychiatric patients.
This study found that discharge of patients to other facilities rather than discharge to home or self-care, presented a 1.24-1.84 times greater likelihood of readmission within a 1- to 12-month period after discharge. These findings, however, should not be taken as independently conclusive. It is possible that discharge to home or self-care is an indicator variable of services that are not available in other facilities. It is not known what support is available in the homes or community settings where the discharges are made. It could be possible that outpatient therapists in the communities know the children better and are more capable of providing the needed help. Discharge to other facilities may also provide better means of follow up. Further research is needed to focus on differences in care between home environments and other facilities that serve as discharge dispositions. Research is also needed to investigate the public health implications resulting from repeated readmissions of children
Variables Odds Ratio Bivariate Analysis95% CI p Odds RatioMultivariate Analysis95% CI p
Insurance
Utah Commercial 1:00 (Reference)
Utah Medicaid 1.165 1.014-1.338 0.031 1.021 .881-1.182 0.785
Other-Category 0.635 .346-1.163 0.141 0.662 .358-1.220 0.186
Utah Misc. Government 1.231 .632-2.396 0.541 1.224 .621-2.411 0.559
Utah Non-Government Misc. omitted
Sex
Male 1:00 (Ref)
Female 1.026 .909-1.158 0.672 1.057 .928-1.202 0.404
Clinical length of stay 1.01 1.003-1.017 0.002 1.002 .995-1.009 0.49
Diagnosis at admit
Depressive DO Nos 1 (Ref)
PTSD 2.049 1.361-3.085 0.001 1.855 1.220-2.820 0.004
Major Depressive DO 1.677 1.345-2.090 0 1.758 1.407-2.197 0
Bipolar DO 2.222 1.716-2.877 0 2.119 1.629-2.756 0
Schizophrenia DO 3.13 2.043-4.795 0 2.821 1.818-4.377 0
Psychosis Nos 2.24 1.539-3.257 0 2.125 1.452-3.108 0
Substance Abuse 0.586 .328-1.045 0.07 0.61 .340-1.093 0.097
Neurodevelopmental DO 2.071 1.229-3.489 0.006 1.932 1.133-3.295 0.015
Conduct–Oppositional DO 0.821 .385-1.749 0.61 0.791 .367-1.702 0.549
Eating DO 2.118 1.110-4.042 0.023 2.019 1.048-3.888 0.036
ADD 1.432 .925-2.217 0.107 1.45 .927-2.269 0.103
Anxiety DO 1.515 1.072-2.141 0.019 1.588 1.120-2.250 0.009
Mood DO 1.639 1.285-2.091 0 1.495 1.165-1.918 0.002
Other DO 1.184 .768-1.823 0.445 1.094 .705-1.695 0.688
Discharge Disposition
Home of Self Care 1 (Ref)
Other Facility 1.29 1.108-1.500 0.001 1.261 1.074-1.480 0.005
Left Against Medical Advice 1.109 .419-2.936 0.835 1.112 .414-2.985 0.833
Other not defined 0.814 .097-6.764 0.848 0.786 .093-6.582 0.824 Age Group (years)
6-Mar 1 (Ref)
11-Jul 1.437 .917-2.251 0.113 1.302 .824-2.057 0.258
14-Dec 1.255 .808-1.949 0.312 1.12 .709-1.769 0.627
15-17 1.153 .747-1.778 0.52 1.034 .656-1.627 0.887
Race
White 1 (Ref)
Black 1.06 .720-1.557 0.769 1.027 .693-1.519 0.896
Indian-Alaskan 0.76 .355-1.624 0.478 0.741 .344-1.595 0.444
Asian 0.963 .420-2.205 0.929 1.008 .437-2.324 0.985
Hawaiian-Pacific Islander 0.665 .148-2.976 0.593 0.705 .156-3.181 0.65
Other 1.104 .856-1.423 0.447 1.063 .820-1.378 0.642
Other - Undefined 0.537 .462-.624 0 0.547 .469-.636 0 Table 1.5: Predictors of inpatient readmission within 180 Days of discharge (1999-2010).
Sci
O p e n H U B f o r S c i e n t i f i c R e s e a r c hForschen
Open Access
with psychiatric illness. Additional research that investigates how other predictor variables interact with the diagnosis may be useful in efforts to understand readmission among pediatric psychiatric patients.
Limitations and strengths
This study was the first of its kind to utilize the large data set spanning 11 years to investigate readmissions. The use of a number of diagnoses as defined by DSM IV and ICD 9 codes was unique to this study, as well as a strength. Use of a large data set from a regional psychiatric hospital of the nature of UNI is a big advantage to the study; however, at the same time, lends great disadvantages because individuals who go back to their local hospitals may not be counted as readmissions. The study was not designed to allow us to see what post discharge treatment variables or considerations may be available to determine whether they could serve as predictor variables. Dual diagnoses or comorbid illnesses such as diabetes, that may interact with psychiatric illness, may be crucial in the prediction of whether a patient is readmitted or not. Our data did not provide information on dual diagnosis or comorbid illness, so we were not able to assess their influence on readmission. This study utilized diagnoses at the time of admission and with psychiatric illness, a change in diagnosis is possible after being an inpatient. It is likely that the results could be different if diagnoses at discharge were available and considered.
Conclusion
When considering bivariate analysis, some of the suspected predictor variables were significant in predicting readmission, but mostly such prediction disappeared when controlling for other variables. For bivariate analysis, patients with the Utah Medicaid type of insurance were more likely to be readmitted compared to those with commercial insurance and other types of insurance, but such prediction again disappeared with the introduction of control variables. The hospital length of stay was also found insignificant in multivariate analysis. Readmission was highly statistically dependent on type of diagnosis. Those most common in the prediction were schizophrenia disorders, bipolar disorders, and unspecified psychosis. Other facility as a discharge disposition was more likely to predict readmission compared to discharge home, with the greatest influence in the first few months following discharge. Early referral to psychiatric services may prevent rehospitalization and lead to better mental health outcomes. Future efforts should be directed at using these results to reduce these readmission rates, and investigate the effect of early referral.
References
1. McCarthy M (2013) Mental disorders common among US children, CDC says. BMJ346: f3281.
2. Blader JC (2004) Symptom, family, and service predictors of children’s psychiatric rehospitalization within one year of discharge. J Am Acad Child Adolesc Psychiatry43: 440-451.
3. Steinhausen HC, Grigoroiu-Serbanescu M, Boyadjieva S, Neumarker KJ, Winkler Metzke C (2008) Course and predictors of rehospitalization in adolescent anorexia nervosa in a multisite study. Int J Eat Disord 4: 29-36.
4. Castro J, Gila A, Puig J, Rodriguez S, Toro J (2004) Predictors of rehospitalization after total weight recovery in adolescents with anorexia nervosa. Int J Eat Disord36: 22-30.
5. Fontanella CA (2008) The influence of clinical, treatment, and
healthcare system characteristics on psychiatric readmission of adolescents. Am J Orthopsychiatry 78: 187-198.
6. Blader JC (2011) Acute inpatient care for psychiatric disorders in the United States, 1996 through 2007. Arch Gen Psychiatry 68: 1276-1283.
7. Fontanella CA, Bridge JA, Campo JV (2009) Psychotropic medication changes, polypharmacy, and the risk of early readmission in suicidal adolescent inpatients. Ann Pharmacother43: 1939-1947.
8. James A, Clacey J, Seagroatt V, Goldacre M (2010) Adolescent inpatient psychiatric admission rates and subsequent one-year mortality in England: 1998-2004. J Child Psychol Psychiatry51: 1395-1404. 9. Gearing RE, Mian I, Sholonsky A, Barber J, Nicholas D, et al. (2009)
Developing a risk-model of time to first-relapse for children and
adolescents with a psychotic disorder. J Nerv Ment Dis197: 6-14. 10. Lyons JS, O’Mahoney MT, Miller SI, Neme J, Kabat J, et al. (1997)
Predicting readmission to the psychiatric hospital in a managed care environment: implications for quality indicators. Am J Psychiatry 154: 337-340.
11. Lin HC, Lee HC (2009) Psychiatrists’ caseload volume, length of stay and mental healthcare readmission rates: a three-year population-based study. Psychiatry Res 166: 15-23.
12. Lin CH, Chen WL, Lin CM, Lee MD, Ko MC, et al. (2010) Predictors of psychiatric readmissions in the short- and long-term: a population-based study in Taiwan. Clinics (Sao Paulo) 65: 481-489.
13. Appleby L, Desai PN, Luchins DJ, Gibbons RD, Hedeker DR (1993) Length of stay and recidivism in schizophrenia: a study of public psychiatric hospital patients. Am J Psychiatry 150: 72-76.
14. Dickey B, Normand SL, Norton EC, Rupp A, Azeni H (2001) Managed care and children’s behavioral health services in Massachusetts. Psychiatr Serv52: 183-188.
15. James S, Charlemagne SJ, Gilman AB, Alemi Q, Smith RL, et al. (2010) Post-discharge services and psychiatric rehospitalization among children and youth. Adm Policy Ment Health 37: 433-445. 16. Bobier C, Warwick M (2005) Factors associated with readmission to
adolescent psychiatric care. Aust N Z J Psychiatry39: 600-606. 17. Romansky JB, Lyons JS, Lehner RK, West CM(2003) Factors related
to psychiatric hospital readmission among children and adolescents in state custody. Psychiatr Serv 54: 356-362.
18. Sullivan G, Wells KB, Morgenstern H, Leake B (1995) Identifying
modifiable risk factors for rehospitalization: a case-control study of
seriously mentally ill persons in Mississippi. Am J Psychiatry 152: 1749-1756.
19. Arnold EM, Goldston DB, Ruggiero A, Reboussin BA, Daniel SS, et al. (2003) Rates and predictors of rehospitalization among formerly hospitalized adolescents. Psychiatr Serv 54: 994-998.
20. Barker D, Jairam R, Rocca A, Goddard L, Matthey S (2010) Why do adolescents return to an acute psychiatric unit? Australas Psychiatry 18: 551-555.
21. Esteve R, Marquina-Aponte V (2012) Children’s pain perspectives. Child Care Health Dev 38: 441-452.