© Universiti Tun Hussein Onn Malaysia Publisher’s Office
IJIE
Journal homepage: http://penerbit.uthm.edu.my/ojs/index.php/ijie
The International
Journal of
Integrated
Engineering
ISSN : 2229-838X e-ISSN : 2600-7916
Study of Numerical Schemes for the CFD Simulation of Human
Airways
Bholu Kumar
1*, Vivek Kumar Srivastav
2, Anuj Jain
3, Akshoy Ranjan Paul
31Department of Mechanical Engineering, National Institute of Technology Patna, Patna, 800005, INDIA
2Department of Mathematics, Motihari College of Engineering, Motihari, 845401, INDIA
3Department of Applied Mechanics,
Motilal Nehru National Institute of Technology Allahabad, Prayagraj, 211004, INDIA
*Corresponding author
DOI: https://doi.org/10.30880/ijie.2019.11.08.005
Received 25 december 2018; Accepted 15 November 2019; Available online 15 December 2019
1. Introduction
Nowadays, computational fluid dynamics (CFD) tools are widely used in many biological systems; human respiratory system is one of them. As, it is very difficult to know the internal flow physics of air/particle in vivo system, therefore CFD is playing vital role for an insight view of human respiratory tract using CT scan data. The realistic human airway is irregular and asymmetrical, and hence realistic results can be captured using CT/MRI data. Therefore, in present scenario researchers are concentrated on anatomical based model (CT/MRI) that reflects realistic condition of person [1]. The geometrical change has prominent effects on the CFD simulation; therefore, human airway model from CT/MRI must be studied.
Luo and Liu [2] used fifth generation CT scan model for steady state CFD simulation. It is found that laryngeal jet produced more disturbances in term of turbulence which is captured using low Reynolds number k-ω turbulence model. It was obtained that deposition of particles in CT scanned model is different from symmetrical model. Inthavong et al. reported deposition of the drugs form of micron-particle in realistic human respiratory model [3]. The study was in
two-Abstract: Computational fluid dynamics (CFD) is increasingly used nowadays to capture air and particle transport in the human respiratory tract. In the present study, computer tomography (CT) scan based respiratory tract model is used for the CFD simulation. The main objective of the present study is to compare different pressure-velocity schemes (SIMPLE, SIMPLEC, PISO and COUPLED schemes) in terms of convergence and computational time. Numerical simulation is done for the three inhalation flow rates, namely 20, 40 and 60 L/min for predictions of flow phenomena inside the sixth-generation human respiratory model and also to predict the effects of flow parameters; pressures and velocity on the sixth-generation human respiratory tract. The SST k-ω model with low Reynolds number corrections is used to capture the turbulence effect. The findings will be useful for medical practitioner to understand complex airflow patterns in the human airways. Also, pressure and velocity distribution inside the human respiratory tract model will help to define the medical phenomena in core engineering terms.
Their results in terms of velocity contours and secondary flow vectors showed that vortex formation in downstream of the bifurcation indicate particle deposition. They found that breath hold allows and maximizes the local targeted deposition in first few generations. The total deposition fraction in sixth generation during inhalation phase (5 μm→ 12.9%, 10 μm→21.6 %) was compared with single inhalation and breath hold (5 μm→30.1%, 10 μm→50.9 %). Tian et al. performed CFD modelling of human airway to improve the delivery of inhaled pharmaceutical drugs [4]. CFD analysis has been performed for steady state inhalation condition. The airway model was extended from mouth to the fifteenth-generation bronchus. It was predicted that deposition of drugs to the targeted region can be controlled by inlet temperature and aerosol size. Elcner et al. [5] used seventh generation model for the study of influence of boundary conditions on internal flow physics. In the two-phase flow simulation of air and particle Gorji et al. [6] investigated that the maximum velocity change occurs at the larynx region of the human airways. The irregularities and bending sections of the realistic model causes higher turbulence and these regions are highly prone to particle trap at higher flow rates. Lintermann and Schroder [7] performed two cases of flow simulation. In the first investigation, large and heavy particles with a diameter of 100 microns and in the second investigation small particle mixture with diameter 2.5-10 microns were simulated. It was investigated that the most of the heavier particles deposited in the upper respiratory tract and at the bifurcations itself. However, lighter particles penetrate the human lung below the sixth generation and may cause the lung injury.
Selection of appropriated turbulence model is an essential aspect for accurate capturing of the flow physics due to turbulence. The two-equation k-ε Realizable turbulence model is frequently used in high-speed flow in the recent past [8-9]. The standard k-ε model is not recommended due to its larger dispersion. Zhang and Kleinstreuer [10] suggested the LRN k-ω model, but Jayaraju et al. [11] later suggested the SST k-ω model. Mihaescu et al. [12] compared k-ε, k-ω and LES models in a realistic pharyngeal airway model and found differences of 45% between the k-ε and the LES mean axial velocities calculated in the pharynx region [10-12]. These differences were much lower (within 30%) in the case of the k-ω model. Most of the published CFD results were obtained for steady inspiration which is understandable because of the enormous computational time needed to simulate an entire breathing cycle [13].
It is found from the literature survey that limited researchers have used CT scan model in the recent past and most of the studies were concentrated either on two-phase study or boundary conditions. However, comparisons of different numerical schemes have not been reported till now. Therefore, present study is concentrated on comparison of different pressure-velocity schemes in terms of computational time. The comparison of different models will help to select the optimum pressure-velocity schemes in case of human respiratory model.
2.
Methodology
Three dimensional reconstruction of sixth generation human airways is done from CT-scan images. The computational geometry is constructed from CT-scan of a healthy non-smoking male.
The computational model is extending from oral cavity (mouth of human respiratory tract) to the sixth generation of human respiratory model. Initially, the CT scan images (DICOM file) are imported into the MIMICS software which is the strong image processing software where all slices are segmented and exported in STL (Standard Tessellation Language) format. The STL format of the model from the MIMICS is imported into the Solid-works software for further modification in the computational geometry. Thereafter, the computational model is imported into the ANSYS design
Fig. 1 - CT scan based Human Respiratory Tract
modular (Fig.1). The equivalent diameter of outlet cross-sections of sixth generation human airways lies from 1.17 mm to 5.45 mm.
2.1
Grid Generation
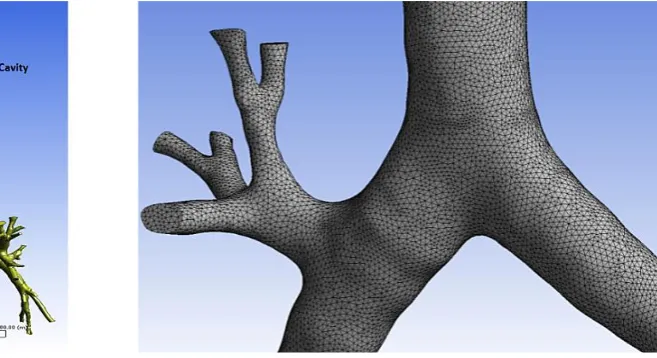
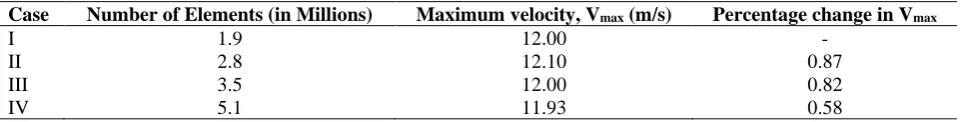
The meshing of the computational model is generated into the ICEM module of the ANSYS workbench with tetrahedral elements, which is most suitable and appropriate for this model. The maximum skewness is found to be 0.86 which is obtained by huge effort and refinement. The grid independency test is achieved at the grid size of 3,538,213. The maximum velocity and area-average velocity are evaluated on XZ plane at the vertical location of Y = 0.098 m for the grid independence test. The grid generation and grid independency test (GIT) of the computational model is given in the Fig. 2 and Tables 1and 2 respectively.
Table 1 - GIT with reference to maximum velocity
Case Number of Elements (in Millions) Maximum velocity, Vmax (m/s) Percentage change in Vmax
I 1.9 12.00 -
II 2.8 12.10 0.87
III 3.5 12.00 0.82
IV 5.1 11.93 0.58
Table 2 - GIT with reference to area-average velocity
Case Number of Elements (in Millions) Area average velocity, Vavg (m/s) Percentage change in Vavg
I 1.9 9.88 -
II 2.8 10.03 1.50
III 3.5 9.67 -3.67
IV 5.1 9.75 0.79
2.2
Governing Equations
The air flow is assumed to be steady and incompressible.
2.2.1
Continuity Equation
Since flow has been assumed to be steady and incompressible therefore,
0
u
j
x
j
=
(1)2.2.2
Momentum Equation
( )
2
1
i j i
j i j j
u u
p
u
x
x
x x
= −
+
(2)Where, μ = coefficient of dynamic viscosity ui, uj (i, j= 1, 2, 3) is the velocity component in x, y and z-direction.
p = pressure, ρ = density of fluid.
2.2.3
Turbulence Model
The transport equations for k (turbulent kinetic energy) and ω (specific turbulent dissipation rate) is k-ω turbulent model are:
u k ui k ( ) k
j x ij x x k T x
j j j j
= − + + (3)u ui 2 ( )
j x k ij x x T x
j j j j
= − + + (4)
Where, , and
T ij
are kinetic molecular viscosity, turbulent viscosity, and Reynolds stress tensor respectively.0.09, 0.555, 0.8333, 1 0.5
C and
k w
= = = = = =
2.3
Boundary Conditions
The velocity inlet and pressure outlet boundary conditions are respectively applied at the inlet and all 32 outlets of the human airways. Laminar and turbulence models are applied depending upon the type of air flow, based on the numerical value of Reynolds number. The SST k-ω turbulence model is applied for the turbulent flow. The enhanced wall function with no slip is applied at the walls of the human airways. The numerical investigation is carried out for the flow rates of 20, 40, and 60 L/min respectively. The properties of air at normal conditions are taken in this study, i.e. density of 1.225 kg/m3 and dynamic viscosity of 1.78 × 10⁻⁵ N-s/m2.
2.4
Numerical Simulation
Numerical simulation is carried out by the FLUENT solver of the ANSYS software. The simulations are carried out for the pressure-velocity coupling schemes, namely SIMPLE, SIMPLEC, PISO, and COUPLED. The simulation was converges after 11000 iterations with the convergence criteria of 110-4. The pressure and momentum term was discretized by 2nd order upwind scheme. The computational work is run on the IBM blade server, having eight blades with 32 GB RAM and Octa-core processors for each blade.
2.5
Computational Validation
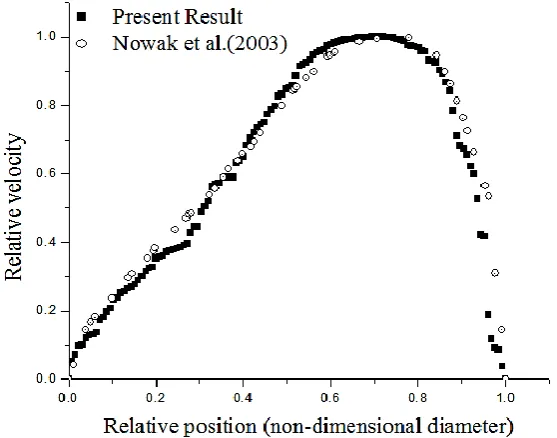
In the present study, CFD validation is carried out with the computational results presented by Nowak et al. [14]. For their study, they have used simplified model given by Weibel [15]. For the same respiratory model and boundary conditions, velocity profile is evaluated at the mid plane of 4th generation. The validation is shown in Fig. 3, which is within the acceptable limit. This validation is performed for the inspiratory flow rate of 40 L/min.
Fig. 3 - Relative velocity at mid-section of bronchus-4.
3.
Results and Discussion
3.1 Measurements of type of flow (Reynolds number at the different locations of the Human Airways):
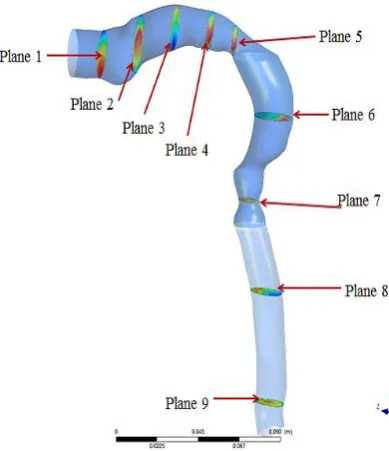
Fig. 4 - Different planes for analyzing the flow variations in the human respiratory tract
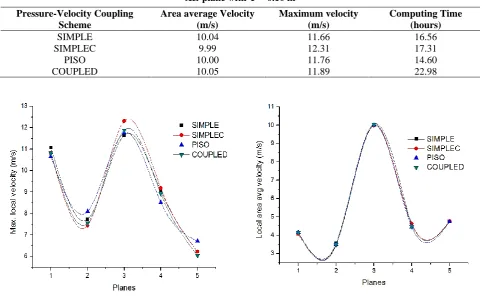
3.2 Comparison of Pressure-Velocity Coupling Schemes:
The computational simulation at the inspiratory flow rate of 60 L/min is carried out one-by-one using the pressure velocity coupling scheme of SIMPLE, SIMPLEC, PISO, and COUPLED. The simulations are run for the total number of ten thousand iterations with the convergence criteria of 1x10⁻⁴. It is observed that the computational simulations achieve their convergence in order of 6x10⁴ to 10x104 iterations respective to the applied pressure-velocity coupling schemes. Among all the four schemes it is investigated that the similar results are executed from all the schemes. However, the PISO scheme takes the least computational time in comparison with other schemes for the same results and therefore, PISO scheme is adopted for further investigations. The comparison of these four computational schemes is shown in the Table 4, Table 5, Fig. 5, and Fig. 6.
Table 3 - Type of flow at the different cross-sections of the human respiratory tract
Cross-section
Reynolds Number at 20 L/min
Reynolds Number at 40 L/min
Reynolds Number at 60 L/min
Inlet 1328 2656 3985
Plane 6 1896 3542 5129
Plane 7 2617 5163 7764
Plane 8 1872 3694 5444
Plane 9 1795 3602 5385
Table 4 - Comparison among SIMPLE, SIMPLEC, PISO, and COUPLED pressure-velocity coupling schemes at YZ-plane with X = 0.077 m
Pressure-Velocity Coupling Scheme
Area average Velocity (m/s)
Maximum velocity (m/s)
Computing Time (hours)
SIMPLE 4.12 11.08 16.56
SIMPLEC 4.02 10.82 17.31
PISO 4.15 10.66 14.60
COUPLED 4.15 10.82 22.98
Table 5 - Comparison among SIMPLE, SIMPLEC, PISO, and COUPLED pressure-velocity coupling schemes at XZ-plane with Y = 0.10 m
Pressure-Velocity Coupling Scheme
Area average Velocity (m/s)
Maximum velocity (m/s)
Computing Time (hours)
SIMPLE 10.04 11.66 16.56
SIMPLEC 9.99 12.31 17.31
PISO 10.00 11.76 14.60
COUPLED 10.05 11.89 22.98
In above figures (Fig. 5 and Fig. 6) the points on the X-axis (1-5) are indicating the Planes YZ at X = 0.077 m, Plane XZ at Y = 0.14 m, 0.10 m, 0.06 m and 0.01 m respectively.
Fig. 5 - Plot of maximum local velocity at different locations corresponding to different
Pressure-velocity schemes
Fig. 6 - Plot area average velocity on Planes YZ and XZ for different pressure-velocity coupling
schemes.
Fig. 7 - Plot of area average velocity at the different locations of the Human airways, from planes 1 to 9.
Fig. 8 - Plot of local maximum velocity at the different locations of the Human airways, from
Fig. 9 - Velocity contour at flow rate of 20 L/min Fig. 12 - Pressure contour at flow rate of 20 L/min
Fig. 10 - Velocity contour at flow rate of 40 L/min Fig. 13 - Pressure contour at flow rate of 40 L/min
3.3 Velocity distribution from inlet of mouth to the sixth generation of human airways:
The velocity variation is evaluated for the three flow rates (20, 40, and 60 L/min) at different locations of human airways which is depicted from the Fig. 4. The local area average velocity is computed at different planes which is shown in the Fig. 7. It is seen from the graph that peak values of area average velocity are found at planes 5 and at plane 7 corresponding to 60 L/min of inhalation flow rate. In comparison to the other planes, these values are maximum at plane 5 & 7 because of minimum cross-sectional area. The max local velocity is computed at different planes and is shown in Fig. 8. The maximum local velocity is occurred at plane-7 due to reducing of cross sectional area. It is seen that the disturbances in the air flow pattern occur from plane 4 to 8. It is seen from the Fig. 8 and Fig.9 to Fig.11 that larynx region has prominent disturbance in comparison of the other locations. As the flow rates increases from 20 L/min to 60 L/min, velocity magnitude as well as area of disturbance increases near the larynx region. Thus, it is anticipated that during the running or exercise condition, high flow disturbance occurs near the larynx region due to sudden reduction in the cross-section area. This disturbance in the path leads the phenomena of turbulence. It is also expected that because of high velocity near the epiglottis region, velocity gradient may high and therefore peak-wall shear stress in this region. This peak values may create wall injury. It is well known that the flow in the human lungs occur due to the pressure difference process. During the inhalation, pressure of inlet (at the inlet of oral cavity) is higher in comparison of outlet (outlet of lower generation bronchus), so that the flow moves from inlet to outlet. The pressure contours for three inhalation flow (20, 40 and 60 L/min) rates is shown in Fig. 12 to Fig. 14. Higher pressure is observed in the upper part of the oral cavity due to minimum velocity. However, lower pressure is found in the lower part of the oral cavity and this keep on reducing as it moves towards the lower parts of the lungs.
3.4 Computational flow visualizations using velocity and pressure contours:
The velocity and pressure contours (Fig.9 to Fig. 14) are computed at the vertical mid-plane of the human airways respectively for the inspiratory flow rates of 20, 40 and 60 L/min. It is clearly evident from the velocity and pressure contours that the maximum velocity and pressure changes occur at the larynx region of the human airways. The strength of laryngeal jet increases with increasing inspiratory flow rates. During the inhalation more pressure is reported in the upper respiratory tract as compared to the lower respiratory tract and increasing level of pressure is also seen in upper respiratory tract with increasing rate of inspiratory flow rates.
4. Conclusions
In the present study, CT scan model have been used for the airflow study. The comparative analysis is carried out among the four pressure-velocity schemes namely, SIMPLE, SIMPLEC, PISO and COUPLED schemes at the inspiratory flow rate of 60 L/min in order the minimize the computational cost. Thereafter, computational simulations with appropriated pressure-velocity coupling schemes are carried out for the insight understanding of dynamics of airflow into the human respiratory tract. It is found that PISO pressure-velocity coupling scheme takes least time of convergence as compared to other schemes for the similar results. Higher velocity variation is reported in the oral cavity as compared to the other locations of the human respiratory tract. A laminar flow with flow rate of 20 L/min at inlet (i.e. at the mouth) becomes turbulent in larynx section of the oral cavity due to the irregularities and the presence of cartilage rings of the human airways. From the plot of velocity at the different locations of the Human airways and flow visualization from the contours of velocity and pressure, it is concluded that the peak velocity gradient occurs in oral cavity and bifurcation junctions that may leads to wall injury. It is also noted the PISO pressure velocity coupling scheme compete the other schemes with similar results at the flow rates of 60 L/min (heavy breathing condition), therefore PISO scheme is suitable in higher breathing condition. However, further investigations need to perform in future to check the suitability of PISO scheme in light breathing (15 L/min) and in normal breathing (30 L/min) conditions.
Acknowledgement
This work was supported by the Project on “Experimental and Computational Studies on Human Airways” sanctioned by Science and Engineering Research Board (sanctioned no. SR/S3/MERC/0073/2012), Department of Science and Technology, Govt. of India with financial support.
References
[1] C, Kleinstreuer., and Z, Zhang (2010). Airflow and Particle Transport in the Human Respiratory System. Annual Review, Fluid Mechanics, 42, 301-334.
[2] H.Y, Luo., and Y, Liu (2009). Modeling the bifurcation flow in CT-scanned human lungs airways. Journal of Biomechanics, 42, 1869-1876.
[4] Geng, T., Philip Worth, L., Guoguang, Su., and Michael, H (2014). Characterization of Respiratory Drug Delivery with Enhanced Condensation Grothusing an Individual Path Model of Entire Tracheobronchial Airways. Annals of Biomedical Engineering, 39, 1139-1153.
[5] Jakub, E., Michaela, C., and Miroslav, J (2014). The influence of boundary conditions to the flow through model of upper part of the human respiratory system. EDP web of Conferences., 67, 20-25.
[6] Gorji, M.R., Gorji, T.B., and Gorji, B.M (2016). Details of regional particle deposition and airflow structures in a realistic model of human tracheobronchial airway: two-phase flow simulation. Computers in Biology and Medicine, 74, 1-17.
[7] Lintermann, A., and Schroder, W (2017). Simulation of aerosol particle deposition in the upper human tracheobronchial tract. European Journal of Mechanics B/Fluids, 63, 73-89.
[8] Azamahani S., Nurul Akma Mohd Y., Saiful Anuar Abd H., Al Emran Ismail, Salihatun S., Sufizar A., Mohd Nasrull Abdol R., Shahruddin M., and Sallehuddin Shah A (2018). A Comparative Study of Turbulence Models on Aerodynamics Characteristics of NACA0012 Airfoil. International Journal of Integrated Engineering, 10 (1), 134-137.
[9] Lohia, Devendra K., Kumar, B., Srivastava, S., and Paliwal, H.K (2018). Numerical Simulation of Supersonic Over-expanded Jet from 2-D Convergent-Divergent Nozzle. International Journal of Integrated Engineering, 10 (8), 195-201.
[10] C, Kleinstreuer., and Z, Zhang (2003). Laminar-to-turbulent fluid-particle flows in human airway model. International Journal of Multiphase Flow, 29, 271-289.
[11] S.T, Jayaraju., M, Brouns., S, Verbanck., and C, Lacor (2007). Fluid flow and particle deposition analysis in realistic extrathoracic airway model using unstructured grids. Journal of Aerosol Science, 38, 494-508.
[12] Mihai, M., Shanmugam, M., Maninder, K., Sid, K., and Ephraim, G (2008). Large Eddy Simulation and Reynolds-Averaged Navier-Stokes modeling of flow in a realistic pharyngeal airway model: An investigation of obstructive sleep apnea.Journal of Biomechanics, 41, 2279-2288.
[13] Pejman, Farhadi G., Erfan, K., Omid, A., Abolhassan, F., Jiyuan, Tu., and Alireza, S (2012). Numerical analysis of micro-and nano-particle deposition in a realistic human upper airway.Computers in Biology and Medicine, 42, 39-49.
[14] Natalya, N., Prashant P, Kakade., and Ananth V, A (2003). Computational Fluid Dynamic Simulation of Airflow and Aerosol Deposition in Human Lungs.Annals of Biomedical Engineering, 31, 374-390.