[Akbar* et al., 5(7): July, 2018]
ISSN: 2349-5197
Impact Factor: 3.765
I
NTERNATIONAL
J
OURNAL OF
R
ESEARCH
S
CIENCE &
M
ANAGEMENT
DIFFUSION BONDING USING TAGUCHI METHOD
Assist. Prof. Dr. Ahmed A. Akbar*
1& Samer K. Khaleel
2*1
Asst. Prof. Dr. at University of Technology, Production Engineering and Metallurgy, Iraq
2Master student in the research coarse at University of Technology, Production Engineering and
Metallurgy, Iraq
DOI: 10.5281/zenodo.1307396
Keywords
:
Diffusion bonding, Aluminum alloy, Interlayers, Tensile strength, Microstructure.Abstract
The present study includes characterization of diffusion bonding of aluminum alloy 2024-O without and with applying different interlayers as pure powder such as copper, silver and titanium. Bonding was performed in vacuum up to (1×10⁻⁵ mbar) using vacuum system bonding. Aluminum alloy 2024-O specimens was used as cylinder shape as diameter (15mm) and (35mm) length and interlayer thickness was equal 100 ϻm, under bonding conditions of (330-480°C) and (1-4 Mpa) and duration of (60 min). Interlayer was classified according to diffusion coefficient of each element in the base alloy.TaguchiMethod was applied to reduce the number of experiments and determine the optimum bonding conditions. Optimum bonding conditions were (430 °C) and (4 Mpa) during (60 min) time as bonding and the best interlayer used was copper powder. Tensile testing of bonded joint was performance for the specimen at optimum bonding condition. The ultimate strength was found equal 189.2 Mpa with an efficiency of 91.8 % compared to the ultimate strength of aluminum alloy 2024-O.Minitab 17 program gave the accuracy of the model according to relationship between every factor and tensile strength by scatter plots to determine the accuracy of model. The accuracy of model is 99.13 % this mean that the model is perfect. Minitab 17 program gave A statistical model equation that represent the final model equationthat was deduced using Minitab 17 which gives the effect of all variables (temperature, pressure and interlayer) on the bonding strength of the joint.
Introduction
[Akbar* et al., 5(7): July, 2018]
ISSN: 2349-5197
Impact Factor: 3.765
I
NTERNATIONAL
J
OURNAL OF
R
ESEARCH
S
CIENCE &
M
ANAGEMENT
obtain sound joints. Minitab 17 program is used in this research to know number of the specimens of aluminum alloy 2024-O that will be joined and to reduce number of experiments tensile test and to evaluate the effect of the factors on the joint strength so to know the optimum bonding conditions for joining aluminum alloy 2024-O.
Experimental Work
Materials and Methods
Aluminum alloy 2024-O has been used as base metal and the interlayers used in this research were pure powders of copper, silver and titanium. The materials were examined for chemical composition analysis and show in tables.
Table (1) The chemical composition of aluminum alloy 2024-O.
Elements Si Fe Cu Mn Mg Cr Zn Ti
Standard 0.5 0.5 3.8-4.9 0.3-0.9 1.2-1.8 0.1 0.25 0.15
Measured 0.191 0.178 4.9 0.813 1.22 0.0086 0.136 0.015
Table (2) The chemical composition of the copper powder.
Table (3) The chemical composition of the silver powder.
Ag Si Cu Fe Mn C
99.657 0.171 0.073 0.063 0.027 0.01
Table (4) The chemical composition of the titanium powder.
Ti Fe Ca Cu Mn Zn
99.872 0.034 0.031 0.027 0.024 0.012
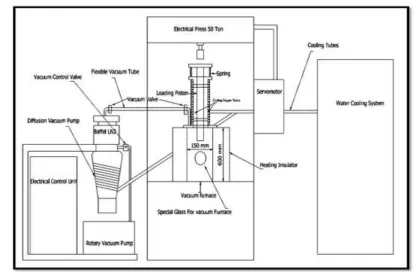
Forjoining aluminum alloy 2024-O with different interlayers of powders (copper, silver and titanum) by diffusion bonding process to obtain sound bonding joint, a diffusion bonding vacuum system is required. The purpose of joining under the vacuum is to reduce the impurity contained, even for the case of the high reactive metals and prevent oxidation from degassing materials. The diffusion bonding system consists of vacuum tube furnace, diffusion vacuum pump, rotary vacuum pump, heating system, cooling system, loading unit, control unit. The whole system is shown in figure (1).
Cu Pb In
[Akbar* et al., 5(7): July, 2018]
ISSN: 2349-5197
Impact Factor: 3.765
I
NTERNATIONAL
J
OURNAL OF
R
ESEARCH
S
CIENCE &
M
ANAGEMENT
Figure (1) The schematic diagram of the diffusion bonding system.
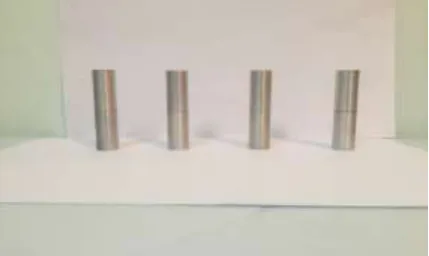
The aluminum alloy 2024-O diameter is machined to15 mm. Then, cut by wire cutting machine into cylinder parts of 35mm length and 15mm diameter, as shown in figure (2), to prepare for diffusion bonding process. The surface of specimens has been prepared by grinding and polishing processes to obtain suitable flat surface for bonding. Surface specimens was grinded by using different grades of Silicon carbide paper (320,400,600,800,1000,2000 and 3000) grades then polished by using diamond paste 0.3 ϻm grain size. Grinding and polishing performed by Grinder polisher machine (Mopao 160E). The roughness of surface after grinding and polshing has been meassured by using surfacce roughness portable divece. The value of the surface roughness of all the specimens is (0.4 µm). Ultrasonic bath device has been used for cleaning the specimens with acetone for 15min to remove any contaminations adhering on the specimens.The experientials of this research has been designed using Taguchi Method according to three factors with four levels as shown in table (5). Interlayers are classified according to their diffusion coefficient in aluminum.
[Akbar* et al., 5(7): July, 2018]
ISSN: 2349-5197
Impact Factor: 3.765
I
NTERNATIONAL
J
OURNAL OF
R
ESEARCH
S
CIENCE &
M
ANAGEMENT
Table (5) Experimental design matrix
EXP. Numbers Interlayers Bonding temperature
(°C)
Bonding pressure (Mpa)
1 None 330 1
2 None 380 2
3 None 430 3
4 None 480 4
5 Ag 330 2
6 Ag 380 1
7 Ag 430 4
8 Ag 480 3
9 Cu 330 3
10 Cu 380 4
11 Cu 430 1
12 Cu 480 2
13 Ti 330 4
14 Ti 380 3
15 Ti 430 2
16 Ti 480 1
Aluminum alloy 2024-O is to be joined by using diffusion bonding processes using different powders of Cu, Ag, Ti as interlayers and others without interlayers at different bonding conditions in vacuum (1×10⁻⁵ mbar). The experiments of diffusion bonding are designed by using Taguchi Method with different condition. Figure (3) shows set of specimens after diffusion bonding process.
Figure (3) diffusion bonding joint specimens
Results and Discussion
3.1 Tensile Test
diffusion bonded specimen have been cut by wire cutting machine into tensile test specimens. The tensile strength has been examined to evaluate the strength of joints by knowing the ultimate tensile strength. Table (6) shows the results of tensile strength of diffusion bonding specimens.
Table (6) Results of tensile strength of diffusion bonding specimens.
EXP. Numbers Interlayers Bonding
temperature °C Bonding pressure (Mpa) Fracture location Ultimate strength (Mpa)
1 None 330 1 at interface 122.66
2 None 380 2 at base metal 113.53
[Akbar* et al., 5(7): July, 2018]
ISSN: 2349-5197
Impact Factor: 3.765
I
NTERNATIONAL
J
OURNAL OF
R
ESEARCH
S
CIENCE &
M
ANAGEMENT
4 None 480 4 at interface 146.13
5 Ag 330 2 at base metal 75.8
6 Ag 380 1 at base metal 65.89
7 Ag 430 4 at base metal 60.17
8 Ag 480 3 at base metal 50
9 Cu 330 3 at interface 173.71
10 Cu 380 4 at interface 187.53
11 Cu 430 1 at interface 191.73
12 Cu 480 2 at interface 178.11
13 Ti 330 4 at base metal 4.1
14 Ti 380 3 at base metal 6.78
15 Ti 430 2 at base metal 10.87
16 Ti 480 1 at base metal 11.23
From table (6), all tensile test specimens for copper interlayer, fracture occurred at base metal. This means that bonded area is higher strength at bonding zone due to good surface roughness of specimens and high vacuum atmosphere with good conditions which led to diffusion of copper powder towards base metal. The best results have been obtained when using copper powder as interlayer and the range of ultimate tensile strength was (173-191) Mpa. The bonding strength for joint bonded without interlayer gives good results and the range of ultimate tensile strength was (122-146) Mpa. lowest ultimate tensile strength was obtained when bonding with silver and titanium interlayers, the range of ultimate tensile strength for silver is (50-75) Mpa and for titanium was (4-11) Mpa. The maximum ultimate tensile strength is 191.73 Mpa with copper powder interlayer at bonding temperature of 430°C and applied pressure of 1 Mpa.
3.2 Optimum Conditions selection
The optimum conditions of temperature and pressure can be found of each level for each factor by averaging the results of ultimate tensile strength at table (6) which contain that level and that factor.
1- The optimum interlayer
None interlayer = (122.66 + 113.53 + 139.37 + 146.13) / 4 = 130.42 Mpa Silver interlayer = (75.8 + 65.89 + 60.17 + 50) / 4 = 62.96 Mpa
Copper interlayer = (173.71 + 187.53 + 191.73 + 178.11)/ 4 =182.77 Mpa Titanium interlayer = (4.1 + 6.78 + 10.87 + 11.23) = 8.24 Mpa
2- The optimum temperature
T1 = (122.66 + 75.8 + 173.71 + 4) / 4 = 94.06 Mpa T2 = (113.35 + 65.89 + 187.53 + 6.78) / 4 = 93.45 Mpa T3= (139.73 + 60.17 + 191.73 + 10.87) / 4 = 100.62 Mpa T4 = (146.13 + 50 + 178.11 + 11.23) / 4 = 96.31 Mpa
3- The optimum bonding pressure
P1= (122.66 + 65.89 + 191.73 + 11.23) / 4 = 97.87 Mpa P2 = (113.56 + 75.8 + 178.11 + 10.87) / 4 = 94.57 Mpa P3 = (139.37 + 50 + 173.71 + 6.78) / 4 = 92.46 Mpa P4 = (146.13 + 60.17 + 187.53 + 4.1) / 4 = 99.48 Mpa
From the above, it can be seen that the best combination of factors is Copper interlayer, T3 and P4 these are factors which produce the largest results
T3 = 430 °C P4 = 4 Mpa
The optimum bonding conditions is applied to calculate the tensile strength. The tensile strength value of optimum bonding conditions is 189.2 Mpa.
[Akbar* et al., 5(7): July, 2018]
ISSN: 2349-5197
Impact Factor: 3.765
I
NTERNATIONAL
J
OURNAL OF
R
ESEARCH
S
CIENCE &
M
ANAGEMENT
3.3 Model Design
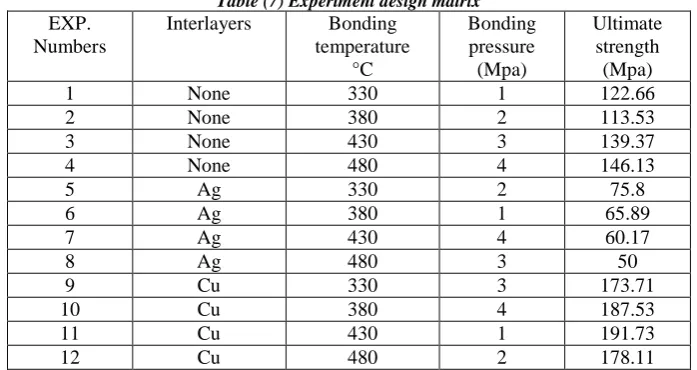
The results of tensile test value of titanium interlayer are neglected from table (7) since its values of ultimate tensile strength were smallCompared to other results for copper, silver and without interlayer. experiment design matrix is again rewritten without titanium interlayer to design the perfect model.
Table (7) Experiment design matrix EXP.
Numbers
Interlayers Bonding
temperature °C
Bonding pressure (Mpa)
Ultimate strength (Mpa)
1 None 330 1 122.66
2 None 380 2 113.53
3 None 430 3 139.37
4 None 480 4 146.13
5 Ag 330 2 75.8
6 Ag 380 1 65.89
7 Ag 430 4 60.17
8 Ag 480 3 50
9 Cu 330 3 173.71
10 Cu 380 4 187.53
11 Cu 430 1 191.73
12 Cu 480 2 178.11
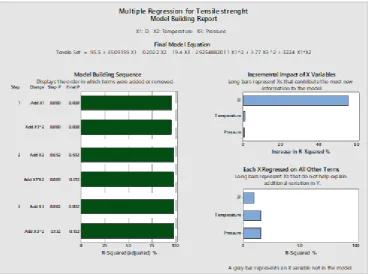
Minitab 17 has been used for regression and analysis of the results as given in (4) to get final model equation.
Figure (4) Multiple regression of tensile strength
[Akbar* et al., 5(7): July, 2018]
ISSN: 2349-5197
Impact Factor: 3.765
I
NTERNATIONAL
J
OURNAL OF
R
ESEARCH
S
CIENCE &
M
ANAGEMENT
Figure (5) Accuracy of model
The analysis of results by Minitab 17 program shows that the interlayer factor is the dominant factor which affects diffusion bonding process while Pressure and temperature are of less affects. Finally, Minitab 17 program gave imperical equation that represent the final model equation. The final model equation can be used with any temperature, pressure and diffusion coefficient to gives tensile strength value.
[Akbar* et al., 5(7): July, 2018]
ISSN: 2349-5197
Impact Factor: 3.765
I
NTERNATIONAL
J
OURNAL OF
R
ESEARCH
S
CIENCE &
M
ANAGEMENT
Tensile strength = 95.5+ 3509159 X1 - 0.2022 X2 -19.4 X3- 29254882011 (X1)2 +
3.77 (X3)2+ 3224 (X1)×(X2) X1 = Diffusion coefficient.
X2 = Bonding temperature. X3 = Bonding pressure.
3.4 Multilevel Factorial Design
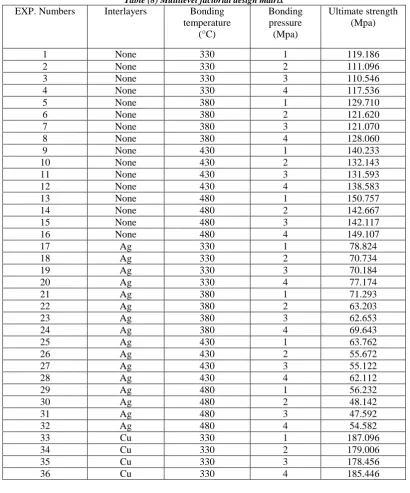
A new design of experiments has been achieved by multilevel factorial design in Minitab program for all experiments shown in table (8). multilevel factorial design given 48 experiments and the results of tensile strength obtained from the imperical equation.
Table (8) Multilevel factorial design matrix
EXP. Numbers Interlayers Bonding
temperature (°C) Bonding pressure (Mpa) Ultimate strength (Mpa)
1 None 330 1 119.186
2 None 330 2 111.096
3 None 330 3 110.546
4 None 330 4 117.536
5 None 380 1 129.710
6 None 380 2 121.620
7 None 380 3 121.070
8 None 380 4 128.060
9 None 430 1 140.233
10 None 430 2 132.143
11 None 430 3 131.593
12 None 430 4 138.583
13 None 480 1 150.757
14 None 480 2 142.667
15 None 480 3 142.117
16 None 480 4 149.107
17 Ag 330 1 78.824
18 Ag 330 2 70.734
19 Ag 330 3 70.184
20 Ag 330 4 77.174
21 Ag 380 1 71.293
22 Ag 380 2 63.203
23 Ag 380 3 62.653
24 Ag 380 4 69.643
25 Ag 430 1 63.762
26 Ag 430 2 55.672
27 Ag 430 3 55.122
28 Ag 430 4 62.112
29 Ag 480 1 56.232
30 Ag 480 2 48.142
31 Ag 480 3 47.592
32 Ag 480 4 54.582
33 Cu 330 1 187.096
34 Cu 330 2 179.006
35 Cu 330 3 178.456
[Akbar* et al., 5(7): July, 2018]
ISSN: 2349-5197
Impact Factor: 3.765
I
NTERNATIONAL
J
OURNAL OF
R
ESEARCH
S
CIENCE &
M
ANAGEMENT
37 Cu 380 1 187.528
38 Cu 380 2 179.438
39 Cu 380 3 178.888
40 Cu 380 4 185.878
41 Cu 430 1 187.961
42 Cu 430 2 179.871
43 Cu 430 3 179.321
44 Cu 430 4 186.311
45 Cu 480 1 188.393
46 Cu 480 2 180.303
47 Cu 480 3 179.753
48 Cu 480 4 186.743
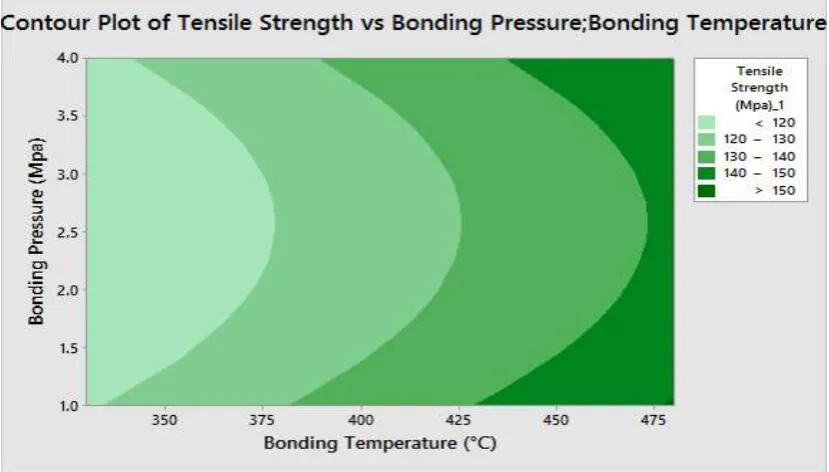
3.5 Effect of Temperature and Pressure on Joining Strength without Interlayer
The combination effect of temperature and pressure on joining strength without using interlayer is represented in figure (7) that was indicated to 2D counter plot.The maximum bonding strength is 150.757 Mpa at high temperature and pressure of 1Mpa. The optimum bonding condition was obtained to be less than 120 Mpa. The combination effect of temperature and pressure in a contour relation has been obtained to be maximum
temperature of 480 ◦C and pressure of 1 Mpa which led to complete coalescence between two mating surface
and high diffusion rate. The large area of contour plot may be distinguished between temperature range
(330-375) °C and pressure from low value to high value. The plot shows that the bonding temperature and pressure
have an interaction effect when bonding occurred without applying interlayer material.
Figure (7) Contour plot of tensile strength vs pressure and temperature without interlayer
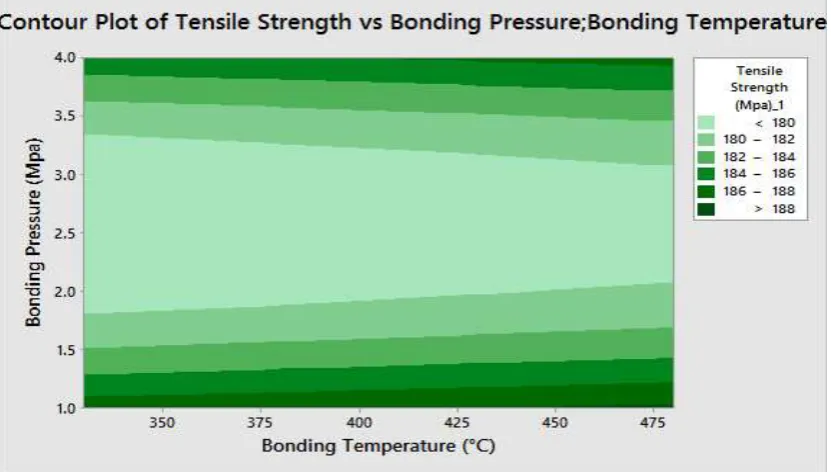
3.6 Effect of Temperature and Pressure on Joining Strength for Copper Powder Interlayer
[Akbar* et al., 5(7): July, 2018]
ISSN: 2349-5197
Impact Factor: 3.765
I
NTERNATIONAL
J
OURNAL OF
R
ESEARCH
S
CIENCE &
M
ANAGEMENT
range of 330 to 480 ◦C and pressure from 1.8 Mpa to 3.4 Mpa. In figure (8) the interaction effect is seen for temperature and pressure when Copper powder is applied as interlayer.
Figure (8) Contour plot of tensile strength vs pressure and temperature with copper interlayer
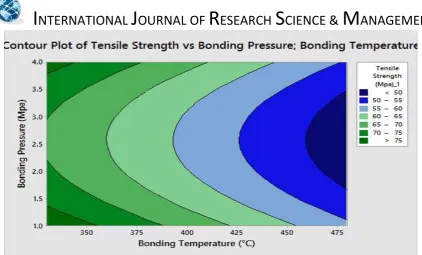
3.7 Effect of Temperature and Pressure on Joining Strength for Silver Interlayer
Figure (9) represents a 2D counter plot of the combination effect of temperature and pressure on bonding strength at using silver interlayer. The maximum bonding strength is 78.824 Mpa which is shown at maximum pressure and low temperature. The optimum bonding conditions effect was assessed at the range (60-65) Mpa. The combinations effect of temperature and pressure shown in the contour plot appeared at low temperature of
330 °C and pressure of 1 Mpa due to complete coalescence between two mating surface and high diffusion rate.
The large area of contour plot may be distinguished within temperature range 360-452 ◦C and pressure range of
[Akbar* et al., 5(7): July, 2018]
ISSN: 2349-5197
Impact Factor: 3.765
I
NTERNATIONAL
J
OURNAL OF
R
ESEARCH
S
CIENCE &
M
ANAGEMENT
Figure (9) Contour plot of tensile strength vs pressure and temperature with silver interlayer
3.8 General Effect of Temperature and Pressure on Joining Strength at all Interlayer
The combination effect of temperature and pressure on bonding strength at all interlayers is given in figure (10) that is indicated by a 2D counter plot. The maximum bonding strength is 188.393 Mpa observed with
temperature of 480 °C and 1Mpa pressure for copper powder interlayer. The optimum bonding condition can be
seen at range (100-125) Mpa as shown in figure. The large area of contour plot may be distinguished between
temperature range (330-480) °C and pressure from 1.45 Mpa 3.75 Mpa.
Figure (10) Contour plot of tensile strength vs pressure and temperature of all interlayer
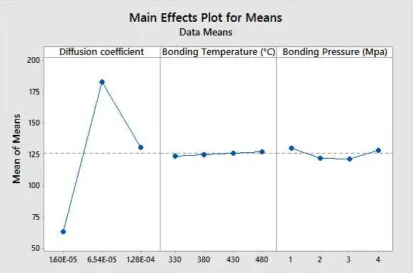
3.9 Factors Effect Analysis on Bond Strength
The main effect of factors on joining strength is shown in figure (11). The diffusion coefficient will play the main role in the diffusion bonding process, the copper interlayer showed the best tensile strength because the
[Akbar* et al., 5(7): July, 2018]
ISSN: 2349-5197
Impact Factor: 3.765
I
NTERNATIONAL
J
OURNAL OF
R
ESEARCH
S
CIENCE &
M
ANAGEMENT
temperature range bellow the annealing temperature will increase the tensile strength of the welded joint to be better than the similar joint welding. Increasing the temperature above 480 °C caused rapid grain growth which lead to a decrease in bonding strength [9]. Pressure is not highly effective compared with other factors, the increase in pressure more than increase temperature leads to plastic deformation and is not to obtain sound joint [10].
Figure (11) Main effect factors on tensile strength.
Conclusion
1. Similar bonding joint of aluminum alloy 2024-O has been used with powder interlayer of copper, silver, titanium and without interlayer. The copper interlayer was better than other.
2. The optimum bonding conditions of diffusion bonding process are as temperature of 430°C, pressure of
4 Mpa and bonding duration 60 min.
3. Optimum bonding condition resulted in tensile strength of 189.20 Mpa and bonding efficiency of 91.8
% compared to the aluminum alloy 2024-O (base metal).
4. The final statistical model obtained from tensile testing response gave a data predicting factor for tensile strength and with accuracy 99.13%
Tensile strength = 95.5 + 3509159 X1 - 0.2022 X2 - 19.4 X3 - 29254882011 (X1)2 + 3.77 (X3)2 + 3224 (X1)×(X2)
5. Multilevel factorial design in Minitab program is used to get all experiments that are possible to obtained and the results of tensile strength obtain from the final model equation.
6. The copper interlayer showed the best tensile strength because the increase in the forming of Al2Cu phase which gives the enhancement of mechanical properties.
Acknowledgements
[Akbar* et al., 5(7): July, 2018]
ISSN: 2349-5197
Impact Factor: 3.765
I
NTERNATIONAL
J
OURNAL OF
R
ESEARCH
S
CIENCE &
M
ANAGEMENT
References
[1] J. C., Lippod Koteki D. J, “Welding metallurgy and weldability of stainless steel”. New Jersey: Wiley
(2005).
[2] R. F. TYLECOTE, "The Solid phase Welding Of Metals", 1st edition, Edward Arnold Ltd, London, 1968.
[3] G. Mahendran, Balasubramania V., “Influences of diffusion bonding process on bond characteristics of
Mg-Cu dissimilar joints”, Trans. Nonferrous Metall., (2010).
[4] B. Ravisankar, Ramakishnan S.S., Angelo P. C., On diffusion bonding of Ti-6Al-4V, Transactions of
Indian Institute of Metals, (2002).
[5] R.L.Agarwal, welding Engineering, Fifth edition, Khama publishers, (2011).
[6] Metals Handbook, "Welding Brazing and Soldering", American Society for Metals, Vol. No. 6, 1993. [7] Periodicals of engineering and natural science, vol. 3 No.2 ,2015.
[8] Yingjun gao, Qifeng mo, zhirong luo, lina zhang, Atomic Bonding and Properties of Al-Cu Alloy with
(Al2Cu), J. electronic materials, Vol. 35, No. 10, (2006).
[9] M. Balasubramanian, Application of Box-Behbken design of fabrication of titanium alloy and 304 stainless steel joints with silver interlayer, Materials and Design, (2015).