R E S E A R C H
Open Access
v-TerraFly: large scale distributed spatial data
visualization with autonomic resource
management
Yun Lu
*, Ming Zhao, Lixi Wang and Naphtali Rishe
* Correspondence:[email protected] School of Computing and Information Sciences, Florida International University, Miami, FL 33199, USA
Abstract
GIS application hosts are becoming more and more complicated. Theses hosts’ management is becoming more time consuming and less reliabale decreases with the increase in complexity of GIS applications. The resource management of GIS applications is becoming increasingly important in order to deliver to the user the desired Quality of Service. Map systems often serve dynamic web workloads and involve multiple CPU- and I/O-intensive tiers, which makes it challenging to meet the response time targets of map requests while using the resources efficiently. This paper proposes a virtualized web map service system, v-TerraFly, and its autonomic resource management in order to address this challenge. Virtualization facilitates the deployment of web map services and improves their resource utilization through encapsulation and consolidation. Autonomic resource management allows resources to be automatically provisioned to a map service and its internal tiers on demand. Specifically, this paper proposes new techniques to predict the demand of map workloads online and optimize resource allocations considering both response time and data freshness as the QoS target. The proposed v-TerraFly system is prototyped on TerraFly, a production web map service, and evaluated using real TerraFly workloads. The results show that v-TerraFly can accurately predict the workload demands: 18.91% more accurate; and efficiently allocate resources to meet the QoS target: improves the QoS by 26.19% and saves resource usages by 20.83% compared to traditional peak-load-based resource allocation.
Introduction
With the exponential growth of the World Wide Web, there are more domains open to Geographic Information System (GIS) applications. Internet can provide informa-tion to a multitude of users, making GIS available to a wider range of public users than ever before. Web-based map services are the most important application of modern GIS systems. For example, Google Maps has more than 350 million users. There is also a rapidly growing number of geo-enabled applications which consume web map ser-vices on traditional computing platforms as well as the emerging mobile deser-vices.
Virtual machines (VM) are powerful platforms for hosting web map service systems. VMs support flexible resource allocation to both meet web map services system demands and share resources with other applications. Virtualization is also enabling technology for the emerging cloud computing paradigm, which further allows highly
scalable and cost-effective web map services hosting leveraging its elastic resource availability and pay-as-you-go economic model [1].
However, due to the highly complex and dynamic nature of web map service systems, it is challenging to efficiently host them using virtualized resources. First, typical web map services have to serve dynamically changing workloads, which makes it difficult to host map services on shared resources without compromising performance or wasting resources. Second, a web map service often consists of several tiers which have different intensive resource needs and result in dynamic internal resource contention. Third, for a typical web map service, both response time for requests and the freshness of the returned data are critical factors of the Quality of Service (QoS) required by users.
To address the above challenges, this paper presents v-TerraFly, an autonomic re-source management approach for virtualized map service systems, which can automat-ically optimize the QoS (considering both response time and data freshness) while
minimizing the resource cost [2-4]. First, v-TerraFly can accurately predict the
work-load demands of a web map service online based on a novel two-way forecasting
algo-rithm that considers both historical hourly patterns and daily patterns. Second, based
on the predicted workload, v-TerraFly can automatically estimate the resource demands of its various tiers based on performance profiles created using machine learning
tech-niques.Third, v-TerraFly employs a new QoS model that captures the balance between
response time and data freshness and uses this model to automatically optimize the re-source allocation of a web map service system [5].
This proposed v-TerraFly system is realized on Hyper-V virtual machine envi-ronments and evaluated by experiments using real workloads collected from the pro-duction TerraFly system. The results show that the proposed two-level workload prediction method is outperforms traditional exponential smoothing prediction by 18.91%, and the system improves the QoS by 26.19% compared to traditional statically node allocation. In the meantime, it saves resource usages by 20.83% compared to trad-itional peak-load-based resource allocation.
In summary, this paper’s main contributions are: (1) created a VM-based map service
system, v-TerraFly, which virtualizes all tiers of a typical web map service and supports dynamic resource allocations to the different tiers; (2) proposed a novel autonomic re-source management approach for virtualized map services, which automatically allo-cates resources to different tiers of the service and optimizes the allocations based on the performance and data freshness tradeoff; (3) evaluated v-TerraFly using real work-loads collected from production web map service system, which shows substantial im-provement on QoS and resource efficiency.
The rest of this paper is organized as follows: Section Background presents the background and motivations; Sections v-TerraFly describes the architecture of v-TerraFly; Section Auto-nomic Resource Management in v-TerraFly explains the autoAuto-nomic resource management of v-TerraFly; Section Evaluation presents an experimental evaluation; Section Related work examines related work; and Section Conclusions and future work concludes the paper.
Background
Web map services
over the Internet [6]. A typical web map service, such as Google maps, Bing maps, and
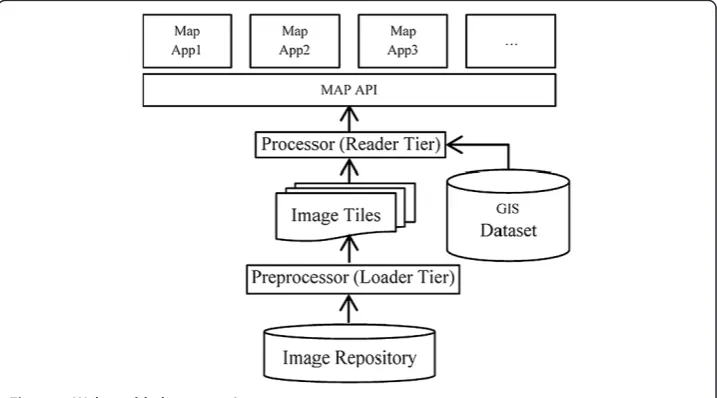
Yahoo maps [7], are usually built upon several major tiers (Figure 1). A Preprocessor
preloads images and geographic features from raw data repository and splits them into grid format, known as image tiles, to facilitate the Processorquickly locating and fetch-ing data. Then a tile Processor retrieves and integrates all tiles needed in a customer’s query. As its upper tier, a generic map interface accesses this imagery by geo-location, and a client app (or browser) to show the map to end-users.
In this paper, we use TerraFly as a case study of a web map system [1]. TerraFly serves worldwide web map requests, providing users with customized aerial photog-raphy, satellite imagery and various overlays, such as street names, roads, restaurants, services and demographic data. Following the typical architecture described above,
TerraFly contains two major tiers (Figure 1): the Image Loader Tierpreprocesses the
raw imagery data from repository; the Image Reader Tierprocesses image tiles and
re-trieves queried images [8]. These tiers are further described in Section v-TerraFly. Traditionally, web map services are hosted on dedicated physical servers with suffi-cient hardware resources to satisfy their expected peak workloads in order to provide responsive web services to the users. However, this becomes inefficient for real-world situations where the workloads are intrinsically dynamic in terms of their busty arrival patterns and ever changing unit processing costs [9]. Consequently, peak-load-based re-source provision often leads to underutilization of rere-sources for normal state workloads and causes substantial overhead.
Using VMs to host multi-tier web map services can effectively address this limitation because virtualized resources, including CPU, memory, and I/O, are decoupled from their physical infrastructures and can be flexibly allocated to different tiers of the web map system [10]. This approach allows the resource capacity of each tier to elastically grow and shrink to serve its dynamic. In this way, different tiers transparently share the consolidated resources with each other and/or other applications with strong isolation. Such benefits are important to the efficiency of web map service hosting in both typical data centers and emerging cloud systems. On one hand, users need to pay for only the resources their services actually consume. On the other hand, resource providers only
need to allocate resources as required by the services while saving valuable resources for hosting other applications [11].
Virtualization also offers a new paradigm for web map service deployments. Modern web map services are sophisticated systems, where their installation and configuration require substantial domain knowledge and experience as well as considerable efforts from the administrators. VM-based web map service hosting allows carefully installed software to be distributed as simply as copying the data that represents the VMs. In addition, this approach allows web map services to be quickly replicated and distrib-uted for performance and reliability improvements.
Research design and methodology
v-TerraFly Architecture
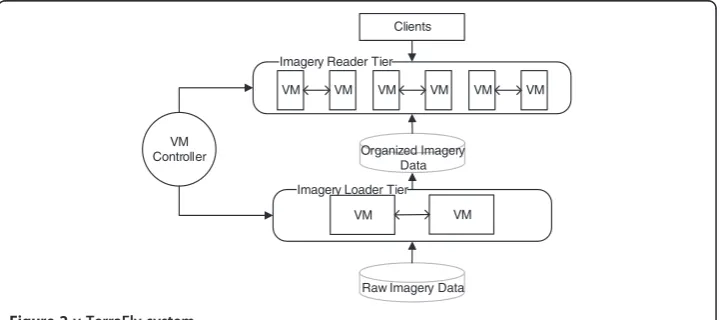
To enable the autonomic resource management in TerraFly, we leverage VM tech-niques to virtualize this multi-tier system, denoted as v-TerraFly. The two critical
re-source intensive tiers of TerraFly, the image Loaderand Reader Tiers, are deployed on
the VMs instead of physical servers.
Figure 2 shows the architecture of this v-TerraFly. The users interact with the appli-cation tier which handles most of the business logic and provides advanced appliappli-cation services, such as universal mapping and application specific mapping (e.g. real estate, water management), by sending the mapping queries including position and resolution
requirements to the tiers below. Then the image Reader Tier is invoked to compute
and locate associated map tiles from indexed imagery database according to the re-quests from the application. To maintain data freshness, the organized imagery
data-base is updated by the Loader Tier periodically at the same time.Loader contiguously
extracts the incoming raw map data from the raw imagery repository, preprocesses and organizes the raw data to destination projection, and then converts the data into the destination file type, and finally updates the data into the organized imagery database.
Due to the structure of the mapping service system, these two tiers of v-TerraFly exhibit distinct resource usage behaviors in the production environment. On one
hand, the Reader Tiermay experience different number of concurrent users during
different periods of a day, which results in highly dynamic workloads with varying
intensity against the Loader. On the other hand, the Loader does not have as
Imagery Loader Tier Imagery Reader Tier
Raw Imagery Data Organized Imagery
Data
VM VM
VM VM VM VM VM VM
Clients
VM Controller
stringent performance requirement as the Roader does but still needs reserved re-source to guarantee data freshness. Therefore, it is beneficial to host these two tiers together on virtualized cluster nodes to multiplex the common computing resources so that the total resource capacity can be better utilized among different tiers. For
example, more VMs are allocated to the Reader Tierduring daytime when peak-load
of user requests is expected to happen but the loading process is less active; but
shifting more VMs to the Loader over night to allow data updates accumulated in
daytime.
Virtualization in TerraFly also improves the flexibility in terms of the system
reliabil-ity and scalabilreliabil-ity. VM is the computing resource in both Loader and Reader Tiers.
With the load balance in both tiers, the work load of each VM is the same; therefore, the VMs in the same tier are considered identical. Since the computing resources can be partitioned through VM nodes, the network bandwidth, which is always a bottleneck in the original system, can now be well balanced among VMs. Furthermore, by pairing
every two VMs as complementaryReadernodes, it is able to provide more reliable
ser-vice under unexpected system failure by simply replacing the failed VM with its corre-sponding back-upped VM [12,13].
Motivating examples
In this section, we demonstrate both the necessity and benefits of resource consolida-tion in a map service system.
For web map services, the performance ofReader Tierand Loader Tierare both
im-portant. Better Reader Tier performance provides shorter page response time; better
Loader Tier performance provides faster loading of new map data. But both tiers are resource-intensive and they will compete with each other on resource allocation. The goal is to balance the two tiers to achieve best quality of service when we have limited resources.
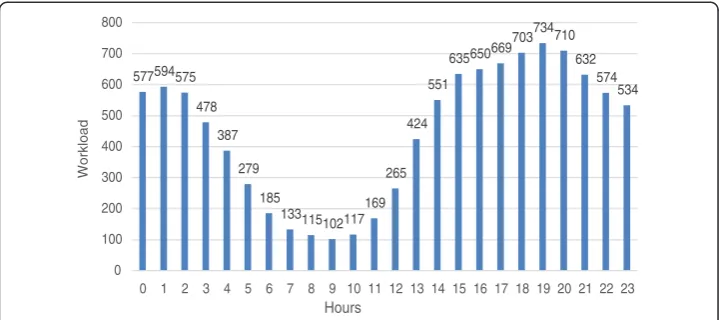
The workloads of web map service can be highly dynamic over time. Based on the analysis on the web service logs of TerraFly, it is observed that there were millions of
web requests received on the Reader server over the year of 2012, i.e., more than 450
visits per second on average. However, this workload varies significantly on hourly basis. Figure 3 shows a typical one-day TerraFly workload trace. It shows that the re-quest rate drops to 150 (visits per second) in the morning (around 9:00 am) while rising quickly up to 900 (visits per second) in the afternoon. It would be more efficient to
turn off someReaderVMs at times.
Assuming the variation in workload which follows such a time-related pattern is
pre-dictable, by virtualizing theReader Tier of TerraFly we can easily save resources when
the workload intensity is low by simply turning off some ReaderVMs, and as the
work-load intensity increases, we can bring back them online to process the additional requests. To further quantify the resource savings, we replay this one-day trace using two de-ployment schemes for theReader Tier: the static scheme deploys the Reader tier on the fixed number of computing nodes throughout the entire experiment (2, 4, 6, 8 and 10 nodes respectively); the dynamic schema only assigns sufficient nodes needed by the workload in every hour. The response time is used as the performance metric and the desired QoS target is set to (0.7 s). Figure 4 compares the average response time in
computing resource. By measuring the numberNiof active nodes used in theith hour,
the total amount of the resource during certain time periodT(hours) can be computed
asX
T
i Ni.
Figure 4 compared the measured response times in every hour using different deploy-ments as well as the total resource costs needed in one day. As we can see among the static deployment configurations, only the 10-node configuration can always meet the desired target, however at the cost of the highest total resource amount (240 node-hour); others suffer different levels of QoS violation as the workload changes dynamically.
In contrast, the dynamic deployment scheme is able to track the QoS target all the time with only 148node-hour,saving about 23% of the resources compared to the static 8-node configuration which cannot satisfy the QoS target, and saving 38% of the resources com-pared to the static 10-node configuration which can satisfy the QoS target. Its resource utilization is as efficient as the 6-node configuration but delivers much better performance.
577 594 575 478
387 279
185
133 115 102 117 169 265
424 551
635 650 669 703 734 710
632 574
534
0 100 200 300 400 500 600 700 800
0 1 2 3 4 5 6 7 8 9 10 11 12 13 14 15 16 17 18 19 20 21 22 23
Workload
Hours
Figure 3TerraFly system workload hourly distribution.
0 0.5 1 1.5 2 2.5 3 3.5 4
0 5 10 15 20
Page Response Time (Secondes)
Hours
2 nodes (48 node-hour)
4 nodes (96 node-hour)
6 nodes (144 node-hour)
8 nodes (192 node-hour)
10 nodes (240 node-hour)
Target
optimal (148 node-hour)
The above example shows strong evidence of the importance of map service virtualization and its online resource management. Currently, our traditional TerraFly
system is deployed on the 8 physical Reader Tier nodes and 2 Loader Tier nodes. It
works well for supporting up to 800 concurrent users, and about 6GB fresh data can be
load each hour by the 2 Loader nodes (Refer to 4.3 Resource Model); but the system
scalability is limited due to its fixed physical capacity. It cannot shift resources between Reader andLoader Tiers even when one tier has idle resource and another has insuffi-cient resources. The inability of shifting resources between tiers results the waste of resources.
However, there are several challenges to dynamic resource management of a virtua-lized web map service. First, the dynamics in the realistic workload causes the demand of CPU consumption change over time; second, resources also need to be dynamically
allocated between the Reader Tier to optimize response time and the Loader Tier to
keep the data fresh.
These challenges can be well addressed by an autonomic VM-based resource man-agement solution which can flexibly partition shared resources and allocate resource on-demand for dynamic workload in order to guarantee performance and improve re-source utilization.
Autonomic resource management in v-TerraFly
General approach
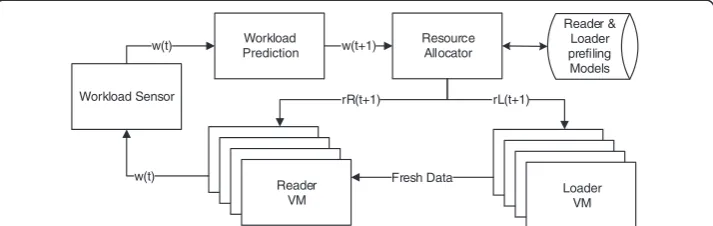
Figure 5 illustrates the framework of our proposed autonomic resource management system for v-TerraFly, which consists of three key modules. Please see the notes in Table 1 Parameter description. In this paper, we focus on the resource management for both Reader and Loader Tiers, since they are the most resource intensive tiers in v-TerraFly.
As a workload executes on the VMs, theWorkload Sensormonitors the actual
work-load at current time step, noted as w(t). TheWorkload Predictorthen forecasts the
fu-ture workload w(t+ 1) for the next time step based on a prediction model. Based on
the predicted workload, theReader profile andLoader profile which are trained offline
are used to estimate their resource demands for time t+ 1, denoted by rR(t+ 1) and
rL(t+ 1) respectively. The estimated resource demands are then used by the Resource
Allocator to make the actual allocations by assigning appropriate number of VMs to the Reader Tier and Loader Tier. Together, these modules form a closed-loop which runs continuously (e.g., every hour), for v-TerraFly’s resource control and optimization.
Workload Prediction
Resource Allocator
Reader & Loader prefiling Models w(t+1)
Reader
VM LoaderVM
Fresh Data
rR(t+1) rL(t+1) Workload Sensor
w(t) w(t)
In the rest of this section, we describe the key components of this autonomic system in details.
Workload prediction
In order to accurately and timely predict the workload on v-TerraFly, we propose new forecasting techniques to discover and exploit patterns in user visiting behaviors such as those observed in Figure 3. Specifically, we propose a new two-level time series pre-diction approach to build a prepre-diction model based on the historical workload
mea-surements, i.e., the request rate observed from theReader Tierof v-TerraFly. Based on
such a model, the workload predictor in v-TerraFly is able to estimate the workload in-tensity for the next time period.
Time series analysis techniques are widely applied in economic data analysis to pro-vide statistical prediction and therefore guide business decisions. A variety of time series prediction methods are available such as the Moving Averages,Linear Regression and Exponential Smoothing [14-16]. In this paper, the TerraFly workload prediction based on the double exponential smoothing (DES) method [17] which is suitable for discrete data sequence with repeated changing patterns.
DES is a smoothing-based forecasting method that can be applied to time series data, a sequence of observations with equally spaced intervals, expressed as {Y(0), Y(1),.., Y(t)}. Then in DES, the estimate for thet+ 1 time intervals can be computed as:
YDesðtþ1Þ ¼2S′ð Þt −S″ð Þ þt α
1−α
S′ð Þt −S″ð Þt
S′ð Þ ¼t αY tð Þ þð1−αÞS′ðt−1Þ
S″ð Þ ¼t αS′ð Þ þt ð1−αÞS″ðt−1Þ
The equation shows a linear combination of smoothing based statistics associated
with a smoothing weight α. The first two components reflect the variation of mean of
the overall data while the third tracks the trend of the data. S’is denoted as the singly-smoothed series which singly-smoothed the next measure by assigning a exponentially de-creased smoothing weight to the data of the series and computing the weighted average of the observed series. More intuitively, the most recent data is of more importance to the current estimates, i.e., the weight assigned to the data k periods old is (1−α)k, therefore the closer to 1 of the value of α, less smoothing effect but greater weight to
the recent changes. S″ is denoted as the doubly-smoothed series computed by
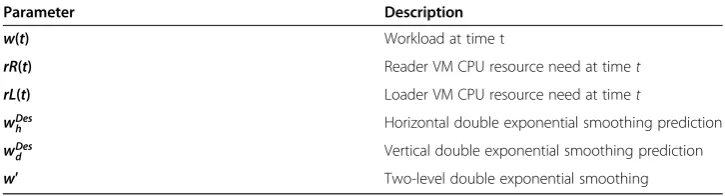
Table 1 Parameter description
Parameter Description
w(t) Workload at time t
rR(t) Reader VM CPU resource need at timet
rL(t) Loader VM CPU resource need at timet
wDes
h Horizontal double exponential smoothing prediction
wDes
d Vertical double exponential smoothing prediction
recursively applying the same exponential smoothing operation to the singly-smoothed seriesS’using the same smoothing weight.
In order to perform the time-series-based forecast in v-TerraFly, the workload can be represented as a sequence of intensity measurements that come from a continuing time series at time intervalsT, denoted as {… w(t-2T), w(t-T), w(t)}. More specifically, the workload measurement can be either the average request rate or the number of concur-rent client sessions observed in every hour; the time intervalTcan be either one hour or one day (24 hour).
We propose a new two-level double exponential smoothing forecasting model to cap-ture both the daily pattern and hourly pattern of v-TerraFly workload as follows.
w′ðtþ1Þ ¼μhwDesh ðtþ1Þ þμdwDesd ðtþ1Þ ð1Þ
where wDes
h is the horizontal double exponential smoothing prediction based on the
hourly pattern in the workload, and wDes
d is the verticaldouble exponential smoothing
prediction based on the daily pattern of the workload.
wDesh ð Þ ¼t 2S′ðt−1Þ−S″ðt−1Þ þ αh
1−αh
S′ðt−1Þ−S″ðt−1Þ
ð2Þ
wDesd ð Þ ¼t 2S′ðt−24Þ−S″ðt−24Þ þ αd
1−αd
S′ðt−24Þ−S″ðt−24Þ
ð3Þ
More specifically, wDes
h ð Þt , called horizontal prediction, is predicted based on {w(t−3), w(t−2),w(t−1)} from a hourly series; while wDes
d ð Þt , vertical prediction, is based on the observation series { w(t−48),w(t−24),w(t)} that are extracted vertically at the same
hours but from continuing days, i.e., a 24-hour vertical time span. The associated μ
factors which are set between 0 to 1 are used to balance the importance between three components.
Since each level of DES operation is associated with a smoothing weights, we denote the weights in horizontal and vertical predictions as αhand αd respectively. Then the
proposed two-level DES model can be considered as a function of αhand αd, given
ob-served workload series. Therefore the workload model is trained continuously online as
soon as the new measurement is observed by optimizing both αhand αdto minimize
the weighted sum of squared errors between the prediction and the actual observa-tion. Once the model is updated, it applies to the system immediately for the next prediction.
Performance profiling
Performance profiles relate the workload of the Reader and Loader Tiers to their
re-source demands according to the desired performance. Taking the predicted work-load w(t + 1) as the input, these profiles are used by the Resource Allocator to
allocate resources to the ReaderandLoader Tiers dynamically in order to achieve the
desired QoS.
For theReader Tier, since the workload consists of online web requests, the intensity of the workload is specified by request ratew(t) as discussed in Section Workload
requests completed during each control period (e.g., one hour). It can be considered as a function of the workload and the number of VM nodesrR(t) allocated toReader Tier. Thus,
RT tð Þ ¼∅ðw tð Þ;rR tð ÞÞ ð4Þ
The strategy to build this mapping is offline profiling. Given a specific workload w,
we map the number of nodesnallocated to theReader Tierto the performance RTby
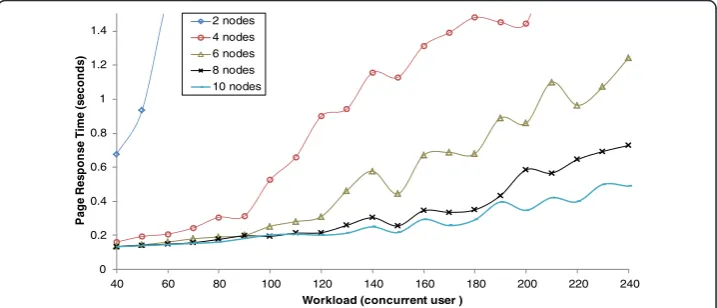
iterating over the allocation space and collecting corresponding performance measure-ments under each allocation candidate. Then we repeat the above step under different workloads by varying the number of the concurrent users in v-TerraFly. Figure 6
illustrates the mapping results by using two to ten Reader nodes to serve a
work-load with 40 to 240 concurrent users. Such a mapping provides the least number of VM nodes needed for a given workload to meet a specific QoS target. For ex-ample, if desired response time is set to 0.7 second, then the minimal number of VMs needed is two for a workload with about 40 users and 10 when there are more than 230 concurrent users.
In order to reduce the time required for performance profiling, we collected only a subset of the Readerconfigurations under a subset of the workload intensities, and use
linear regression to build the Reader Tier entire performance profile. As shown in
Figure 7, we got the profile mode and the R square is 0.9131.
We profiled both the CPU and I/O resource usages of the Reader Tier, as shown in
Figure 7. The results show that both the CPU and I/O demands follow the exact same pattern as the workload varies, which validates the use of identical VM nodes as the re-source allocation unit of theReader Tier.
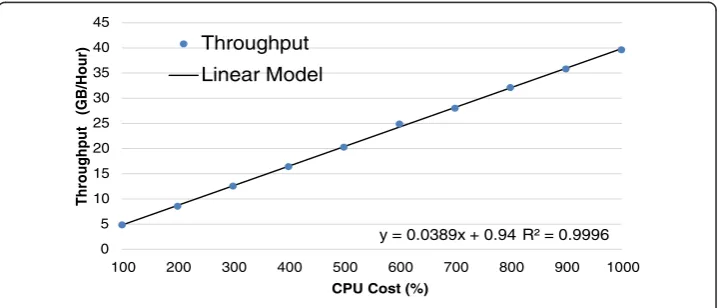
For the Loader Tier, since the workload mainly consists of batch jobs which loads
raw data into organized repository, the workload intensity is given by the concurrency level, i.e., the average throughput achieved every control period. Allocating more VMs to theLoader Tierallows it to obtain higher throughout and finish the loading process
sooner. We use offline profiling to create a model for Loader that represents the
rela-tionship between the throughput (I/O) and the number of VM nodes for the Loader
Tier. We use different amount of map Loader nodes to load a given imagery dataset
0 0.2 0.4 0.6 0.8 1 1.2 1.4
40 60 80 100 120 140 160 180 200 220 240
P
a
g
e
Res
p
o
n
s
e
Time (s
ec
o
n
d
s
)
Workload (concurrent user ) 2 nodes
4 nodes 6 nodes 8 nodes 10 nodes
and monitor the throughput. We then use linear regression to learn the entire model
based on the training data. As shown in Figure 8, the throughput of Loader Tieris
al-most linear with respect to the number of Loader VMs. Using linear regression, the R
square is only 0.9996.
QoS model
In this section, we propose a novel QoS model to consider both the responsiveness in serving user mapping requests and the quality of returning geographic information. In
a virtualized web mapping system, both Reader andLoader VMs are usually co-hosted
in a cluster/data center and compete for the common physical resources, while the former guarantees acceptable response time and the latter keeps the imagery data up to date. Since the performances from both tiers are critical, we need to well balance the importance between them especially when the total resource capacity is constrained. Therefore, a new QoS model is defined to represent the overall system performance at measuring time period t.
QoS tð Þ ¼r tð Þ f tð Þ ð5Þ
where r(t) and f(t) are the performance metrics for the Reader and Loader Tier
respectively.
y = 2.4631x + 154.06
0 2 4 6 8 10 12
0 100 200 300 400 500 600 700 800
20 60 100 140 180 220 260
I/O Cost (MB/S)
CPU Cost
(%)
Workload (concurrent user) CPU
I/O Linear (CPU) Linear (I/O)
R² = 0.9131
Figure 7Reader tier profiling (CPU Cost).
0 5 10 15 20 25 30 35 40 45
100 200 300 400 500 600 700 800 900 1000
T
h
roug
hput
(GB/H
o
ur)
CPU Cost (%) Throughput
Linear Model
R² = 0.9996 y = 0.0389x + 0.94
The former QoS componentr(t) is called the normalized response time, which mea-sures the quality of web mapping services at timetand can be calculated as following:
r tð Þ ¼RTref
.
RT tð Þ ð6Þ
where RTrefis the desired average response time atReader Tierand RT(t) is the actual
performance measurement at timet. The higher of the value, the quicker the user
re-quests served atReader Tier.
The latter QoS component f(t) is called the cumulative data freshness which
mea-sures the quality of data-loading process atLoader Tierat timet. It is calculated recur-sively based on the previous data freshness value and the current data incremental rate, expressed as following:
f tð Þ ¼ð1−ρÞ f tð−1Þ þΔD tð Þ=Dref ð7Þ
where ρ is the decaying factor (predefined in the range of 0 to 1) indicating the data
quality loss in terms of freshness during the past time period; Dref is the desired
amount of fresh data per time period,ΔD(t) is the actual amount of data loaded during
time period t. Initially phaset= 0,f(0) =ΔD(0)/Dref.
For instance, assuming we need to maintainDref= 300GB amount of fresh data in
re-pository every control period and the data freshness value at previous time period wasf (t−1) = 0.9 will be reduced to 0.864 at current time t given a decaying factor of 4.0%. If there is 15GB data loaded during current time period, then the incremental rate is 0.05 and therefore the freshness value f(t) = 0.864 + 0.05 = 0.914. Intuitively, we can say the current data quality is 91.4% fresh. Note that it is evident that the data freshness can be adjusted by controlling data incremental rate via resource management at Loader Tier.
By maximizing the QoS as computed above, the v-TerraFly resource management system automatically optimize the response time and data freshness simultaneously, which are both important to the map service received by users.
Results and discussion
Setup
This section evaluates the proposed virtual web map service system and its autonomic resource management using the v-TerraFly prototype and real traces collected from the TerraFly production system. As a typical web application, TerraFly usually provides a variety of web services via IIS (Internet Information Services) to serve online web re-quests. The test bed is set up on two Dell PowerEdge 2970 servers, each with two six-core 2.4GHz AMD Opteron CPUs, 32GB of RAM, and one 1 TB 7.2 RPM SAS disk. Windows Server 2008 and Hyper-V are installed to provide the virtualization environ-ment for v-TerraFly. The resource manageenviron-ment system for v-TerraFly is hosted on the
hypervisor’s management VM. All guest VMs including bothReaderandLoader Tierof
Workload prediction
We first evaluate the accuracy of our proposed two-level DES workload prediction al-gorithm by comparing it to two one-level DES approaches based on hourly pattern only (Horizontal) and daily pattern only (Vertical) respectively, as well as history average
statistics (History Average). The evaluation is performed using a real one-month
workload trace of the November 2012 extracted from the production TerraFly
sys-tem’s logs. To conduct the experiment more efficiently, the real trace is replayed
with a 60-fold speedup, i.e., using one minute in the experiment to simulate one
hour in real world. The prediction and updates of the workload models (smoothing
weights αh and αd, refer to Eqs. 2 and 3) are performed every minute to adapt to
the dynamics.
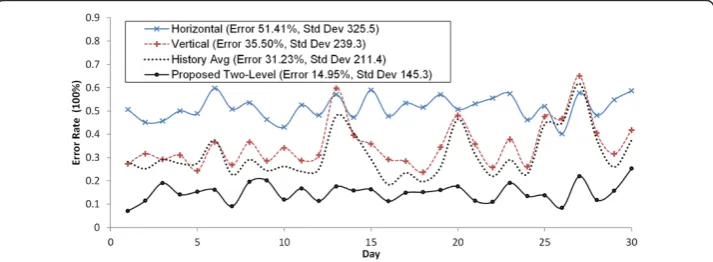
Figure 9 compares the online prediction errors of different approaches. Our proposed two-level prediction method delivers significantly better accuracy in predicting the re-quest rate of one month workload. Overall, the 90 percentile average error rate of our two-level method is 10.01% with the lowest standard deviation of 145.3, both much
lower than the other three prediction approaches which are 45.67% (Horizontal),
28.92% (Vertical), and 25.14% (History Average) respectively. These results demonstrate that our proposed method can effectively exploit both the hourly pattern and daily pat-tern in the workload and achieve accurate workload prediction.
Resource management ofReader Tier
As discussed in Section Performance profiling, based on the predicted workload, the
v-TerraFly resource management system automatically allocates resources to the Reader
andLoader Tiers in order to optimize the QoS. This section evaluates the resource
man-agement for the Reader Tieralone and demonstrates whether it can achieve the Reader
Tier’s response time target with the least amount of resources.
In the experiment, a real daily workload trace of October 4th 2012 is replayed against v-TerraFly with a 60-fold speedup. The resource allocator adjusts resources allocation every 1 minute. The QoS target is set to 0.7 s in response time. Based on the profiling,
the performance model of Reader Tier is R(t) = 2.4631W(t) + 154.06, (as shown in
Figure 7).
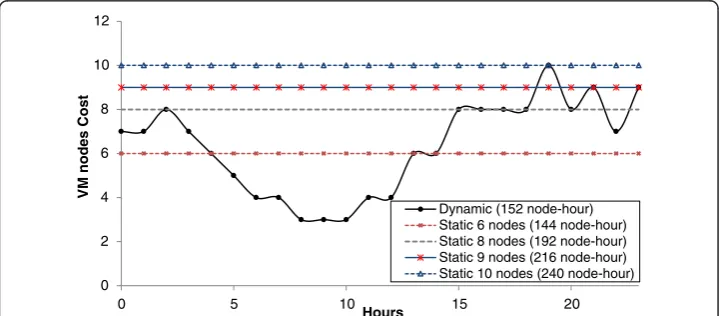
Figures 10 and 11 compare the response time and allocations of our dynamic ap-proach to static 6, 8, 9 and 10-node deployment plans respectively. From the results,
we can see that the online dynamic approach is able to achieve the response time target all the time throughout the entire experiment. Compared to the 6-node static plan which achieves 0.634 second in average page response time, the online dynamic plan improves the performance by 32.18%, i.e., 0.430 second in average response time, but at the cost of only 5.6% more resource allocation, i.e., 8 additional node-hour. There are 13 data points where its response time exceeds 0.7 second in the 6-node static plan, which causes as much as 54.17% QoS violation; in contrast, no QoS violation occurs in the dynamic plan.
Compared to the 8-node static plan, the dynamic plan saves as much as 20.83% of total resources, i.e., 40 node-hour. Although the static 8-node plan allocates substan-tially more with surplus resources, it still causes three QoS violations during the
experi-ment. The 9-node static plan meets the QoS target all the time except the 19thhour,
and it costs 29.63% more total resources than the dynamic plan. The 10-node static plan is the only static plan that meets the QoS target all the time, but it costs 36.67% more total resources than the dynamic plan.
Overall, it is evident that the online dynamic deployment plan can efficiently allocate
resources to the Reader Tier while at the same time meet the response time target by
flexibly adjusting its VM assignments in an online manner.
0 0.1 0.2 0.3 0.4 0.5 0.6 0.7 0.8 0.9 1 1.1 1.2 1.3
0 5 10 15 20
Hours Dynamic
6 nodes 8 nodes 9 nodes 10 nodes Target
Figure 10Result: response time.
0 2 4 6 8 10 12
0 5 10 15 20
VM nodes
Cos
t
Hours
Dynamic (152 node-hour) Static 6 nodes (144 node-hour) Static 8 nodes (192 node-hour) Static 9 nodes (216 node-hour) Static 10 nodes (240 node-hour)
Resource management of bothReaderandLoader Tiers
This section evaluates the proposed autonomic resource management approach for bothReaderand Loader Tiers. Based on the QoS model defined in Section QoS model, the importance of both tiers needs to be balanced in order to optimize an overall QoS value which not only guarantees the responsiveness of map service but also maintains the data freshness of returned maps.
In the experiment, we use the same workload trace described in Section Resource
management of Reader Tier, and compare our proposed approach to the traditional
static deployment plan. The traditional method allocates a fixed number of nodes to Reader Tierto satisfy average response time by past experience and gives rest nodes to Loader Tier. Specifically, it assigns 7 nodes to theRead Tierand 3 nodes to theLoader
Tierin order to achieve an average response time of 0.9 second and 303.3GB fresh data
per day (averagef(t)=0.809, refer to Eq. 7).
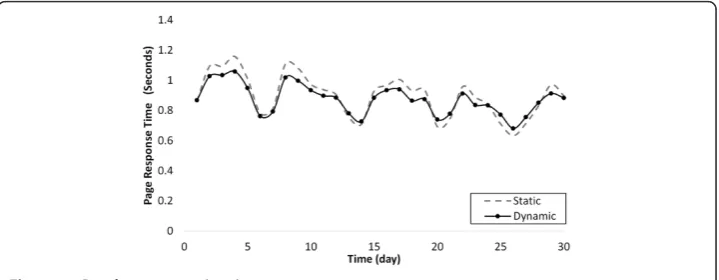
Figures 12 and 13 compare the performance of the proposed dynamic plan to the
traditional static plan in both response time of the Reader Tier and throughput of the
Loader Tier. The static plan achieves an average response time of 0.897 seconds, while the dynamic plan shows slightly better 0.873 seconds. The latter also achieves higher average throughput (194.6 thousands requests per day) than the static one (185.1 thousands requests per day).
Although the performance improvement on the Reader Tier is not significant,
Figure 14 shows that the proposed dynamic plan achieves much better overall QoS (26.19% improvement). The reason behind this substantial improvement is because the
dynamic plan saves resources from the Reader Tier and allocates them to theLoader
Tier, thereby making data loading faster without sacrificing Reader performance.
Re-sources are dynamically balanced between these two tiers as the workload changes, where the autonomic resource management allocates only the necessary number of
VM nodes to the Reader Tier to satisfy current workload, and reserve the rest to
Loader Tierto load new data.
For example, as showed in Figure 15, from Hour 7 to 10, since the workload on Reader Tieris less intense, the dynamic plan allocates more resource to theLoader Tier to allow the new data to be loaded as fast as possible. As a result, the dynamic plan loads much more new data (473.3GB Per day) at a varying loading rate than the trad-itional plan (303.3GB Per day), which loads data at a fixed rate. And the QoS value of
the dynamic plan (Avg QoS = 1.079,refer to Eq. 5) is26.20%higher the traditional plan (Avg QoS = 0.855,refer to Eq. 5).
In summary, our proposed autonomic resource management approach is able to automatically optimize the tradeoff between service responsiveness and data freshness by balancing the resource allocations between theReaderandLoader Tiers.
Related work
In the geospatial discipline, web-based map services can significantly reduce the data volume and required computing resources at the end-user side [18]. To the best of our knowledge, v-TerraFly is the first to study the virtualization of typical web map services and propose QoS-driven resource management for a virtualized web map service through workload forecasting and dynamic resource allocation [19].
Various automatic forecasting algorithms have been studied in the related work [20], including different kinds of exponential smoothing. The work of Brown [16] and Gardner [17] led to the use of exponential smoothing in automatic forecasting for ex-ample, like Stellwagen & Goodrich's research at 1999 [15-17]. Hyndman (2002) devel-oped a more general class of methods with a uniform approach to calculate the prediction interval [14,15]. The workload prediction algorithm proposed in this paper
140 150 160 170 180 190 200 210 220
0 5 10 15 20 25 30
Throughput (thousands)
Time (day)
Static
Dynamic
Figure 13Result: throughput improvement.
0 0.2 0.4 0.6 0.8 1 1.2 1.4 1.6
0 5 10 15 20 25 30
QoS Value
Time (day)
Static (Avg 0.855) Dynamic (Avg 1.079)
is based on exponential smoothing, but it is novel in the use of two levels of double ex-ponential smoothing to capture both hourly pattern and daily pattern in the workload, which achieves much higher accuracy than traditional exponential smoothing methods.
In particular, Dinda et al. studied prediction-based best-effort real-time service to support distributed, interactive applications in shared computing environments. Two of the examples are an earthquake visualization tool and a GIS map display tool, which were shown to benefit from the service [21]. However, the workload prediction is based on linear prediction which is often not sufficient for real-world dynamic workloads. In this paper, we proposed a two-level exponential smoothing algorithm which shows good prediction accuracy for real TerraFly workloads.
Various types of solutions have been studied in the literature to address the problem of autonomic VM resource management. Different machine learning algorithms have been considered to model VM resource usages [22-25]. Although this article focused on virtualized geo-databases, we believe that our proposed VM resource allocation ap-proach is generally applicable to the virtual resource management for other types of Big Data handling applications. The application-specific part of this approach is geo-database system applications with large numbers of users. Feedback control theory has also been used to adjust VM resource allocations, which are often based on models trained to identify the system and build the controller [26-29]. These various solutions
are complementary to this paper’s work which focuses on the management of
virtua-lized web map services. Meanwhile, this paper proposes a unique QoS model to capture multiple important objectives and a new method to optimize resource allocation across multiple competing tiers, which has not been studied in the related work and can be applied to manage other multi-tier applications with similar characteristics.
Conclusions and future work
Web map services become increasingly widely used for various commercial and per-sonal uses. Virtualization can greatly facilitate the deployment of web map service sys-tems and substantially improve their resource utilization. To fulfill this potential, the resource management of a virtualized web map system needs to be able to handle the
0 50 100 150 200 250 300 350
0 2 4 6 8 10 12 14 16 18 20 22
Node Alllocation
(Node-Hour
)
Time (Hour)
Static Reader Allocation (Total 5040 Node-Hour) Static Load Allocation (Total 2160 Node-Hour) Dynamic Read Allocation (Total 4544 Node-Hour) Dynamic Load Allocation (Total 2656 Node-Hour)
dynamic workloads that the system typically serves and satisfy the often competing de-mands of the various tiers of the system.
This paper presents a solution, v-TerraFly, to address these challenges. v-TerraFly is created by virtualizing the various tiers of a typical map service system and allowing re-sources to be dynamically allocated across the tiers. The resource management is done by predicting the workload intensity based on historical data and estimating the
re-source needs of the map service’sReader andLoader Tiers based on their performance
models. A unique QoS metric is then defined to capture the tradeoff between the ser-vice responsiveness and data freshness, and it is used to optimize the resource
alloca-tion to theReaderandLoaderVMs.
Experiments based on real TerraFly workload show that our system can accurately
predict the workload’s resource demands online and automatically allocate the
re-sources accordingly to meet the performance target and save substantial resource cost compared to peak-load-based resource allocation. It can also automatically optimize the tradeoff between responsiveness and data freshness by dynamically balancing the
shared resources between theReaderandLoaderVMs.
In our future work, we will improve the scale of v-TerraFly, conducting larger experi-ments and employing live VM migration as an additional mechanism for optimizing re-source management. We will also explore how to apply the principle of v-TerraFly to other applications that have similar dynamic and multi-tier characteristics as a web map service.
Competing interests
The authors declare that they have no competing interests.
Authors’contributions
YL carried out the TerraFly deployment pattern studies and v-TerraFly design, participated in the sequence experiment and drafted much of the manuscript. MZ participated the system design, advised and designed most of the experiment and analyzed the experiments results. LW participated in the VM node deployment and helped drafting the manuscript. NR developed the TerraFly technology and major algorithms, designed system layers design and partook in writing the manuscript. All authors read and approved the final manuscript.
Acknowledgement
This material is based in part upon work supported by the National Science Foundation under Grant Nos. MRI CNS-0821345, MRI CNS-1126619, CREST HRD-0833093, I/UCRC IIP-1338922, I/UCRC IIP-0829576, RAPID CNS-1057661, RAPID IIS-1052625, MRI CNS-0959985, AIR IIP-1237818, SBIR IIP-1330943, FRP IIP-1230661, III-Large IIS-1213026, SBIR IIP-1058428, SBIR IIP-1026265, SBIR IIP-1058606, SBIR IIP-1127251, SBIR IIP-1127412, SBIR IIP-1118610, SBIR IIP-1230265, SBIR IIP-1256641, HECURA CCF-0938045, CAREER CNS-1253944. Includes material licensed by TerraFly (http://terrafly.com) and the NSF CAKE Center (http://cake.fiu.edu).
Received: 5 November 2013 Accepted: 20 January 2014 Published: 24 June 2014
References
1. Wang L, Xu J, Zhao M, Tu Y, Fortes JA (2011) Fuzzy modeling based resource management for virtualized database systems. In: Modeling, Analysis & Simulation of Computer and Telecommunication Systems (MASCOTS), 2011 IEEE 19th International Symposium on IEEE, pp. 32-42.
2. Rishe N, Chen SC, Prabakar N, Weiss MA, Sun W, Selivonenko A, Davis-Chu D (2001) TERRAFLY: A High-Performance Web-based Digital Library System for Spatial Data Access. In: CDE Demo Sessions, pp 17–19
3. Martin P, Elnaffar S, Wasserman T (2006) Workload Models for Autonomic Database Management Systems. ICAS 4. Padala P, Hou K, Shin K, Zhu X, Uysal M, Wang Z, Singhal S, Merchant A (2009) Automated Control of Multiple
Virtualized Resources. SIGOPS/EuroSys
5. Kusic D, Kephart JO, Hanson JE, Kandasamy N, Jiang G (2009) Power and performance management of virtualized computing environments via lookahead control. Clust Comput 12(1):1–15. Special Issue on Autonomic Computing 6. Lu Y, Zhang M, Li T, Guang Y, Rishe N (2013) Online spatial data analysis and visualization system. In: Proceedings of
the ACM SIGKDD Workshop on Interactive Data Exploration and Analytics, pp 73-79. ACM
7. Craig B (2007) Online Satellite and Aerial Images: Issues and Analysis. North Dakota Law Review 85, pp 547 8. Lu Y, Zhang M, Li T, Liu C, Edrosa E, Rishe N (2013) TerraFly GeoCloud: online spatial data analysis system. In: Proceedings of
9. Lu Y, Zhang M, Witherspoon S, Yesha Y, Rishe N (2013) sksOpen: Efficient Indexing, Querying, and Visualization of Geo-spatial Big Data. In: Proceedings of the 12th International Conference on Machine Learning and Applications (ICMLA'13). IEEE, DOI 10.1109/ICMLA.2013.161 pp 485-490
10. Anderson TE, Peterson LL, Shenker S, Turner JS (2005) Overcoming the internet impasse through visualization. IEEE Comp 38(4):34–41
11. Bennani MN, Menasce DA (2005) Resource allocation for autonomic data centers using analytic performance models. In: Autonomic Computing, 2005. ICAC 2005. Proceedings. Second International Conference on IEEE, pp 229–240
12. Baran ME, Wu FF (1989) Network reconfiguration in distribution systems for loss reduction and load balancing. Power Delivery, IEEE Transactions 4(2):1401-1407
13. Wood T, Cherkasova L, Ozonat K, Shenoy P (2008) Profiling and Modeling Resource Usage of Virtualized Applications. Middleware
14. Hyndman R, Koehler AB, Ord JK, Snyder RD (2008) Forecasting with Exponential Smoothing: The State Space Approach. XIII, 362 p
15. Hyndman RJ, Koehler AB, Snyder RD, Grose S (2002) A state space framework for automatic forecasting using exponential smoothing methods. Int J Forecast 18:439–454
16. Brown RG, Meyer RF (1961) The Fundamental Theorem of Exponential Smoothing. Oper Res 9:673–685 17. Gardner ES, Jr (2006) Exponential smoothing: The state of the art—Part II. International Journal of Forecasting
22(4):637-666
18. Lu Y, Zhao M, Zhao G, Wang L, Rishe N (2013) Massive GIS Database System with Autonomic Resource Management. In Proceedings of the 12th International Conference on Machine Learning and Applications (ICMLA'13). IEEE, DOI 10.1109/ICMLA.2013.161 pp 451-456
19. Yue P, Di L, Yang W, Yu G, Zhao P (2007) Semantics-based automatic composition of geospatial Web service chains. Comput Geosci 33(5):649-665
20. Morato D, Aracil J, Diez LA, Izal M, Magana E (2001) On linear prediction of Internet traffic for packet and burst switching networks. In: Computer Communications and Networks, 2001. Proceedings. Tenth International Conference on IEEE, pp 138-143
21. Dinda PA, Lowekamp B, Kallivokas LF, O’hallaron DR (1999) The case for prediction-based best-effort real-time systems. Springer Berlin Heidelberg, pp 309-318
22. Wildstrom J, Stone P, Witchel E (2008) CARVE: A Cognitive Agent for Resource Value Estimation. ICAC 23. Rao J, Bu X, Xu C, Wang L, Yin G (2009) VCONF: A Reinforcement Learning Approach to Virtual Machines
Auto-configuration. ICAC
24. Wang L, Xu J, Zhao M, Tu Y, Fortes JAB (2011) Fuzzy Modeling Based Resource Management for Virtualized Database Systems. MASCOTS
25. Xu J, Zhao M, Fortes J (2008) Autonomic Resource Management in Virtualized Data Centers Using Fuzzy-logic-based Control. Cluster Computing
26. Padala P, Hou K, Shin K, Zhu X, Uysal M, Wang Z, Singhal S, Merchant A (2009) Automated Control of Multiple Virtualized Resources. SIGOPS/EuroSys
27. Liu X, Zhu X, Padala P, Wang Z, Singhal S (2007) Optimal Multivariate Control for Differentiated Services on a Shared Hosting Platform. CDC
28. Lama P, Zhou X (2011) PERFUME: Power and Performance Guarantee with Fuzzy MIMO Control in Virtualized Servers. IWQoS
29. Wang L, Xu J, Zhao M, Fortes J (2011) Adaptive virtual resource management with fuzzy model predictive control. In Proceedings of the 8th ACM international conference on Autonomic computing, pp 191-192. ACM
doi:10.1186/2196-1115-1-4
Cite this article as:Luet al.:v-TerraFly: large scale distributed spatial data visualization with autonomic resource
management.Journal of Big Data20141:4.
Submit your manuscript to a
journal and benefi t from:
7Convenient online submission 7Rigorous peer review
7Immediate publication on acceptance 7Open access: articles freely available online 7High visibility within the fi eld
7Retaining the copyright to your article