DOI 10.1007/s12651-013-0140-3 A RT I C L E
Changes in workplace tasks in Germany—evaluating skill
and task measures
Daniela Rohrbach-Schmidt·Michael Tiemann
Published online: 21 August 2013
© Institut für Arbeitsmarkt- und Berufsforschung 2013
Abstract The task approach is attracting increasing atten-tion and recogniatten-tion among scholars in economics, sociol-ogy and related fields. However, measurement still presents an important challenge to the task approach. This paper stud-ies the comparability of task measures in the commonly used German BIBB/IAB-BIBB/BAuA employment cross-sections on qualification and working conditions from 1979, 1985/86, 1991/92, 1998/99, and 2006. We hypothesize that findings on task-biased technological change are sensitive to variable choice. The task data differ substantially from other task data, and task items are not readily comparable between survey years. As a result, classifying single task items into distinct domains leads to a number of problems. To test our hypothesis, we use different strategies for classi-fying tasks into task domains, and analyze whether different operationalizations lead to different conclusions about task change in Germany. Our results show that this indeed is the case. Our paper provides readers with a broader understand-ing of German task data and gives recommendations for ap-plying the task approach to German employment data.
Wandel der Tätigkeiten am Arbeitsplatz in Deutschland – Analysen von Skill und Task-Maßen
Zusammenfassung Der Task-Ansatz findet zunehmende Beachtung unter Ökonomen, Soziologen und verwand-ten Disziplinen. Allerdings stellen Operationalisierung und Messung eine besondere Herausforderung des Ansatzes dar.
D. Rohrbach-Schmidt (
B
)·M. Tiemann Robert-Schuman-Platz 3, 53175 Bonn, Germany e-mail:[email protected]M. Tiemann
e-mail:[email protected]
Dieser Artikel untersucht die Vergleichbarkeit von unter-schiedlichen Operationalisierungen des Task-Ansatzes an-hand der BIBB/IAB-BIBB/BAuA Erwerbstätigenbefragun-gen 1979, 1985/86, 1991/92, 1998/99 und 2006. Unsere Hypothese ist, dass Ergebnisse zum task-biased technologi-cal change in Deutschland von der Operationalisierung der Tätigkeitsgruppen abhängig sind. Die Tätigkeitsdaten der Erwerbstätigenbefragungen unterscheiden sich grundlegend von anderen der im Rahmen des Task-Ansatzes verwendeten Datensätzen; einzelne Tätigkeitsitems sind zudem nicht oh-ne weiteres zwischen den einzeloh-nen Erhebungswellen ver-gleichbar. Dementsprechend ist die Zuordnung einzelner Tätigkeitsitems zu Gruppen mit einer Reihe von Schwierig-keiten verbunden. Um unsere Annahme zu prüfen, nutzen wir unterschiedliche Klassifizierungsstrategien für die Zu-ordnung einzelner Tätigkeitsitems zu Tätigkeitsgruppen und untersuchen, ob die alternativen Operationalisierungen zu unterschiedlichen Schlussfolgerungen zum Tätigkeitswan-del in Deutschland führen. Unsere Ergebnisse bestätigen das. Der Artikel beschreibt die deutschen Tätgkeitendaten der Erwerbstätigenbefragungen und gibt Empfehlungen für die Anwendung des Tätigkeitsansatzes mit diesen Daten.
1 Introduction
the same time, computers also complement complex non-routine problem-solving tasks and complex communications tasks. Conversely, low-skilled, manual, non-routine jobs are not directly affected by computerization. Therefore, their hypothesis is that computerization leads to a decline in the demand for middle-education workers and leads to an in-crease in the relative demand for both the most educated and least educated workers. Studies for the U.S., Great Britain and certain European countries suggest that the relative de-mand trends for skilled workers have been polarized since the 1990s (Autor et al.2006,2008; Goos and Manning2007; Spitz-Oener 2006; Dustmann et al.2009 and Goos et al. 2009).
Autor and Handel (2009) argue that one of the challenges to the task approach is measurement. To date, researchers have mostly employed the task approach with job task mea-sures at the occupational level. By contrast, Autor and Han-del (ibid.) use both occupational and worker level data. With both types of data, they show that job tasks vary significantly among workers in a given occupation, that variance in job tasks is systematically related to the worker’s race, gender and education and that job tasks at the worker level are sig-nificant predictors of wages.
The German BIBB/IAB- and BIBB/BAuA employment cross-sections on qualification and working conditions from 1979, 1985/86, 1991/92, 1998/99, and 2005/20061 (also known as the “Qualification and Career Surveys”) are rare examples of databases providing information on job tasks at the worker level over a long time period. Spitz-Oener (2006) first used this data to apply the task approach to the Ger-man case. Following her approach, Ger-many subsequent pub-lications have made important contributions to the debate on task-biased technological change in Germany (Gathmann and Schoenberg2010; Spitz-Oener2006,2008; Black and Spitz-Oener2010; Antonczyk et al.2009).
Unquestionable, the German data are an immensely valu-able source for research on the task approach. Importantly, however, the task items reported in these cross-sections were not originally intended to measure the ALM task domains, and the data differ substantially from other task data. More-over, as we will demonstrate, the data have considerably changed over the years. In conclusion, the process of classi-fying single tasks into distinct domains leads to a number of problems which we will address here.
Given the background of past research, this paper aims to evaluate the comparability of task measures in the Ger-man data and to explore in how far results on task change
1In 1979, 1985/86, and 1991/1992 data were surveyed by the Federal Institute for Vocational Education and Training (BIBB) in cooperation with the Institute of Employment Research (IAB) of the German Fed-eral Labour Office (BA), and in the years 1998/99 and 2005/2006 to-gether with the Federal Institute for Occupational Safety and Health (BAuA). Between October 2011 and March 2012, a sixth Qualification and Career Survey has been conducted by BIBB and BAuA.
in Germany are robust to variable choice. We hypothesize that findings depend on the measures specified. To test our hypothesis, we apply different strategies to classify tasks into task domains, and we subsequently analyze how re-sults on task change for these different operationalizations compare. Our results demonstrate that different operational-izations lead to different conclusions about task change in Germany.
The paper is organized as follows. We start by briefly re-viewing the literature on the task approach, focusing on how the relevant task domains are determined and how they are measured. The third section focuses on the data. We give an overview of our methodologies and describe the general content of the data with a particular emphasis on task items. In the fourth section, we apply three different strategies of operationalizations to our data. The fifth section compares the three operationalizations and explores in how far results depend on the measures specified. In the last section, we summarize our recommendations for applying the task ap-proach to German data.
2 What are relevant tasks, and how are they measured?
Changes in job skill requirements, workplace tasks, technol-ogy use and new management practices are debated inten-sively in the labor market literature. However, most avail-able data do not include measures that address the current research questions and approaches. The task framework is a prominent example for this. In their paper, ALM differenti-ate five domains of job tasks: routine manual tasks, routine cognitive tasks, non-routine manual tasks, and non-routine cognitive tasks, i.e., analytical and interactive tasks (Autor et al.2003, p. 1286). The most relevant differentiation is be-tween routine and non-routine tasks.
In their reading,
a task is “routine” if it can be accomplished by ma-chines following explicit programmed rules. Many manual tasks that workers used to perform, such as monitoring the temperature of a steel finishing line or moving a windshield into place on an assembly line, fit this description. Because these tasks require methodi-cal repetition of an unwavering procedure, they can be exhaustively specified with programmed instructions and performed by machines. (ibid., p. 1283).
As Autor et al. (2003) conclude, the substitution of rou-tine manual tasks is not new; however, computerization is now able to replace routine cognitive tasks, namely repeti-tive information-processing tasks, as well.
by machines. Navigating a car through city traffic or deciphering the scrawled handwriting on a personal check-minor undertakings for most adults-are not rou-tine tasks by our definition (. . .). The reason is that these tasks require visual and motor processing capa-bilities that cannot at present be described in terms of a set of programmable rules [. . .]. (ibid., p. 1283). The central argument of their seminal paper, therefore, is that computers substitute for cognitive and manual routine tasks at the same time as they complement cognitive non-routine tasks. (This is referred to as the “routinization hy-pothesis” in Goos et al. 2009.) As explained in the quote above, non-routine manual tasks such as navigating a car or cleaning are not directly affected because they require sit-uational, visual, or language capabilities and interpersonal communication.
Moreover, ALM assume that different domains of job tasks are typically performed by different groups of skilled workers: cognitive non-routine tasks would be typical for (high-) skilled professional and managerial jobs, routine manual and cognitive tasks constitute most middle-education jobs, and manual non-routine tasks are mostly performed by unskilled workers. As a result, the task model predicts an increase in the relative demand for the most-skilled and least-skilled workers and a decline in the relative demand for middle-skilled workers.
ALM use the Fourth (1977) and Revised Fourth Edi-tion (1991) of the U.S. Department of Labor’s DicEdi-tionary of Occupational Titles (DOT) to apply the task model to the data. These databases include detailed evaluations of more than 12,000 occupations along with 44 objective and subjec-tive job characteristics. As ALM note, these evaluations are based on first-hand observations of workplaces by Depart-ment of Labor examiners (Autor et al.2003, p. 1292). ALM aggregate these evaluations at the level of three-digit Cen-sus Occupation Codes. These DOT data are merged with individual worker observations and aggregated at the level of 140 Census industries. To measure changes in job task requirements, these researchers inspect changes in the oc-cupational distribution of employment (while holding task content within occupations at the 1977 DOT level constant). They also examine changes in task content measures within occupations by matching occupations between the two DOT editions (ibid.).
ALM select the DOT measure of “general educational development in mathematics” (“GED Math”) as a measure for non-routine analytic tasks. The DOT measure of “adapt-ability to accepting responsibility for the direction, control, or planning of an activity” (DCP) is used to measure non-routine interactive tasks. For non-routine cognitive tasks, these researchers select the DOT measure of “adaptability to sit-uations requiring the precise attainment of set limits, toler-ances, or standards” (STS). As a measure of routine manual
activity, ALM choose the DOT variable measuring the “abil-ity to move fingers, and manipulate small objects with fin-gers” (“Finger Dexterity”). Finally, these researchers select the variable “Eye Hand Foot Coordination” as a measure for non-routine manual tasks. According to the DOT definition, this variable measures the “ability to move the hands and foot coordinately with each other in accordance with visual stimuli.”2
Their analyses affirm changes in job task requirements toward non-routine tasks. They demonstrate that these changes were a relevant factor in U.S. demand shifts favor-ing educated labor beginnfavor-ing in the 1970s. ALM are sensi-tive to the concern that the choice of variables could matter; therefore, they reanalyze the data using alternative compos-ite variables computed based on the results of a principal components analysis. They conclude that while their results are generally robust to variable choice, variable choice mat-ters nevertheless. (ALM, p. 1306).
Following their approach, Goos and Manning (2007) use the DOT data to demonstrate pervasive job polarization into “lovely” (high-paid) and “lousy” (low-paid) jobs in Britain in the period from 1975 to 1999.3In their 2009 paper “Job polarization in Europe” Goos, Manning and Salomons use 96 variables from the US Occupational Information Net-work (O*NET) database to apply this approach to a cross-national comparative analysis of selected European coun-tries. This paper documents similar polarization trends in these countries as well (for a more detailed reflection on the O*NET data, see Handel2009). Following Autor and Dorn (2009), Goos et al. (2009, p. 60) use principal component analysis to construct measures for “abstract”, “routine” and “service” tasks (“manual” tasks in Autor and Dorn (2009), using the Fourth DOT edition).
In their 2009 MIT working paper, Autor and Handel re-view the task approach literature and highlight that measure-ment presents an important challenge for the task approach (p. 3). They conclude that DOT and O*Net have substan-tial limitations for tasks measurement, most significantly be-cause they only “provide information on job characteristics at the level of occupations, not workers” (Autor and Handel 2009, p. 3–4).
Autor and Handel combine task measures from O*Net with self-reported job tasks at the worker level from the Princeton Data Improvement Initiative (PDII) and classify nine single tasks items in measures for “cognitive”, “inter-personal”, and “physical” dimensions of job demands,
cor-2For single task pooled in these measures see Autor et al. (2003, p. 1323).
responding to the Data, People, and Things classification used in the DOT (ibid., p. 12).4Thus, in this study, the au-thors do not differentiate between routine and non-routine tasks. Instead, the “physical” dimension is a combined mea-sure of physical and routine tasks (for a similar approach, see Green20125). Thus, this paper’s use of “routine tasks” with regards to the first item overlaps with tasks that are de-scribed as non-routine manual tasks in the 2003 ALM paper. The second item (repetitive tasks) however, seems to cor-respond with ALM’s theoretical definition of routine tasks better than the operationalization in their 2003 paper; “Fin-ger Dexterity” presumably includes also non-routine tasks. This has probably resulted in confusion about definition and following matching between manual working activities and routine tasks in different papers.6
Autor and Handel show that job tasks vary significantly among workers within a given occupation, that this variance is systematically related to the worker’s race, gender and ed-ucation and that job tasks at the worker level are significant predictors of wages, even when occupation-level job tasks are included in the model. Altogether, their analysis presents evidence for the usefulness of job task measures at the per-son level.
Spitz-Oener (2006) applies the task approach to Germany and therefore uses the BIBB/IAB- and BIBB/BAuA cross-sections. Spitz-Oener does not use any statistical method of classification, but she selects items from the first four waves to classify job tasks into the five domains proposed in the ALM paper.7This author’s task index measures the
4These single job tasks measuring the three domains are (cp. Autor and Handel2009, p. 13): “cognitive job demands: (1) the length of longest document typically read as part of the job (ranging from one page or less to more than 25 pages); (2) frequency of mathematics tasks involving high-school or higher mathematics (algebra, geometry, trigonometry, probability/statistics, or calculus); (3) frequency of prob-lem solving tasks requiring at least 30 minutes to find a good solution; and (4) proportion of work day managing or supervising other work-ers. (. . .) interpersonal job demands: (1) interactions with customers or clients; (2) interactions with suppliers or contractors; and (3) inter-actions with students or trainees (. . .) physical and routine job tasks: (1) proportion of the work day spent performing physical tasks such as standing, operating machinery or vehicles, or making or fixing things by hand; and (2) proportion of the work day spent performing short, repetitive tasks.”
5Green (2012) studies changes in job skills using task data from the U.K. Skill Survey of 1997, 2001, and 2006 and the 1992 Employment Survey in Britain. He points out that in the empirical testing of the ALM model there is some potential for misclassification and that the classification of tasks as either routine or nonroutine is especially prob-lematic.
6We thank one of the anonymous reviewers for this hint.
7The single tasks are (Spitz-Oener2006, p. 243): Non-routine ana-lytic: “Researching, analyzing, evaluating and planning, making plans/ constructions, designing, sketching, working out rules/prescriptions, and using and interpreting rules”; Non-routine interactive: “Negoti-ating, lobbying, coordin“Negoti-ating, organizing, teaching or training,
sell-share (between zero and hundred) of tasks a worker per-forms among all activities (tasks) in one domain. Based on this operationalization, and the aggregation of task shares at the occupation-level, Spitz-Oener (ibid.) finds evidence for changes in job tasks and skill demand in West Germany, similar to ALM’s findings for U.S. data. This author demon-strates that the shift toward analytical and interactive activ-ities and away from cognitive and manual routine tasks ac-companies changes in skill demand and employment polar-ization.
Following this researcher’s approach,8 many important subsequent contributions to the debate on task-biased tech-nological change in Germany have been published (Spitz-Oener 2008; Antonczyk et al. 2009; Black and Spitz-Oener 2010; Gathmann and Schoenberg 2010; Geel and Backes Gellner2011; Geel et al.2011). Among these stud-ies, Antonczyk et al. (2009) make simultaneous use of the 2006 and the 1999 surveys. To operationalize the task domains, these researchers follow Spitz-Oener (2006) “as closely as possible” and aggregate the 14 different tasks re-ported in the data to five task measures.9Due to the differ-ent task items available for each survey year, these authors’ measures vary, particularly in the domains of routine and non-routine manual tasks. In addition to the task index de-rived from Spitz-Oener, these researchers report results for a job complexity task index that measures the share of re-ported tasks in one domain among all tasks rere-ported by the worker.
Interestingly, for the Spitz-Oener index, the findings for 1999 to 2006 deviate strongly from Spitz-Oeners findings for the period from 1979 to 1998/99. Instead of an increase in all types of non-routine tasks and a decrease of manual
ing, buying, advising customers, advertising, entertaining or pre-senting, and employing or managing personnel”; Routine cogni-tive: “Calculating, bookkeeping, correcting texts/data, and measuring length/weight/temperature”; Routine manual: “Operating or control-ling machines and equipping machines”; Non-routine manual: “Re-pairing or renovating houses/apartments/machines/vehicles, restoring art/monuments, and serving or accommodating”.
8As for the O*NET data, researchers applied factor or principal com-ponent analysis to construct highly reliable, parsimonious indicators for “cognitive”, “manual” or “interactive task” out of the single task items in the German database. This strategy was applied to single waves, and authors used a wider range of skill (requirement) items in addition to the task questions (e.g. Nedelkoska and Neffke2010; Bublitz and Noseleit2012with the 2006 data).
and cognitive routine tasks, the authors find a large decrease in non-routine manual tasks, an increase in routine cogni-tive tasks, and no change in the level of non-routine interac-tive tasks. The authors conclude: “This discovered opposing trend in the development of the routine cognitive and non-routine manual task domains is very notable.” (ibid., p. 9).
To sum up, the literature review shows that both the data itself and researchers’ methods to classify task items into distinct domains vary substantially. To some extent this is a natural consequence of different research questions (occu-pational or workplace studies). However, especially with re-gards to the domain of routine tasks, operationalizations and (interpretations of) results differ. Though this domain is the-oretically well defined, it is very hard to identify codifiable routine tasks in whatever datasets on ex ante grounds (see also Green2012, p. 41). Altogether, this should sensitize us to how the operationalization affects how we interpret task change. Our hypothesis is that this especially applies to the German case.
The next chapter is devoted to describing the methodolo-gies and general content of the German task data with par-ticular emphasis on task items. We systematically discuss the idiosyncrasies of the German data’s task measures and thereby demonstrate that difficulties as regards operational-ization might be enforced by the fact that the data are not readily comparable between survey years.
3 Job task measures in the German BIBB/IAB and BIBB/BAuA Surveys from 1979–2006
3.1 Data collection and survey content
The BIBB/IAB- and BIBB/BAuA employment cross-sections from 1979, 1985/86, 1991/92 and 1998/99 and 2005/2006 are worker-level probability samples and include informa-tion on employees’ qualificainforma-tion and career history, as well as detailed job-related information (e.g., organizational in-formation, job tasks, job skill requirements, working con-ditions, health). With large sample sizes of 20,000 to over 30,000, the database was designed for research on special social groups (such as old-age, female, non-formally quali-fied workers, workers with different national backgrounds) and structural developments within specific occupations, in-dustries and vocational fields.
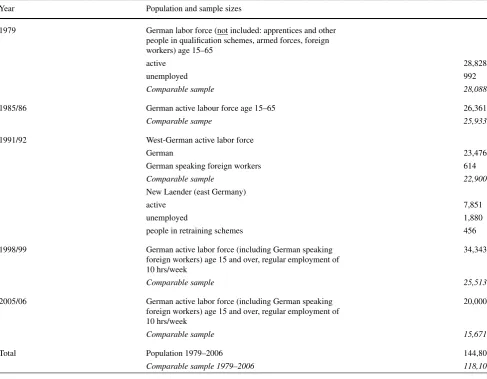
Over the years of survey implementation, there have been changes to the study’s population, modes of data collec-tion, and content. Table 1 gives a brief overview of the differences in population and sample size. Up to 1998/99, the survey collected information from a 0.1 percent sam-ple of Germany’s workforce population (thus being a “small Mikrozensus” (Parmentier and Dostal2002, p. 39)). Across all years of survey data, the concept of core-employment
(“Kernerwerbstaetigkeit”) is applied to the working popu-lation: employees and workers aged 15 or older working at least 10 hours per week are included, as well as indi-viduals attending a qualification scheme who are also in a paid employment program (e.g., students or apprentices with side jobs of at least 10 hours/week) and helping fam-ily members or other employees whose employment is in-terrupted for a maximum of three months. In contrast, em-ployees whose employment constitutes a compulsory part of their vocational training (e.g., an apprenticeship train-ing in the dual system) are not included in the survey data. Similarly, the dataset does not include information on “paid voluntary work” (i.e. voluntary work one gets expense allowances for), employees in compulsory military work, community service, or voluntary work in the social or en-vironmental sector. Beginning with the 1991/92 survey, the dataset includes the resident population of East Germany and workers with qualifications from the former German Democratic Republic. In 1991/92, unemployed individuals were also included in the study-population (Rohrbach2009; Zopf and Tiemann2010).
Data collection methods also changed over different years of the survey: the mode changed from face-to-face per-sonal interviews with standardized Paper-and-Pencil ques-tionnaires (1979–1991/92) to Computer-Aided Personal In-terviews (1998/99) to Computer-Aided Telephone Inter-views (2005/06). The questionnaire itself was changed ac-cordingly.
To date, no cumulative, synchronized data file of all five cross-sections exists. Yet, a first synopsis of selected vari-ables of the first four cross-sections (Hartmann2000) could be utilized. Based on a program for merging comparable samples of respondents and some core variables (including weights) over the first four waves, we added selected vari-ables (and cases) from the cross-section 2005/06. We thus reduce the study population to comparable cases and so nar-row the scope for effects resulting from different samples.
The final dataset for the analyses presented in this paper includes information collected over the period from 1979 to 2006 and, for each survey year, comprises representative samples of employees from the western part of Germany, aged 15 to 65, who belonged to the labor force (defined as having a paid employment situation) with a regular working time of at least ten hours per week. The total sample size is 118,105 (see Table1).
3.2 Task and skill items
Table 1 Population and sample sizes for the cross-sections
Year Population and sample sizes
1979 German labor force (not included: apprentices and other people in qualification schemes, armed forces, foreign workers) age 15–65
active 28,828
unemployed 992
Comparable sample 28,088
1985/86 German active labour force age 15–65 26,361
Comparable sampe 25,933
1991/92 West-German active labor force
German 23,476
German speaking foreign workers 614
Comparable sample 22,900
New Laender (east Germany)
active 7,851
unemployed 1,880
people in retraining schemes 456
1998/99 German active labor force (including German speaking foreign workers) age 15 and over, regular employment of 10 hrs/week
34,343
Comparable sample 25,513
2005/06 German active labor force (including German speaking foreign workers) age 15 and over, regular employment of 10 hrs/week
20,000
Comparable sample 15,671
Total Population 1979–2006 144,801
Comparable sample 1979–2006 118,105
Notes: Comparable Sample comprises West-German active labor force (defined as having a paid work) aged 15 to 65, with a regular working time of at least ten hours per week
In the German data the individual worker represents both the survey response unit and the unit of analysis (and thus allows for the study of within occupational heterogeneity). The data include self-reported job tasks for workers’ main jobs at the worker level. Broadly speaking, in all survey years, respondents are asked to select which of the listed tasks correspond to their jobs.
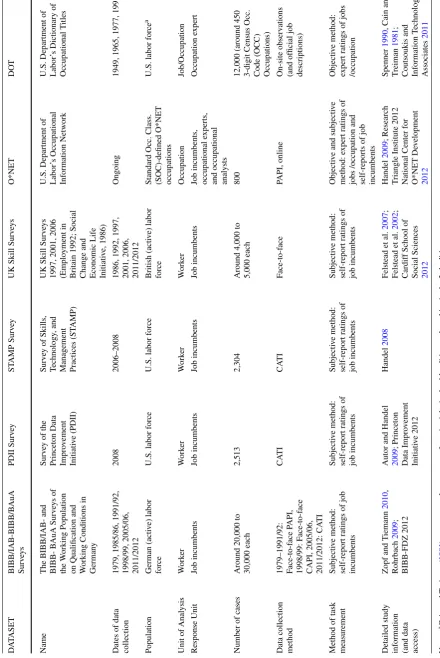
This “subjective method” differs from “objective” mea-sures in the DOT and O*NET data, which (also) rely on expert ratings for job titles in an occupational classification. The primary advantage of objective measures is that they are based on clear definitions and detailed measurement instruc-tions. However, the person-level measure captures within occupational heterogeneity in job tasks and thus avoids ag-gregation bias. Moreover, in the literature, the subjective method is said to correspond better with real job
require-ments and is said to be more reliable and valid (McGuinness 2006and Hartog2000).10
With regards to over-time comparisons, both methods suffer from comparability problems. E.g. in the fourth edi-tion of the DOT around two-thirds of ratings of job titles were taken over from earlier editions, so that change might be underestimated (Spenner1990). Cain and Treiman (1981, p. 273) even come to the conclusion that “the DOT cannot legitimately be used to study changes in the job content of the economy over time.” With both methods it is unclear to what extent results on trends are artifacts since the 1970s
Ta b le 2 Selected characteristics o f task d atasets u sed in the task approach literature D A T A SET B IBB/IAB-BIBB/B A uA Surv ey s PDII Surv ey ST AMP S urv ey U K S kill Surv ey s O *NET DO T Name The B IBB/IAB-and BIBB-B A uA Surv ey s o f the W orking Population on Qualification and W o rking C onditions in German y Surv ey of the Princeton Data Impro v ement Initiati v e (PDII) Surv ey of Skills, T echnology , and Management Practices (ST A MP) UK Skill Surv ey s 1997, 2001, 2006 (Emplo yment in Britain 1992; Social Change and Economic Life Initiati v e, 1986) U.S. Department of Labor’ s Occupational Information N etw o rk U.S. Department of Labor’ s Dictionary of Occupational T itles Dates o f d ata collection 1979, 1985/86, 1991/92, 1998/99, 2005/06, 2011/2012 2008 2006–2008 1986, 1992, 1997, 2001, 2006, 2011/2012 Ongoing 1949, 1965, 1977, 1991 Population G erman (acti v e) labor force U.S. labor force U .S. labor force B ritish (acti v e) labor force Standard Occ. Class. (SOC)-defined O *NET occupations U.S. labor force a Unit of Analysis W o rk er W o rk er W o rk er W o rk er Occupation Job/Occupation Response U nit Job incumbents Job incumbents Job incumbents Job incumbents Job incumbents, occupational experts, and o ccupational analysts Occupation expert Number of cases Around 20,000 to 30,000 each 2,513 2,304 Around 4,000 to 5,000 each 800 12,000 (around 450 3-digit C ensus O cc. Code (OCC) Occupations) Data collection method
1979–1991/92: Face-to-f
cohort of respondents and raters interprets (the meaning of items) differently from those in 2006.
The tasks surveyed in the German database do not repre-sent multiple task items for larger factors or constructs, such as in DOT or O*NET. There are no items with an anchored rating scale response format11to reflect the complexity level of the task item (for example, ALM use the DOT “GED Math” measure as a proxy for analytic tasks).
Finally, the task items are not based on what Handel calls an “explicit scaling approach”12 (Handel2008, p. 12–13), such as in the survey of Skills, Technology, and Manage-ment Practices (STAMP, see Handel2009, and Table2).
Thus, the database’s task measures differ substantially from the DOT and O*NET data also with regards to their rating scale response format. It is, however, not easy to as-sess consequences of these differences for the study of task change; while the more advanced response formats might generally raise the reliability of measures, their validity, i.e. the degree to which the selected task items survey what they are supposed to measure, to the best of our knowledge has not been compared systematically so far.
In addition to its striking differences to other measures in the task approach literature, the BIBB/IAB-BIBB/BAUA task measures themselves differ considerably between sur-vey rounds: (a) the wording of questions, (b) the response categories, (c) the number of task items surveyed, and (d) the content and wording of the surveyed task items have changed. The wording of questions changed as the mode of collection changed.13That is, in 1979, respondents were asked to mark with a cross “all tasks that accrued recently
11This technique uses concrete examples for selected response cate-gories of a scale to give respondents common reference points and help them selecting an answer (Handel2009, p. 12). For instance, the O*Net questionnaire uses a 7-point scale for number facility that is an-chored by three behavioural examples: Add 2 and 7 (level 1), Balance a checkbook (level 3) and Compute the interest payment that should be generated from an investment (level 5; see ibid.).
12This includes questions and response options that are “objective, specific, correspond directly to researchers’ objects of interest, and have absolute meanings for respondents. (. . .) Questions are phrased in terms of facts, events, and behaviors, rather than attitudes, evaluations, and holistic judgments.” (Handel2008, p. 12–13). Handel expects them to have lower measurement error because the scope for respondents’ subjective interpretations of the meaning of items is as low as possible. 13To the best of our knowledge, there is no study on effects of chang-ing data collection modes on task composition. From the literature on method changes in general (Roberts2007; Jäckle et al.2008), we do not expect relevant differences in the answering behaviour (measure-ment error); job tasks as surveyed here are not sensitive questions and thus should not provoke social desirability. All five rounds are proba-bility samples of the German active labor force and we use compara-ble samples of respondents, i.e. we do not expect serious effects due to differences between respondents attracted by different modes (non-response error) or coverage error. For the first time, the 2011/12 survey includes a mode comparability study so that mode effects on selected variables can be systematically studied in the near future.
in your job”, in 1985/86 and 1991/1992, respondents were asked to select from a list handed to the respondent “all tasks that belong to your job,” and in 1998/99 and 2006, respon-dents were asked to indicate whether and how frequently the tasks read in random order by the interviewer “appear at your job”. Thus, from 1979 to 1991/92 it was surveyed whether a task was performed or not;14 from 1998/99 on, respondents were asked to indicate the frequency of tasks they perform (“frequently”, “sometimes” (2006) / “seldom” (1998/99)15or “never”16).
To illustrate (c), in 1979, there were a maximum of 121 single task items, whereas by 1999, there were only 13 sin-gle task items available to respondents. An analysis of the content (and number) of changes in task items surveyed would lead researchers to conclude the importance of non-routine analytic and interactive tasks increased over time. To use a concrete example, the single task item of “manufactur-ing goods” in 2006 was represented by more than 30 s“manufactur-ingle task items, such as “spinning, weaving, knitting,” or “tan-ning, conserving” in 1979. On the contrary, until the data collection in 2005/2006, the number of non-routine cogni-tive tasks increased disproportionally.
As a consequence of the large reduction in items, prin-cipally there is a much higher probability that respondents mark one item in 1979 than in 1998/99. However, mostly the decline in items is not to the disadvantage of the scope of tasks covered. Rather, as illustrated by “manufacturing” above, more disaggregated job tasks in earlier waves are ag-gregated into broader groups of tasks in later ones.17
Naturally, the task items in the dataset were not origi-nally intended to measure the ALM domains of “routine” and “non-routine” tasks. The employment surveys were in-tended to gather information not available in the German Mikrozensus (see Parmentier and Dostal2002 for a com-prehensive overview). Regarding questions on specific tasks there is no reference to a single theoretical framework. Tasks
14In 1985/86 there is a consecutive question about which task is per-formed predominantly (question 13B). It was only asked when more than one task were carried out (as stated in question 13A). Data on question 13B was not used for the described analyses.
15The original synopses of the cross-sections conflates frequencies of “sometimes” or “seldom” with “never”. Especially in 1998/99 this was sensible, “seldom” in German is less often than “sometimes” and al-most “never”. Additionally the frequencies of appearance of single tasks seem to have been taken into account. With “sometimes” added to “frequently”, numbers would have grown substantially. When adding the 2005/06 data we perpetuated the original operationalization. 16It is obvious that ordinal and nominal scales have large disadvantages when computing additive scales. Because the relevant task domains are unevenly covered by task items, the indices regularly vary in their mea-sures of central tendencies and variance purely by construction (see Sect.3.3).
were first surveyed in the German Mikrozensus of 1969 (Statistisches Bundesamt 1971). As far as we can assess, the task items then were based on a translation of the “Work Performed Manual” (Statistisches Bundesamt1967). Preiser (1979, pp. 4 f.) describes the discussion between Federal Statistical Agency and Federal Labour Office that lead to the surveying of tasks. There seem to have been two main reasons: to be able to describe occupations, supplementing and possibly improving occupational classifications (occu-pational classifications were seen to come to their limits as occupations evolved) and to gather information for the de-scription of occupational positions used in the employment services. Being able to describe the structure of tasks and its change over time was also part of the discussion. Given this, these questions cannot be said to be based on theory. Rather, the first inclusion of task item questions in 1979 dates back to what had been done and discussed in the late 60’s and 70’s. The changes in the number and content of questions signals that survey researchers have tried to adapt the mea-surement instrument to structural changes in the workforce (which is stated explicitely for the items of cross-section 1998/99 in Parmentier and Dostal2002, p. 37f.).
Changes in the content and wording of single items take place gradually over the cross-sections. In many cases, a group of related tasks are condensed into fewer items in the next wave, or a small number of other tasks were added or removed from the task item. For instance, in 1979, there were nine single task items for “overseeing, operating plant and machines”. These items were subsumed into two task items in 1985/86 and finally into one task item in 1998/99.18 On the contrary, some few items are split up and confounded with new task items; as a result, these tasks cannot be ob-served separately over the years.
One strategy to handle different task item measures would be to classify items from each survey wave, even if they appear only once, into the five ALM domains wave for wave. Then, in principle, one domain could include different items for each survey wave. However, this strat-egy makes it difficult to differentiate between substantial changes and changes that result simply from changing mea-sures. Also, it is possible that the interpretation of single task items changed over time. In a principal component analysis of the task items it became clear that over time some of the items had changed their meaning for the surveyed per-sons.19 Therefore, we identified comparable task items in
18However, even if the content did not changed much, it is not clear whether respondents from later rounds interpret the items’ meaning in the same way as respondents from earlier ones.
19This principal component analysis covered only task items that were surveyed comparably in all cross-sections. Here some items changed their correlations to the first three principal components and all other items over time. Their relative positions changed which can be inter-preted as changes in their attributed meaning. Results upon request.
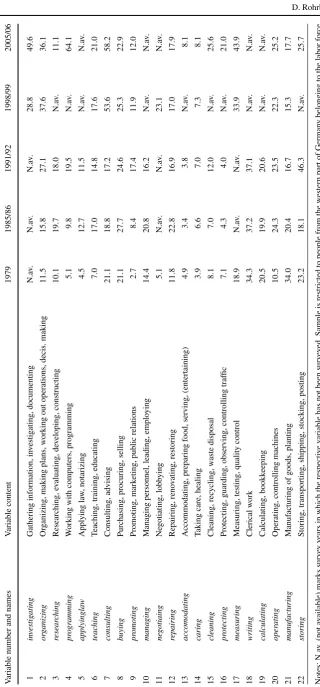
each wave for which survey data exists for at least two of the five cross-sections having interpretations as clear as pos-sible. We thereby assume maximal comparability to earlier waves, as well as comparability between 1998/99 and 2006, when we count “frequently” performed tasks. As a result, we end up with 22 task variables (Table3). Table3includes variable names20 (col. 2), the single task items combined in each variable (col. 3), and their percentages in the study population in each survey round (col. 4). In the following, when using the variable names we refer to all task items combined in each variable.
The 22 items show some interesting developments over time. For example, only for manufacturing can one see a de-cline in shares. However, even this dede-cline follows a more or less u-shaped curve and seems to be ascending again. Look-ing at a long timespan rangLook-ing from 1979 to 2006, for certain tasks, we could have expected more distinct developments or clear increasing or decreasing trends. There are also some changes that seem implausible (like the share for consulting rising from 17 to 54 percent between 1991/92 and 1998/99 or for storing rising from 18 to 46 percent between 1985/86 and 1991/92). Most of these reflect societal discussions like the one on the impact of services in the 1990s or they re-flect organisational changes across industries at the end of the 1980s.
However, it appears that almost all single tasks are in-creasingly performed by growing numbers of employees. Of course, this property may be a feature of the question-naire because the number of tasks for respondents to choose from steadily declined from over 120 in the first survey to less than 20 in the latest survey. Still, according to the task approach, tasks such as operating or repairing should have followed a more distinctive pattern of decline because they are (at least partially) programmable.
For non-routine manual tasks (such as caring, clean-ing and protectclean-ing), the trends follow patterns of increasclean-ing shares, as we would have expected under the task approach. Additionally, programming—even though this does not yet represent high-level computer-usage—gains shares. Orga-nizing and consulting show similar growth. The other tasks either keep constant shares, show no trend, or move in larger shifts around the mean. All in all, the composition of single tasks shows that insofar as tasks represent the components of jobs, one could argue for a growth in complexity of jobs as far as the number of tasks performed are concerned.21 While this is only a weak hint on growing complexity of jobs, also content analysis of jobs point in the same direction (cf. Tiemann2012). Of the tasks that could be categorized as routine, only manufacturing loses shares.
Furthermore, the database includes other skill items sur-veyed in all cross-sections that had fairly comparable word-ing and content of questions. In our analyses, we use compa-rable task items for job conditions (“Arbeitsbedingungen”) and job requirements (“Arbeitsanforderungen”) and recode items into a common metric, i.e., a dichotomous scale. For the sensitivity analyses, we also use education variables whose measures are highly consistent over the five waves. We recode degrees according to the International Classifica-tion of EducaClassifica-tion (ISCED 97).
3.3 Methods
In the previous sections, we argue that findings on task change based on the German database might be sensitive to variable choice. As demonstrated in the first part of this sec-tion, the German data differ substantially from their coun-terparts, and the data have changed considerably over the years. Altogether, the process of classifying single tasks into the widely used ALM scheme is not straightforward.
To test our hypothesis, we vary our method of pooling tasks into domains (Sect.4) and compare the values for task change over time (Sect.5).
The question, which task items should be pooled into the ALM domains can be understood as a problem of evaluat-ing the quality of multiple measures of the same concept, or, even more general, as a problem of the quality of survey measures. Corresponding to the three quality criteria objec-tivity, reliability and validity, we use three methods to solve the problem: The first, and nonstatistical method is to se-lect items by reviewing the literature, i.e. pool items in the same way as other authors have done before. This “research practice approach” simply asserts the belonging of items to domains by theory; no empirical operations accompany the operationalization.
Our second method is factor analysis (FA). FA is a stan-dard multivariate technique that is used for identifying the dimensional structure of a number of variables, the construc-tion of scales, for data reducconstruc-tion and the orthogonalisaconstruc-tion of variables (Gorsuch1983; cit. by Wolff and Bacher2010, p. 355). We use this technique, first, to analyse to what ex-tent the task variables in our data are dimensionally struc-tured by factors that can be interpreted as the ALM domains. Second, we pool tasks with factor loadings above .5 and a low uniqueness into the five ALM task domains. FA re-quires a correlation or covariance matrix. However, our task items are nominally scaled (respondent’s are asked whether or not the tasks appear at their job). We follow Kolenikov and Angeles (2004) in their advise to perform a factor analy-sis from a polychoric correlations matrix instead of from the nominal variables in the dataset.22 To find the numbers of
22We use the tetrachoric command and the factormat command in Stata. The Kolenikov and Angeles paper not only examines how
dis-factors to retain, we conduct a parallel analysis (O’Connor 2000). From the results (on request) we follow that five fac-tors (with eigenvalues greater 1 (Kaiser1958)) should be extracted. The model equation of the FA is
yij=zi1b1j+zi2b2j+ · · · +ziqbqj+eij (1)
whereyijis the value of theith observation on thejth
vari-able,zikis theith observation on thekth common factor,bkj
is the set of linear coefficients called factor loadings, andeij
is thejth variable’s unique factor (StataCorp2007, p. 288). To improve the interpretation of results, we then applied the default orthogonal varimax rotation without normalization, i.e. Kaiser off (Kaiser1958, see also Gorsuch1983). We val-idate the pooling of items into domains as suggested by the FA results by means of a reliability analysis (using Cron-bach’sα).
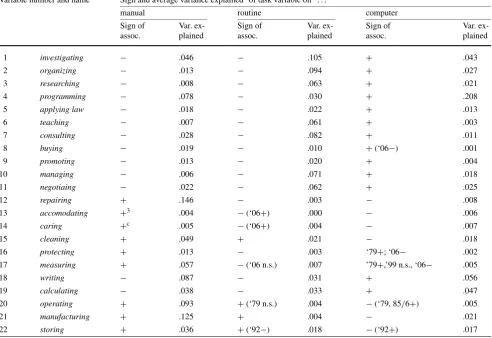
Objective and reliable measures must not necessarily be valid measures. Therefore, in a third step we analyze the cri-terion validity of task items to pool only tasks into the ALM domains that are of high validity (see Saris and Gallhofer 2007, Chaps. 9 and 10). The criterion validity describes the degree of correlation of a measure with an external crite-rion. The criterion (predicted) variables used for this valida-tion are external measures for manual, routine and computer tasks. We regress the criterion variables on single task items and evaluate the explanatory power and the signs (−/+) of the linear and (in the case of computer) the logistic associa-tion.
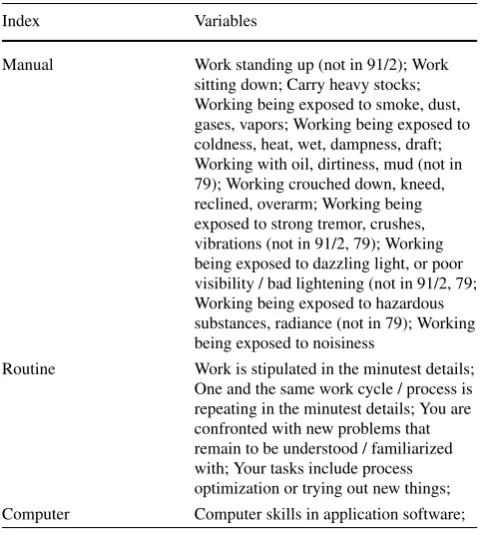
Our criterion variables are based on the comparable items for specific job conditions (criterion variable manual) and job requirements (criterion variables routine and computer). Both, job conditions and requirements, refer to what people are required to do at their workplaces. We compute a vari-able, manual, that aims to measure whether the current job is characterized by manual (or cognitive) skill requirements, a variable routine that reflects the degree of routine skill re-quirements, and a variable computer that measures the de-gree of computer use in the job. We also attempted to find a measure for interactive tasks; however, there is no com-parable information available in all survey waves. Manual is an additive index of ten items indicating whether the re-spondent has to “work standing”, “carry heavy stock” and other job conditions (see Table 8 in the Appendix). Rou-tine is an additive index that scores high if the current job is “stipulated in the minutest details” and “one and the same work cycle / process is repeating in the minutest details” and if respondents disagree that they “are confronted with new problems that remain to be understood / familiarized with” and disagree that their “tasks include process optimization
or trying out new things”. Alternative versions of manual and routine based on selection of other response questions lead to similar results (results upon request). Computer sim-ply measures whether the job requires skills in standard computer software.23Consistent with the ALM-hypothesis, manual and routine decrease and computer increases from 1979 to 2006.
In the fourth section, we will show that the resulting op-erationalizations differ between the three methods, which is a central finding of this exercise.
The fifth section presents a sensitivity analysis of whether they all lead to similar conclusions on task change in Ger-many or rather to what extent the results depend on the op-erationalization.
To this end, we apply the three operationalizations to the data using the formula for the computation of task indicators as it was introduced by Spitz-Oener (2006):24
Taskij t =
(Tij t)/
(Tj t)∗100 (2)
which is the percentage of task activities in domain j per-formed byiin cross sectiontof all task activities in domain j at timetwheret=1979, 1984/85, 1991/92, 1998/99, and 2005/06, andj =nonroutine analytic tasks, nonroutine in-teractive tasks, routine cognitive tasks, routine manual tasks and nonroutine manual tasks. In addition to this additive in-dex, we calculate a non-additive version which equals 1 if the respondent performs at least one of the tasks within one domainj. The reason is that the relevant task domains are unevenly covered by task items, so the indices regularly vary in their central tendencies and variances purely by construc-tion. We choose these simple indices for several reasons. First, this approach follows methods in the available liter-ature. Second, we aim to analyze changes in job tasks as “purely” as possible; we prefer simple computation of job complexity measures, rather than more advanced methods (for example, factor analysis) because we want to avoid de-trending our results by use of an artificially complex index.
For each of the three operationalizations we calculate the additive and non-additive indices’ percentages for ALM’s task domains over the period 1979 to 2006 based on the above discussed comparable sample of West German work-ers aged 15 to 65.
23Alternatively, computer could be measured by work tools used (see Spitz-Oener2006).
24This index is used exemplary here. Other indices of this sort are being calculated differently (like the one of Antonczyk et al.2009) but mostly get similar results (e.g. Antonczyk et al. (2009, p. 223) find their own index “indicates similar changes” to the Spitz-Oener index although there are partial differences. It has to be noted that an index like the one of Antonczyk et al. (2009, p. 222), summing up to one for each individual leads to the obligation of leaving one of the index variables out as a covariate in a regression analyses).
4 Classifying tasks into “task-approach” domains
4.1 Classification based on existing theory and research practice
By examining the 22 items, one can identify tasks with notably similar wording to items in the DOT or O*Net databases. Examples include “operating machines” (DOT) and “managing and supervising” (O*NET, Sect.2). In these cases, we classify them according to current research prac-tice. However, we cannot assess whether these German mea-sures are functionally equivalent to the U.S. meamea-sures. For most of the measures in the German database, there is no direct counterpart in the U.S. data. In these cases, the re-searcher must determine the domain. The potential for mis-classification is rather small with respect to the manual ver-sus cognitive dimension. In contrast, the identification of routine, programmable tasks within the two dimensions is especially challenging.
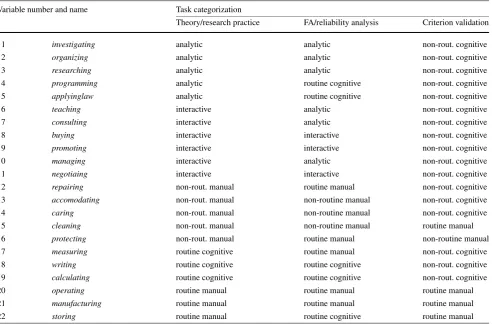
Reviewing Spitz-Oeners’ classification, Green notes that “calculating” might be misclassified as a cognitive routine task, given that the GED Math measure for non-routine cog-nitive tasks in the ALM paper includes the items “adds and subtracts 2-digit numbers”. Likewise, he notes that “selling” is a partly automated activity (e.g., Internet sales) and thus could alternatively be classified as a cognitive routine task. In addition, some items seem to include both routine and non-routine tasks. For instance, “measuring” includes mea-suring, testing, and quality control tasks. Whereas “mea-suring” can be considered a manual routine task (and the similar—though more specific—item “measures dimen-sions of bottle,” is classified as such by ALM), “testing” and especially “quality control” might also include non-routine job activities. As a rule, in these ambiguous cases, i.e., in the case of measuring, writing, calculating, oper-ating, manufacturing, storing, repairing, accommodoper-ating, caring, cleaning, and protecting, we follow the classifica-tions in the literature (i.e., Spitz-Oener2006; Gathmann and Schoenberg2010, and Antonczyk et al.2009). The resulting classification is shown in Table4, column 2.
4.2 Statistical classification
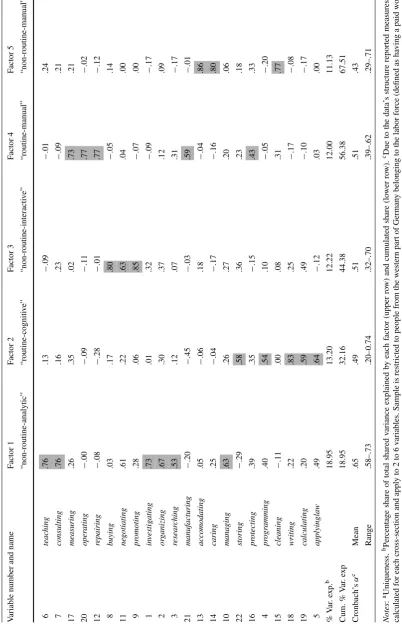
Table5 shows the rotated factor loadings (using the vari-max procedure) of task items on the five extracted factors and their uniqueness. For each variable, the highest loading (usually over.5, only for protecting at.43) is highlighted.
Table 4 Task items and their operationalization by the three classification methods
Variable number and name Task categorization
Theory/research practice FA/reliability analysis Criterion validation
1 investigating analytic analytic non-rout. cognitive
2 organizing analytic analytic non-rout. cognitive
3 researching analytic analytic non-rout. cognitive
4 programming analytic routine cognitive non-rout. cognitive
5 applyinglaw analytic routine cognitive non-rout. cognitive
6 teaching interactive analytic non-rout. cognitive
7 consulting interactive analytic non-rout. cognitive
8 buying interactive interactive non-rout. cognitive
9 promoting interactive interactive non-rout. cognitive
10 managing interactive analytic non-rout. cognitive
11 negotiaing interactive interactive non-rout. cognitive
12 repairing non-rout. manual routine manual non-rout. cognitive
13 accomodating non-rout. manual non-routine manual non-rout. cognitive
14 caring non-rout. manual non-routine manual non-rout. cognitive
15 cleaning non-rout. manual non-routine manual routine manual
16 protecting non-rout. manual routine manual non-routine manual
17 measuring routine cognitive routine manual non-rout. cognitive
18 writing routine cognitive routine cognitive non-rout. cognitive
19 calculating routine cognitive routine cognitive non-rout. cognitive
20 operating routine manual routine manual routine manual
21 manufacturing routine manual routine manual routine manual
22 storing routine manual routine cognitive routine manual
6 items. The factor has relatively high loadings of orga-nizing, investigating, researching and also managing, while teaching and consulting show the highest loadings. Factor 3 (13.20 percent of total var.), labeled “non-routine interac-tive”, is defined by buying, negotiating and promoting. Be-sides investigating and organizing, storing and calculating also show high correlations here. This phenomenon leads to confounding between the two non-routine cognitive factors and also makes it possible to interpret Factor 1 as “high-qualification tasks” and Factor 3 as “commercial” or “mer-cantile” tasks. Factor 2, here labeled “routine-cognitive”, holds high loadings of programming, writing, calculating and applyinglaw. While it seems sensible for manufacturing to have a strongly negative correlation, it is not clear how we should interpret the high positive loading of storing on this cognitive factor. Factors 4 and 5 are both described as man-ual tasks; while the former is regarded as routine, the latter is viewed as non-routine. On factor 4 measuring, operating, repairing and manufacturing show the highest loadings, on factor 5 these are accomodating, caring and cleaning. Tasks such as investigating, programming, writing and calculating show negative loadings on both manual factors. Why this does not hold for researching, consulting and buying raises further questions, just as the negative loading of
manufac-turing with non-routine-manual also bears further investi-gation. A close examination of the factor loadings matrix raises a number of questions about what the task items re-ally measure. The implicit assumption is that what is rere-ally measured and extracted here is a broader view of shaping or structuring the form of occupations and in that way re-flecting structural changes in the occupational organization of the German labour market (Tiemann2012). Inspecting the reliability of indices based on this factor solution yields values for Cronbach’sαbetween.2 and.7 with means over cross-sections of around.5 for factors 2 to 5, and of.65 for the non-routine analytic factor. So, except for this scale the values for internal consistency are below social science stan-dards, indicating that the internal consistency of the indices built around the factor analysis is rather low. Still, we com-pute indices for the five factors with the highest loading task items (highlighted).
The resulting operationalization differs from the opera-tionalization of task domains by existing theory and research practice (see col. 3 in Table4).
4.3 Criterion validation of task items
is not at all straightforward. As demonstrated in the previous section, the two strategies identified in the literature lead to different operationalizations. For this reason, we empirically evaluate single task items by analyzing the items’ criterion validity. Table6gives the results.
First, we find that task variables 1 through 11 (for num-bers see Table5, column 1) are negatively signed and highly correlated (statistically significant if not stated otherwise) with manual and routine skill requirements but positively related to computer use.25Thereby, the tasks explain com-parably high shares of variances in the routine measures (up to 10,5 percent in the case of investigating). Thus, it is highly valid to classify these tasks as non-routine cog-nitive. Unfortunately, we do not have measures for separat-ing analytic from interactive tasks. However, it seems rea-sonable to classify variables investigating, organizing, re-searching, programming, and applying law (no. 1–5) as “an-alytic” and variables teaching, consulting, buying, promot-ing, managpromot-ing, and negotiating (no. 6–11) as “interactive.” Second, consistent with the classification by existing the-ory and research practice for the non-routine manual do-main, task variables repairing, accomodating, caring and protecting (no. 12–14 and 16) are positively related to man-ual skill requirements (with comparatively high shares of ex-plained variances) and negatively correlated with routine re-quirements. On the contrary, cleaning (no. 15) is positively correlated with our external measure for routine activities. Cleaning and the other four items are negatively linked to computerization, signaling that these activities are not char-acterized by computer activities. This hints that computers might at least not complement for these tasks as their usage decreases with the occurance of the items.
Third, in contradiction to the classification developed by existing theory and research practice, measuring, writing, and calculating (no. 17–19) are not valid measures for rou-tine cognitive tasks; rather, our results suggest that they are measures for non-routine activities. Admittedly, in the case of measuring, the explained variance for routine measures is very low (below .01). Writing and calculating are surveyed only until the 1991/92 data collection. Their positive cor-relation with computer activities could be interpreted as ei-ther complementary or substitutionary effects. Measuring is not only inconsistently correlated with computer tasks, but also positively related to manual skill requirements. Alto-gether, the criterion validation demonstrates that the mean-ing of measurmean-ing changes throughout the rounds; classifymean-ing this task variable as a measure for routine cognitive tasks— as it is suggested by existing theory—is not supported by the criterion validation. An inspection of educational groups
25The only exception is that buying is negatively related to computer in 2006.
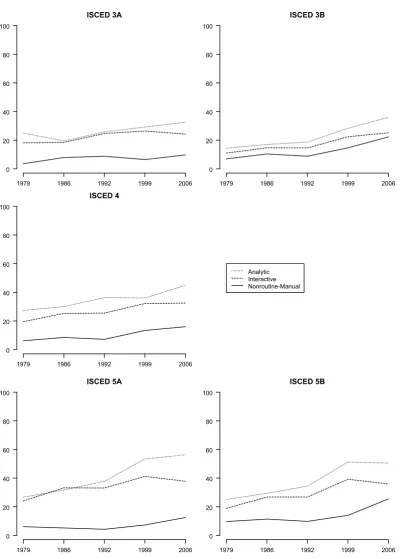
reveals (seeAppendix Fig. 1) that measuring is more of-ten performed by workers with high-skilled vocational de-grees (ISCED 5B), suggesting that it rather measures a non-routine cognitive task.
Fourth, operating, manufacturing, and storing are sup-posed to be measures of routine manual tasks, according to research practice. Except for operating and storing in 1991/92, these task variables are actually comparatively strongly associated with manual skill requirements but only weakly with routine and computer skills. Again, the incon-sistent direction of their correlation with routine and com-puter indicates that the meaning of the task measures may be changing over time.
Over and above these results, the criterion validation re-veals that with regard to the problematic classification into routine and nonroutine tasks, only cognitive (analytic and interactive) nonroutine tasks are validly measured. For all other task variables the explained variance in the routine variable is low.
In sum, the criterion validation leads to a slightly differ-ent operationalization than the statistical and theory-based classifications (see last column in Table4). In the next sec-tion, we explore the differences between the three opera-tionalizations empirically.
5 Task change in Germany
This section compares the three operationalizations through a sensitivity analysis. We elaborate on whether all three lead to similar conclusions on task change in Germany or whether the results depend on the task measures used in the analysis.
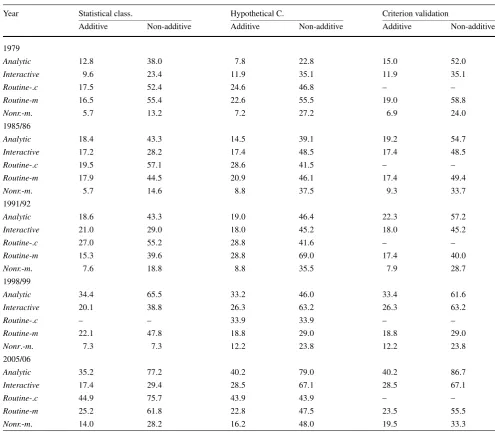
Table7 outlines the results for task-based change from 1979 to 2006 within the West German population aged 15 to 65, measured as additive and non-additive indices based on the three different operationalizations, respectively.
First, as suggested by the ALM hypothesis, analytic tasks consistently increase over each cross-section for all three measures. Similarly, interactive tasks increase when items are classified according to existing theory or the criterion validation, and when the indices are computed additively. The statistical classification of interactive tasks (i.e. factor 3 in Table3) only includes buying, promoting and negotiat-ing (but excludes teachnegotiat-ing, consultnegotiat-ing, and managnegotiat-ing) and negotiating is only sporadically observable (see Table3).
Table 6 Criterion validation of task items
Variable number and name Sign and average variance explainedaof task variable onb. . .
manual routine computer
Sign of assoc.
Var. ex-plained
Sign of assoc.
Var. ex-plained
Sign of assoc.
Var. ex-plained
1 investigating − .046 − .105 + .043
2 organizing − .013 − .094 + .027
3 researching − .008 − .063 + .021
4 programming − .078 − .030 + .208
5 applying law − .018 − .022 + .013
6 teaching − .007 − .061 + .003
7 consulting − .028 − .082 + .011
8 buying − .019 − .010 +(‘06−) .001
9 promoting − .013 − .020 + .004
10 managing − .006 − .071 + .018
11 negotiaing − .022 − .062 + .025
12 repairing + .146 − .003 − .008
13 accomodating +3 .004 −(‘06+) .000 − .006
14 caring +c .005 −(‘06+) .004 − .007
15 cleaning + .049 + .021 − .018
16 protecting + .013 − .003 ‘79+; ‘06− .002
17 measuring + .057 −(‘06 n.s.) .007 ’79+,’99 n.s., ‘06− .005
18 writing − .087 − .031 + .056
19 calculating − .038 − .033 + .047
20 operating + .093 +(‘79 n.s.) .004 −(‘79, 85/6+) .005
21 manufacturing + .125 + .004 − .021
22 storing + .036 +(‘92−) .018 −(‘92+) .017
Notes:aThe table summarizes results of separate survey year regressions of task measures on the criterion variables. If not explicitly stated for single years, the association are at least statistically significant at thep≤.05-level and have the reported signs in all separate regressions. “−” signifies a stat. sig. negative association with the criterion variable, “+” signifies a stat. sig. positive association with the criterion variable.bFor detailed variable description see Sect.3.3and Table8in theAppendix.cDeviating from the operationalization as shown in Table7, manual only includes “working standing”. Sample is restricted to people from the western part of Germany belonging to the labor force (defined as having a paid work) aged 15 to 65, with a regular working time of at least ten hours per week. Source: BIBB/IAB—BIBB/BAuA Employment Surveys 1979–2006, weighted values, own calculations
Third, challenging the routinization hypothesis, none of the indices show a constant decline in routine cognitive tasks. Rather, the domain of cognitive routine tasks increases over time. Based on these results, we could (probably) mis-leadingly conclude that workers in Germany today perform more routine tasks than in the 1970s. This finding strongly deviates from the outcome suggested by the routinization hypothesis. However, our criterion validation suggests that researchers must be careful in classifying cognitive routine tasks in the German database. In our view, the criterion val-idation instead supports the view that the data does not suf-ficiently measure routine cognitive tasks over time. At least, we should be careful not to overemphasize the importance of observed changes in routine cognitive tasks.
Fourth, as with the contradicting results for cognitive rou-tine tasks, manual rourou-tine tasks do not decline consistently
Table 7 Task-based change by different measures
Year Statistical class. Hypothetical C. Criterion validation
Additive Non-additive Additive Non-additive Additive Non-additive
1979
Analytic 12.8 38.0 7.8 22.8 15.0 52.0
Interactive 9.6 23.4 11.9 35.1 11.9 35.1
Routine-.c 17.5 52.4 24.6 46.8 – –
Routine-m 16.5 55.4 22.6 55.5 19.0 58.8
Nonr.-m. 5.7 13.2 7.2 27.2 6.9 24.0
1985/86
Analytic 18.4 43.3 14.5 39.1 19.2 54.7
Interactive 17.2 28.2 17.4 48.5 17.4 48.5
Routine-.c 19.5 57.1 28.6 41.5 – –
Routine-m 17.9 44.5 20.9 46.1 17.4 49.4
Nonr.-m. 5.7 14.6 8.8 37.5 9.3 33.7
1991/92
Analytic 18.6 43.3 19.0 46.4 22.3 57.2
Interactive 21.0 29.0 18.0 45.2 18.0 45.2
Routine-.c 27.0 55.2 28.8 41.6 – –
Routine-m 15.3 39.6 28.8 69.0 17.4 40.0
Nonr.-m. 7.6 18.8 8.8 35.5 7.9 28.7
1998/99
Analytic 34.4 65.5 33.2 46.0 33.4 61.6
Interactive 20.1 38.8 26.3 63.2 26.3 63.2
Routine-.c – – 33.9 33.9 – –
Routine-m 22.1 47.8 18.8 29.0 18.8 29.0
Nonr.-m. 7.3 7.3 12.2 23.8 12.2 23.8
2005/06
Analytic 35.2 77.2 40.2 79.0 40.2 86.7
Interactive 17.4 29.4 28.5 67.1 28.5 67.1
Routine-.c 44.9 75.7 43.9 43.9 – –
Routine-m 25.2 61.8 22.8 47.5 23.5 55.5
Nonr.-m. 14.0 28.2 16.2 48.0 19.5 33.3
Notes: Sample is restricted to people from the western part of Germany belonging to the labor force (defined as having a paid work) aged 15 to 65, with a regular working time of at least ten hours per week. Source: BIBB/IAB—BIBB/BAuA Employment Surveys 1979–2006, weighted values, own calculations
Altogether, our sensitivity analysis demonstrates that dif-ferent classifications of tasks into the domains proposed by ALM lead to different conclusions on task change in Ger-many. To a certain extent, findings depend on the opera-tionalization of task variables.
6 Summary and conclusions
The paper demonstrates that the German task data differ in a substantial way from DOT, O*NET and PDII, databases that have been used for analyses on the task approach primarily in the U.S. but also in other countries. Beyond these
analy-ses, our paper describes broad changes in the data collection, survey population, and study content between survey waves. These changes also pertain to the task items; the content and wording of survey questions, the response categories, and the number of task items surveyed changed throughout the cross-sections. In conclusion, the process of classifying sin-gle tasks into distinct domains leads to a number of prob-lems.