R E S E A R C H
Open Access
Estimating average alcohol consumption in
the population using multiple sources: the
case of Spain
Luis Sordo
1,2,3, Gregorio Barrio
4*, María J. Bravo
1,2, Joan R. Villalbí
5, Albert Espelt
2,5, Montserrat Neira
6and Enrique Regidor
2,3Abstract
Background:National estimates on per capita alcohol consumption are provided regularly by various sources and may have validity problems, so corrections are needed for monitoring and assessment purposes. Our objectives were to compare different alcohol availability estimates for Spain, to build the best estimate (actual consumption), characterize its time trend during 2001–2011, and quantify the extent to which other estimates (coverage) approximated actual consumption.
Methods:Estimates were: alcohol availability from the Spanish Tax Agency (Tax Agency availability), World Health Organization (WHO availability) and other international agencies, self-reported purchases from the Spanish Food Consumption Panel, and self-reported consumption from population surveys. Analyses included calculating: between-agency discrepancy in availability, multisource availability (correcting Tax Agency availability by
underestimation of wine and cider), actual consumption (adjusting multisource availability by unrecorded alcohol consumption/purchases and alcohol losses), and coverage of selected estimates. Sensitivity analyses were undertaken. Time trends were characterized by joinpoint regression.
Results:Between-agency discrepancy in alcohol availability remained high in 2011, mainly because of wine and spirits, although some decrease was observed during the study period.
The actual consumption was 9.5 l of pure alcohol/person-year in 2011, decreasing 2.3 % annually, mainly due to wine and spirits. 2011 coverage of WHO availability, Tax Agency availability, self-reported purchases, and self-reported consumption was 99.5, 99.5, 66.3, and 28.0 %, respectively, generally with downward trends (last three estimates, especially self-reported consumption). The multisource availability overestimated actual consumption by 12.3 %, mainly due to tourism imbalance.
Conclusions:Spanish estimates of per capita alcohol consumption show considerable weaknesses. Using uncorrected estimates, especially self-reported consumption, for monitoring or other purposes is misleading. To obtain conservative estimates of alcohol-attributable disease burden or heavy drinking prevalence, self-reported consumption should be shifted upwards by more than 85 % (91 % in 2011) of Tax Agency or WHO availability figures. The weaknesses identified can probably also be found worldwide, thus much empirical work remains to be done to improve estimates of per capita alcohol consumption.
Keywords:Alcohol, Data sources, Availability, Sales, Purchases, Consumption, Self-report, Population surveys, Underestimation
* Correspondence:gbarrio@isciii.es
4National School of Public Health, Carlos III Health Institute, Avenida
Monforte de Lemos 5, E-28029 Madrid, Spain
Full list of author information is available at the end of the article
Background
Per capita or average population alcohol consumption is a key indicator of alcohol exposure which reflects future volume and trends in alcohol-related problems and is es-sential to calculate the burden of alcohol-attributable disease. Thus, valid and comparable per capita con-sumption estimates are required to formulate and assess alcohol-related policies [1–6]. Estimates are usually selected from various sources at different stages of the distribution process from the time the beverages are available on the market for human consumption and actual consumption by the resident population. Conse-quently, important threats to their validity and compar-ability exist. For example, recorded alcohol sales based on excise duties on alcoholic beverages from national sources are generally regarded as the most valid proxy of per capita alcohol consumption in Western countries [1, 7–11]. However, in some countries like Spain, wine is exempt from excise duty. Moreover, this proxy mainly includes legal wholesale alcohol sales, which occur at the beginning of the marketing process and therefore do not adequately reflect alcohol consumption by residents. Thus, it must be corrected or adjusted to account for un-taxed beverages, unrecorded alcohol sales, alcohol losses, and the balance of consumption/purchases by inter-national visitors. Correction algorithms generally are not internationally standardized, are sometimes not even ex-plicit, and are based on many parameters that require em-pirical data, which are often lacking and must be assumed or extrapolated from elsewhere [1, 6, 12–15]. Despite these threats to validity, the process by which individual countries make these estimates has rarely been assessed, nor have estimates from various sources been systematic-ally compared.
Population surveys generally provide the prevalence of self-reported consumption of specified amounts of alcohol by different variables, which can be used directly for moni-toring purposes and intervention assessment, or indirectly to estimate the burden of alcohol-attributable disease. However, surveys often largely underestimate per capita consumption derived from alcohol sales, often covering only 30–65 % of actual consumption [1, 7, 9, 14, 16–19], with spatiotemporal variations in coverage even when the same survey is used [6]. Thus, for some purposes, such as estimating the alcohol-attributable disease burden, self-reported consumption figures need to be shifted upwards. The elevation factor could be extrapolated from elsewhere, but given the between-country heterogeneity in survey methods, non-response rate, and context, it would be more appropriate to calculate this figure and update it regularly in each country.
The objectives of this study were to compare different es-timates of alcohol availability in Spain during 2001–2011, build the best per capita consumption estimate (actual
consumption), characterize trends over time, and quantify the extent to which actual consumption was approximated by other estimates, especially those based on self-reported data (coverage).
Methods Data collection
Aggregate data were extracted from multiple sources. The Spanish Tax Agency (Tax Agency), Eurostat, World Health Organization (WHO), and Food and Agriculture Organization (FAO) provided data on alcohol sales/ supplies; specifically, volumes or quantities of alcoholic beverages (those with >1.2 % alcohol-by-volume or ABV) available or intended for direct human consumption or to be drunk within Spain through legal distribution channels (alcohol availability). According to metadata included in the WHO data repository on recorded per capita alcohol consumption, Spanish WHO data for most of the study period were based on sales and taxation data, so they probably came ultimately from the Tax Agency. However, WHO and the Tax Agency were considered separately, be-cause the immediate specific source of each WHO annual estimate was not explicit. Thus, there may have been intermediate Spanish administrative bodies between the Tax Agency and WHO that were involved in the prepar-ation and submission of data, which in turn may have been inconsistent over time. The Spanish Food Consumption Panel of the Agriculture Ministry (PCA) provided data on the direct demand for alcohol; specifically, self-reported volume of alcoholic beverages purchased at retail within Spain for off- and on-premises consumption (self-reported purchases). The main data related to international visitors came from the Spanish Tourism Institute (i.e., arrivals and departures of tourists and same-day visitors, tourists’ length of stay), WHO (i.e., recorded per capita alcohol con-sumption by country), Eurostat, World Bank, and the scientific literature (Additional file 1). Other aggregate data were retrieved from the scientific literature; specifically, some data to estimate unrecorded alcohol consumption (alcohol consumed by Spanish residents but not included in routine statistics – such as smuggled and surrogate alcohol from informal sales or production, from products with ≤1.2 % ABV, and consumed/purchased by Spanish residents visiting abroad), alcohol losses (alcohol spilled, spoiled, or wasted, e.g., unfinished drinks, or used for cook-ing or purposes other than direct human consumption), and the alcohol consumed/purchased by foreign visitors in Spain [2, 13, 14, 18, 20–22].
Finally, Spanish National Health Surveys (ENS) and the European Health Survey in Spain provided individu-alized self-reported data on quantity and frequency (QF) of alcoholic beverages consumed anywhere in the last 12 months by household residents in Spain aged ≥15 (self-reported consumption) (Additional file 2). However,
the Household Survey on Alcohol and Drugs in Spain (EDADES) could not be used because it only includes people aged 15–64.
Data analysis
First, beverage categories and units of alcohol were ho-mogenized. Beverages were stratified as beer, wine, and other beverages; the latter heterogeneous category in-cluding spirits or distilled beverages, aperitifs, or inter-mediate products (beverages 1.2–22 % ABV other than fermented ones) and cider, due to differences between sources in beverage categorization. Details are included in Additional file 1. Alcohol amount was always ex-pressed in liters of pure alcohol per person-year (lpa/py), using official mid-year populations. Beverage mass was converted into volume by dividing by beverage density. Following WHO recommendations [1], beverage vol-umes were converted into lpa by applying percentages of ABV proposed by the Tax Agency: beer, cider, and wine-based mixtures (5.5 %), wine (11.5 %), aperitifs (15 %), and spirits (35 %) [23]. Between-agency variability or dis-crepancy in alcohol availability was measured using the between-agency range (difference between the highest and lowest estimate) and the between-agency coefficient of variation (CV) calculated as the ratio of the standard deviation to the mean multiplied by 100 [24]. This is a dimensionless measure of relative discrepancy, which allows comparisons of the between-agency discrepancy of different estimates of alcohol availability (i.e., by calendar year or beverage category) regardless of the estimate size.
To obtain actual alcohol consumption, a multistage process starting from the Tax Agency availability was followed. Tax Agency availability was estimated by add-ing the alcohol from beverage sales subject to excise duty on alcohol (beer, spirits, and aperitifs) and the alco-hol from wine purchases self-reported to PCA. Thus, it does not include cider, and it is likely that self-reported wine purchases represent an important underestimation of wine sales, as in 2001–2011 self-reported purchases of beer and other beverages underestimated Tax Agency recorded sales by 43 and 45 %, respectively. Therefore, a multisource availability indicator was built by replacing the wine component in Tax Agency availability with the Eurostat wine supply and adding the FAO cider supply. Finally, actual consumption was obtained by adding the alcohol consumed/purchased abroad by residents in Spain and other unrecorded alcohol consumption, and subtracting alcohol losses and the alcohol consumed/ purchased in Spain by foreign visitors (Additional files 3, 4, and 5). A sensitivity analysis was made varying as-sumptions in the calculation algorithms.
Self-reported consumption was obtained from individ-ualized data on alcoholic beverages using the basic QF
approach [25] (Additional file 2). Given the scarcity of updated empirical data [26], the alcohol content in standard drinks in Spain was estimated by applying the above mentioned percentages of ABVs to standard drink volumes in the high range of those included in drinking guidelines [27, 28]; the resulting amount of pure alcohol in grams (g) was 10.9 (beer, cider), 11.4 (wine), 11.8 (aperitifs), and 16.6 (spirits, spirits cocktails). A standard drink of local beverages was assumed to contain 10 g. A sensitivity analysis was performed by applying the alcohol contents suggested in ENS reports: 10, 10, 20, 20 and 10 g for beer, cider, aperitifs, spirits, and local beverages, re-spectively [29]. Survey estimates were weighted to account for strata oversampling or imbalance according to sex, age group, region, household size, nationality (Spanish/for-eigner), and response rate. Confidence intervals at 95 % (95 % CI) were calculated accounting for the sampling de-sign effect, which was calculated for the 2011 survey and applied to correct sampling variances in other surveys.
Coverage of Tax Agency availability, self-reported pur-chases and self-reported consumption was calculated as a ratio, with actual consumption as denominator and expressed as a percent. To identify linear time trends and significant changes in trends (joinpoints), various join-point regression models were used, allowing calculation of the average annual percent change (AAPC) for the entire period 2001–2011 and, if joinpoints, the annual percent change (APC) for each linear segment. AAPC and APC express the intensity and direction of the trend [30].
Results
Between-agency comparison in alcohol availability There were significant decreases during 2001–2011 in total alcohol availability as calculated from Tax Agency and FAO data (AAPC range: −3.1–2.4), but not in that from WHO (AAPC =−0.9). There were significant de-creases in wine availability from all agencies (APPC range: −8.0–4.8), upward or stable trends for beer avail-ability (APPC range: 0.4–1.5), and mixed trends for other beverages. Tax Agency and WHO estimates were almost the same for wine in each year of the period, and for beer and other beverages from 2005 onwards.
(AAPC: −9.5). Moreover, for wine, a joinpoint from a non-significant upward trend towards a non-significant downward trend was identified at 2006.
The between-agency CV in the entire period 2001–2011 was 4.8 % (total alcohol), 1.0 % (beer), 15.0 % (wine), and 41.5 % (other beverages). CVs by calendar year and bever-age category are shown in Fig. 2. Regarding trends, the joinpoint analysis shows significant linear trends in CV for other beverages (AAPC:−2.3), and wine (APPC: 10.0), al-though for wine, a joinpoint from a significant upward trend towards a non-significant downward trend was identified at 2008. The downward trend for total alcohol did not reach statistical significance.
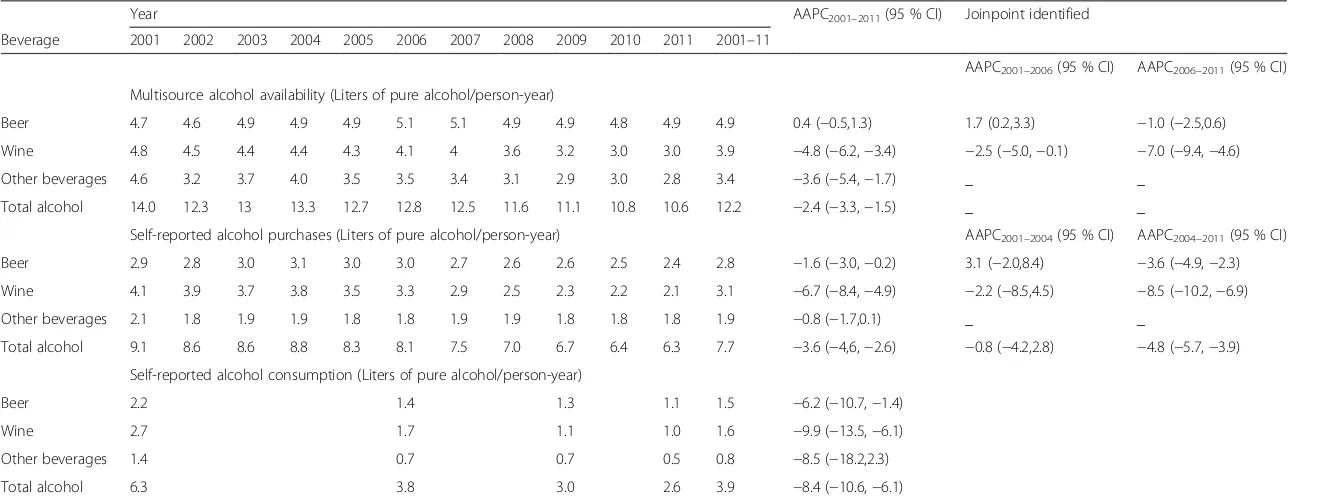
Self-reported purchases and self-reported consumption Self-reported alcohol purchases and consumption were 6.3 lpa/py and 2.6 lpa/py (95 % CI: 2.6, 2.7), respectively,
in 2011. Self-reported purchases showed significant de-creases for total alcohol, beer and wine; joinpoints were identified at 2004, with significant decreases in subse-quent years. Significant decreases were also observed in self-reported consumption for total alcohol, beer, and wine, and these were much stronger than for self-reported purchases (Table 2). By using the standard drink units proposed in ENS reports, similar self-reported consumption estimates in 2011 were obtained (2.5 lpa/py; 95 % CI: 2.5, 2.6).
Estimating multi-source availability and actual per capita consumption
Multi-source availability for total alcohol was 10.6 lpa/py in 2011, with significant decreases observed for total alcohol, wine, and other beverages in 2001–2011; joinpoints were identified at 2006 which showed an
Table 1Alcohol availability estimates from different agencies and between-agency range by beverage category, Spain, 2001–2011
Agency Beverage Year AAPC2001–2011
(95 % CI) 2001 2002 2003 2004 2005 2006 2007 2008 2009 2010 2011 2001–11
Alcohol availability (liters of pure alcohol/person-year)
Tax Agency Beer 4.7 4.6 4.9 4.9 4.9 5.1 5.1 4.9 4.9 4.8 4.9 4.9 0.4 (−0.5,1.3)
Wine 4.0 3.8 3.6 3.6 3.4 3.2 2.5 2.2 2.1 2.0 1.8 2.9 −8.0 (−10.4,−5.6)
Other beverages
4.5 3.1 3.7 4.0 3.5 3.5 3.4 3.1 2.9 2.9 2.7 3.4 −3.7 (−5.6,−1.7)
Total alcohol 13.1 11.5 12.2 12.6 11.8 11.8 11 10.2 9.9 9.7 9.4 11.1 −3.1 (−4.0,−2.1)
World Health Organization Beer 4.4 4.2 4.5 4.5 5.0 5.2 5.1 4.9 5.0 4.9 4.9 4.8 1.5 (0.1,3.0)
Wine 3.9 4.0 3.7 3.8 3.4 3.2 2.6 2.2 2.1 2.0 1.8 2.9 −7.9 (−10.4,−5.3)
Other beverages
2.8 1.8 2.0 2.1 3.5 3.5 3.4 3.1 2.9 2.9 2.7 2.8 3.3 (−1.4,8.2)
Total alcohol 11.1 9.9 10.2 10.4 11.9 11.9 11.1 10.2 10.0 9.8 9.4 10.6 −0.9 (−3.4,1.6)
Eurostat Wine 4.8 4.5 4.4 4.4 4.3 4.1 4.0 3.6 3.2 3.0 3.0 3.9 −4.8 (−6.2,−3.4)
Food and Agriculture Organization
Beer 4.6 4.7 5.0 5.1 4.8 5.1 5.1 4.9 4.9 4.8 4.8 4.9 0.5 (−0.8, 1.7)
Wine 4.7 4.5 4.8 4.9 4.7 4.9 3.6 3.9 2.9 3.2 2.3 4.0 −6.3 (−10.1,−2.4)
Other beverages
1.1 1.1 1.1 1.1 1.0 1.0 1.0 1.0 1.0 1.0 1.0 1.0 −1.2 (−1.8,−0.6)
Total alcohol 10.4 10.3 11.0 11.0 10.5 11.0 9.7 9.8 8.8 9.0 8.1 9.9 −2.5 (−4.0,−0.9)
Between-agency range in alcohol availability (liters of pure alcohol/person-year)
Beer 0.2 0.5 0.6 0.6 0.2 0.0 0.1 0.0 0.1 0.1 0.0 0.1
Wine 0.9 0.7 1.3 1.3 1.2 1.7 1.4 1.6 1.1 1.3 1.2 1.1
Other beverages
3.4 2.0 2.6 2.9 2.5 2.5 2.4 2.1 1.9 2.0 1.7 2.3
Total alcohol 2.8 1.6 1.9 2.1 1.4 0.8 1.3 0.5 1.2 0.8 1.3 1.2
Liters of pure alcohol/person-year: Calculated by multiplying the annual beverage volume in liters by the ABV percentage of each beverage [beer, cider, wine-based mixtures (5.5 %), wine (11.5 %), aperitifs (15 %), and spirits (35 %)] and dividing by official mid-year population aged≥15. AAPC2001–2011: Average annual percent change
during 2001–2011 from joinpoint regression
Tax Agency:“Other beverages”includes spirits and aperitifs (beverages 1.2–22 % ABV other than fermented ones, such as vermouth, sherry, or port). Beer, spirits, and aperitif estimates were calculated by dividing the receipts from excise duties on each beverage between the weighted average tax rate applicable, and wine estimate was obtained directly from purchases self-reported to the Spanish Food Consumption Panel
Word Health Organization: Includes“recorded alcohol”figures from the Global Information System on Alcohol and Health.“Other beverages”includes spirits, aperitifs, and cider. 2011 data were imputed from the Spanish Tax Agency
Food and Agriculture Organization:“Wine”includes wine and aperitifs.“Other beverages”includes spirits and cider
Between-agency range was obtained as the difference between the highest and lowest agency estimate of alcohol availability
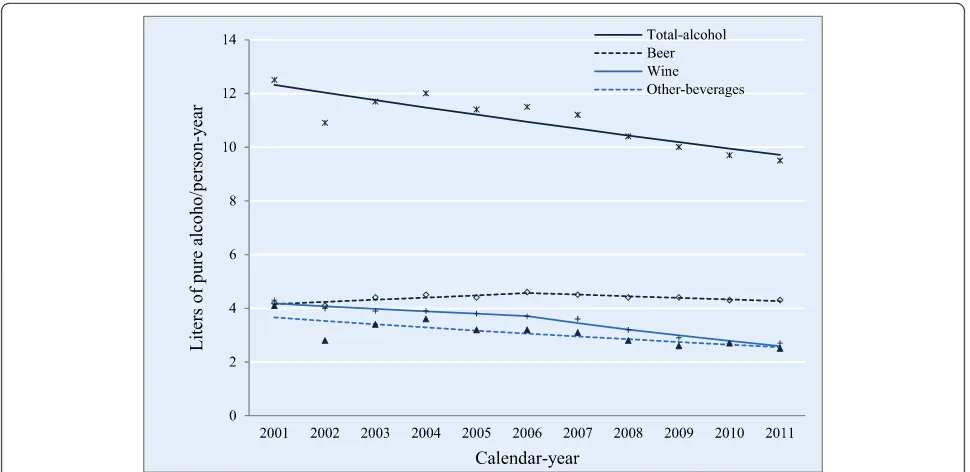
Fig. 1Per capita alcohol availability by agency and beverage category, Spain, 2001–2011 (Liters of pure alcohol/person-year). Footnotes:Other beveragesinclude spirits, cider, and aperitifs (beverages 1.2–22 % alcohol-by-volume other than fermented ones, such as vermouth, sherry or port).
Tax AgencySpanish Tax Agency,WHOWorld Health Organization,FAOFood and Agriculture Organization
Fig. 2Between-agency coefficient of variation for per capita alcohol availability by beverage category and calendar year, Spain, 2001–2011. Footnotes: Thecoefficient of variation (CV)was calculated as follows: CV = (σ/μ)100, whereσwas the between-agency standard deviation and
μthe arithmetic mean of per capita alcohol availability.σwas calculated asσ=
ffiffiffiffiffiffiffiffiffiffiffiffiffiffiffiffiffiffiffiP
xiμ
ð Þ2
½
N
q
, where xiis each agency estimation and N is the
Table 2Multisource alcohol availability, self-reported purchases, and self-reported consumption by beverage category, Spain, 2001–2011
Year AAPC2001–2011(95 % CI) Joinpoint identified
Beverage 2001 2002 2003 2004 2005 2006 2007 2008 2009 2010 2011 2001–11
AAPC2001–2006(95 % CI) AAPC2006–2011(95 % CI)
Multisource alcohol availability (Liters of pure alcohol/person-year)
Beer 4.7 4.6 4.9 4.9 4.9 5.1 5.1 4.9 4.9 4.8 4.9 4.9 0.4 (−0.5,1.3) 1.7 (0.2,3.3) −1.0 (−2.5,0.6)
Wine 4.8 4.5 4.4 4.4 4.3 4.1 4 3.6 3.2 3.0 3.0 3.9 −4.8 (−6.2,−3.4) −2.5 (−5.0,−0.1) −7.0 (−9.4,−4.6)
Other beverages 4.6 3.2 3.7 4.0 3.5 3.5 3.4 3.1 2.9 3.0 2.8 3.4 −3.6 (−5.4,−1.7) _ _
Total alcohol 14.0 12.3 13 13.3 12.7 12.8 12.5 11.6 11.1 10.8 10.6 12.2 −2.4 (−3.3,−1.5) _ _
Self-reported alcohol purchases (Liters of pure alcohol/person-year) AAPC2001–2004(95 % CI) AAPC2004–2011(95 % CI)
Beer 2.9 2.8 3.0 3.1 3.0 3.0 2.7 2.6 2.6 2.5 2.4 2.8 −1.6 (−3.0,−0.2) 3.1 (−2.0,8.4) −3.6 (−4.9,−2.3)
Wine 4.1 3.9 3.7 3.8 3.5 3.3 2.9 2.5 2.3 2.2 2.1 3.1 −6.7 (−8.4,−4.9) −2.2 (−8.5,4.5) −8.5 (−10.2,−6.9)
Other beverages 2.1 1.8 1.9 1.9 1.8 1.8 1.9 1.9 1.8 1.8 1.8 1.9 −0.8 (−1.7,0.1) _ _
Total alcohol 9.1 8.6 8.6 8.8 8.3 8.1 7.5 7.0 6.7 6.4 6.3 7.7 −3.6 (−4,6,−2.6) −0.8 (−4.2,2.8) −4.8 (−5.7,−3.9)
Self-reported alcohol consumption (Liters of pure alcohol/person-year)
Beer 2.2 1.4 1.3 1.1 1.5 −6.2 (−10.7,−1.4)
Wine 2.7 1.7 1.1 1.0 1.6 −9.9 (−13.5,−6.1)
Other beverages 1.4 0.7 0.7 0.5 0.8 −8.5 (−18.2,2.3)
Total alcohol 6.3 3.8 3.0 2.6 3.9 −8.4 (−10.6,−6.1)
Liters of pure alcohol/person-year: Calculated by multiplying the annual beverage volume in liters by the percent ABV of each beverage [beer, cider, wine-based mixtures (5.5 %), wine (11.5 %), aperitifs (15 %), and spirits (35 %)] and dividing by official mid-year population aged≥15
Other beverages: Spirits, aperitifs, and cider
Multisource alcohol availability: Wine figures from the Spanish Tax Agency were replaced by Eurostat wine retail supplies, and FAO cider supplies were added
Self-reported alcohol purchases: Self-reported alcoholic beverages purchased at retail within Spain for off- and on-premises consumption, from the Spanish Food Consumption Panel. Wine-based mixtures were grouped with wine
Self-reported alcohol consumption: Based on individualized data from Spanish National Health Surveys (2001, 2006 and 2011) and the European Health Survey in Spain (2009), assuming a certain volume for the standard drink of each beverage category in the survey (See details in Additional file2)
AAPC2001–2011(95 % CI): Average annual percent change (confidence interval at 95 %) for 2001–2011 from joinpoint regression APC (95 % CI): Annual percent change (confidence interval at 95 %) for the period in subscript when a joinpoint was identified
Sordo
et
al.
Population
Health
Metrics
(2016) 14:21
Page
6
of
increasing trend followed by stability in the case of beer, and acceleration of the decreasing trend for wine (Table 2). Estimates for unrecorded alcohol, alcohol losses, and alcohol consumed/purchased by Spanish residents visiting abroad and foreign visitors in Spain were, respectively, 0.6, 0.9, 0.3, and 1.1 lpa/py (Additional file 4). The latter esti-mate represented 9.8 % of alcohol consumed/purchased in Spain in 2011.
Actual per capita consumption in 2011 under inter-mediate assumptions was 9.5 lpa/py, ranging from 8.6 to 10.4 lpa/py under different assumptions. Significant de-creases in intermediate estimates of actual consumption were observed in 2001–2011 for total alcohol (AAPC: −2.3), wine (AAPC: −4.6), and other beverages (AAPC: −3.5). Joinpoints were identified at 2006 from increasing to stability (beer) and from stability to decreasing (wine) (Table 3, Fig. 3). These trends resulted in changes in the beverage-specific contribution to total alcohol consump-tion between 2001 and 2011 from 33 to 46 % (beer), 34 to 28 % (wine), and 33 to 26 % (other beverages).
Coverage of selected indicators compared to per capita consumption
In 2011 coverage of Tax Agency availability, self-reported purchases and self-self-reported alcohol consump-tion compared to the intermediate estimate of actual consumption was, respectively, 99.5, 66.3, and 28.0 % (95 % CI: 27.1, 28.9), with significant decreases over time in the coverage of the three indicators, especially in the latter. Regarding beverages, coverage of Tax Agency availability showed significant decreases for wine, cover-age of self-reported purchases for wine and beer, and coverage of self-reported consumption for all bever-age categories. Moreover, coverbever-age of self-reported purchases showed a significant increase for other beverages. A joinpoint at 2004 from stability toward a downward trend was observed for beer purchases. Self-reported indicators (purchases and consumption), showed higher coverage for wine than for beer and other beverages, while the opposite occurred with Tax Agency availability (Table 3).
WHO availability coverage was 99.5 % in 2011, showing a significant increase over time. Multi-source availability overestimated actual per capita consumption by 12.3 % (range: 2.5–24.1 %). In sensitivity analyses using standard drink units proposed in ENS reports, self-reported consumption coverage for total alcohol, wine, beer, and other beverages was 26.8, 32.5, 24.2, and 25.1 %, respectively. Considering both random variability (95 % CI) in the numerator and the uncertainty of assumptions derived from sensitivity analyses in numer-ator and denominnumer-ator, the self-reported consumption coverage for total alcohol would range from 23.8 to 32.0 %.
Discussion Main findings
Between-agency discrepancy in alcohol availability esti-mates remained substantial in 2011, mainly because of other beverages (primarily spirits) and wine, although some decrease could be observed during 2001–2011. Actual per capita consumption was 9.5 l of pure alcohol per person-year in 2011, decreasing 2.3 % annually in 2001–2011, mainly due to decreases in wine and other beverages. The coverage of WHO availability, Tax Agency availability, self-reported purchases, and self-reported con-sumption compared to actual concon-sumption was, respect-ively, 99.5, 99.5, 66.3, and 28.0 % in 2011, with downward time trends in the last three estimates, especially for self-reported consumption, and an upward trend in WHO availability. Multisource availability involved an over-estimation of 12.3 %, mainly due to tourism imbalance.
Considerable between-agency discrepancy in alcohol availability
The study shows that in 2011 the between-agency discrepancy in per capita alcohol availability estimates remained high. Thus, the between-agency range and CV for total alcohol were 1.3 lpa/py, and 6.8 %, respectively. This probably was mainly due to excessively low estimates for wine (Tax Agency and WHO) and spirits (FAO). Important discrepancies may also exist elsewhere [1]. In fact, in 2010 in France, Italy, Greece, and Portugal, the between-agency CVs of availability esti-mates considering WHO, FAO, and Eurostat varied be-tween 3.5 and 14.8 % (total alcohol), 3.2–12.4 % (beer), 3.0–19.0 % (wine) and 8.7–45.6 % (other beverages). This situation is worrisome because alcohol availability is often the standard indicator in spatiotemporal com-parisons of alcohol consumption [1, 31].
The absolute discrepancy in total alcohol availability (as measured by the range) showed an average annual decline of 9.5 % during 2001–2011, although this decline is partly explained by the declining availability. Thus, when CV was used as the measure of relative discrep-ancy, the decrease was not statistically significant for total alcohol, although it was for other beverages.
Clear decrease in per capita alcohol consumption
Table 3Actual per capita alcohol consumption and coverage of different indicators by beverage category, Spain, 2001–2011
Year
2001 2002 2003 2004 2005 2006 2007 2008 2009 2010 2011 2001–2011 AAPC2001–2011(95 % CI) Joinpoint identified
APC2001–2006(95 % CI) APC2006–2011(95 % CI)
Actual per capita alcohol consumption (Liters of pure alcohol/person-year)
Beer 4.2 4.1 4.4 4.5 4.4 4.6 4.5 4.4 4.4 4.3 4.3 4.4 0.3 (−0.6,1.2) 1.9 (0.3,3.5) −1.3 (−2.9,0.2)
Wine 4.3 4 3.9 3.9 3.8 3.7 3.6 3.2 2.9 2.7 2.7 3.5 −4.6 (−6.0,−3.2) −2.4 (−4.9,0.2) −6.9 (−9.2,−4.4)
Other beverages 4.1 2.8 3.4 3.6 3.2 3.2 3.1 2.8 2.6 2.7 2.5 3.1 −3.5 (−5.5,−1.5) _ _
Total alcohol 12.5 10.9 11.7 12 11.4 11.5 11.2 10.4 10 9.7 9.5 10.9 −2.3 (−3.3,−1.4) _ _
Coverage of Tax Agency availability (%)
Beer 111.5 112.7 111 111.1 112 111.7 111.6 111.5 111.5 111.3 112.3 111.6 −0.0 (−0.1,0.1)
Wine 92.8 94.2 90.9 92.8 89.8 85.9 71.1 69.1 71.7 73.4 69 82.8 −3.6 (−4.8,−2.3)
Other beverages 110.5 111.1 109.6 109.7 110.4 110.2 110 109.7 109.8 109.4 110.4 110 −0.1 (−0.2,−0.0)
Total alcohol 104.8 105.4 103.8 104.7 104.1 102.9 98.2 97.9 99.5 100.2 99.5 101.9 −0.7 (−1.1,−0.4)
Coverage of self-reported alcohol purchases (%) APC2001–2004(CI95%) APC2004–2011(CI95%)
Beer 69.5 70 67.5 69.6 67.7 64.8 60.3 59.6 58.6 57.3 54.5 63.3 −2.4 (−3.3,−1.5) −0.3 (−3.5,2.9) −3.3 (−4.1,−2.4)
Wine 95.5 96.8 93.7 95.7 92.5 88.7 80.1 77.9 78.6 80 80.1 87.9 −2.4 (−3.3,−1.6) _ _
Other beverages 50.8 65.2 57.6 52.7 57.3 58.2 61.6 69.4 68.8 66.1 71.9 61.1 2.7 (1.0,4.4) _ _
Total alcohol 72.2 78.6 73.4 73.1 73.1 70.7 67 67.9 67.1 66.1 66.3 70.5 −1.5 (−2.1,−0.9) _ _
Coverage of self-reported alcohol consumption (%)
Beer 53.1 30.9 28.4 26.3 34.1 −6.8 (−12.5,−0.8)
Wine 63.1 45.3 38.2 36.9 47.5 −5.4 (−7.9,−2.8)
Other beverages 34.5 23.6 25.7 21.4 26.8 −4.2 (−10.1,2.2)
Total alcohol 50.5 33.6 30.5 28 36.2 −5.7 (−9.1,−2.1)
Actual per capita alcohol consumption: Alcohol consumed by the population resident in Spain aged≥15 (CP) under intermediate assumptions.CP= R + CSV+ISV+ U-L-CFV-EFV;U = UT-CSV-ISV, whereRis multisource
availability,CSVis alcohol consumed abroad by Spanish visitors,ISVis alcohol purchased abroad by Spanish visitors and personally imported to Spain,Uis unrecorded alcohol other thanCSVandISV,Lis alcohol lost
after sale,CFVis alcohol consumed in Spain by foreign visitors,EFVis alcohol purchased in Spain by foreign visitors and personally exported from Spain, andUTis total unrecorded alcohol. See details in Additional file3.
Assumed parameters values for intermediate estimate were: Souvenir factor (S) for foreign visitors to Spain and Spanish visitors abroad = 0.2 lpa/visitor; Holiday factor (H) for foreign visitors to Spain and Spanish visitors abroad = 1.25; Price elasticity of demand (Ed) = 0.50;UT= 9 % ofR, with a relative decline of 1 % annually,L= 8 % of (R + CSV+ ISV+ U)
Coverage (%): Each indicator divided by actual consumption and multiplied by 100 Other beverages: Spirits, aperitifs, and cider
AAPC2001–2011(95 % CI): Average annual percent change (confidence interval at 95 %) for 2001–2011 from joinpoint regression APC (95 % CI): Annual percent change (confidence interval at 95 %) for the period in subscript when a joinpoint was identified
Sordo
et
al.
Population
Health
Metrics
(2016) 14:21
Page
8
of
were very similar from 2005 onwards, suggesting that the WHO data source had changed from that year on. Mixed trends by agency in the availability of beer and other beverages were also identified.
Correcting alcohol availability by triangulating dif-ferent sources (multisource availability) provides clear trends in per capita alcohol consumption, which de-creased by 2.3–2.4 % annually during 2001–2011, prolonging the pattern started around 1975. Declines have been also observed in most European countries [22, 32], and could be due to demographic, socioeco-nomic (including recession and unemployment), and cultural changes, as well as the possible effectiveness of some interventions [13, 33, 34]. Unfortunately, there is little empirical evidence on the quantification of each of these factors. Population aging during the period was negligible. Instead, the increase in immigrants’share of Spain’s residents (5.3 % in 2001 and 13.5 % in 2011) may have had some relevance, given that most immigrants in Spain drink less than natives [35], and the country’s progressive urbanization [4] (Spanish people living in cities >50,000 inhabitants increased from 47 % in 2001 to 52 % in 2011) may also have had an effect.
The role of economic factors is uncertain. Before the crisis starting in 2007–2008, alcohol consumption de-creased, while alcohol affordability remained stable or increased [4, 36]. However, the identification of join-points at 2006 for beer and wine (toward stability and decreasing, respectively), suggests that the crisis could
have contributed to the decline in consumption, affect-ing mostly drinkaffect-ing on premises, which continues to represent the most important component of consump-tion in Spain [37]. A recent study suggests that during the economic recession in Spain, regular excessive drinking decreased while binge drinking increased [38]. Finally, some interventions may have been effective, such as advertising regulations, increasing the minimum drinking age, workplace drinking bans, and traffic safety policies [34]. However, risk perception of drinking did not increase [39]. Consumption peaks in 2001 and 2004 were probably artifacts due mainly to stockpiling of spirits, triggered by rumors of possible tax increases [23], which hardly affected retail purchases. A progres-sive change of the dominant beverage from wine to beer was observed from the beginning of the study period [4], so that in 2011 beer accounted for 46 % of total alcohol consumption vs. 28 % for wine.
Although homogenizing trends in drinking patterns across Europe have been suggested [13], probably due to drinking patterns of youth, in other traditionally wine-drinking countries, such as France, Italy, Portugal, or Greece, wine remains the dominant beverage [22, 40].
Hidden overestimation of per capita consumption by alcohol availability
The multisource availability figures clearly overestimated actual consumption in Spain (by 12.3 % in 2011 under intermediate assumptions). This is mainly due to the
consumption/purchases imbalance between foreign visitors in Spain and Spanish visitors abroad (tourism imbalance). Thus, in 2011 in Spain there was an excess of 56.9 million international visits and 412.4 million international overnights, and most foreign visitors came from European countries with higher alcohol prices than Spain [22, 41]. In fact, without tourism imbalance, overestimation would have been only 2.2 %. Such an im-balance could also have an important effect on actual alcohol consumption in other countries, although the direction of the effect depends on the predominance of inbound or outbound international visits [1]. In Spain, correction of the Tax Agency availability indicator to ob-tain the multisource availability was a methodological need due to underestimation of wine and cider sales/ supplies by the tax agency, an underestimation that also transferred to the WHO availability figures starting in 2005 (which is generally referred to as “recorded per capita alcohol consumption”). In the absence of this correction, the similarity between coverage of the Tax Agency and WHO availability (≈100 % in 2011) gives an apparent coherence to these indicators and spuriously supports their validity.
Poor and decreasing coverage of per capita consumption by self-reported behaviors
Self-reported consumption coverage in Spain (28.0 % in 2011; range: 23.8–32.0 %) seems lower than elsewhere (30–65 %) [1, 7, 9, 14, 16–19], although figures outside this range have been reported [42–44].
Consumption by people aged <15 does not explain the low coverage because, as reported elsewhere [10], ana-lysis of Spanish school surveys [39] suggested it was negligible.
Consequently, the low coverage must be attributed to underestimation of consumption by population surveys, affecting mainly heavy and binge drinking [45, 46]. This could be due to various factors [1, 14, 25], including so-cial desirability bias [47], difficulty in quantifying and averaging consumption (especially if questions on fre-quency of drinking are not sufficiently disaggregated by beverage) [17], high probability of sampling exclusion of heavier drinkers due to homelessness/housing instability or living in communal establishments (student’s group quarters, prisons, hostels, etc.) or high consumption pe-riods like Christmas or summer holidays [48, 49], and assumption of standard drink volumes lower than com-monly used, especially for free-poured beverages, etc. [50–54]. Moreover, the varying alcohol content in emer-ging products [55, 56] complicates data collection.
Given the low coverage of self-reported consumption, using uncorrected figures to estimate alcohol-attributable disease burden or prevalence of heavy drinkers [57] will greatly underestimate alcohol-related problems and
intervention needs. Considering the highest range of estimated coverage, in Spain self-reported consumption figures in 2011 should be shifted upwards by as much as 91 % of any estimates of WHO or Tax Agency availability.
Self-reported purchases coverage was 66.3 % in 2011. Higher coverage (87–90 %) has been found in Sweden and UK [9, 10]. Underestimation of purchases can be due to incomplete recording by panelists (mostly affecting small and irregular purchases), failure to consider certain bever-ages (i.e., alcopops), sampling bias (e.g., failure to consider off-premise alcohol purchases, made outside the house-hold frame usually by youth) or even alcohol losses be-tween wholesale and retail markets. The observed lower underestimation compared to self-reported consumption could be explained by less reluctance to report purchases than consumption, and less difficulty in remembering and summarizing quantities of bottles/cans purchased than multiple drinking events, especially if purchases are re-corded by automatic barcode reading [9].
Downward trends in coverage of self-reported indica-tors were observed in 2001–2011. The decline in self-reported consumption coverage (5.7 % annually) was es-pecially intense, and is explained by the faster decline in self-reported consumption (8.4 % annually) compared with actual consumption (2.4 % annually). Large declines in age-adjusted prevalence of risk drinkers based on ENS self-reported consumption have also been found [58]. However, the decline during 2001–2011 in self-reported consumption from the EDADES survey [39] was much smaller (1.5 %).
A good spatiotemporal correlation between self-reported alcohol consumption and availability has been found else-where [1, 43]. However, declines in self-reported consump-tion coverage have been also observed; it has been suggested these may be partly due to the growing contribu-tion to total alcohol consumpcontribu-tion of binge drinking and ir-regular heavy drinking patterns, which are poorly captured by the usual basic QF approach [25, 49]. This is also plaus-ible in Spain where the prevalence of these patterns is in-creasing [59–61]. However, the decline in ENS coverage is probably due mainly to the fact that the instruments used in the most recent surveys do not capture consumption as well as those previously used. The main reasons are that the decline is very strong, and that coverage in the EDADES Survey, which has had more consistent data col-lection over time [61], has not fallen (31.1 % in 2001 and 36.2 % in 2011).
Finally, a probable increase in the proportion of off-premise alcohol purchases outside the household frame (not collected) may have contributed to decreasing coverage of self-reported purchases. The joinpoint at 2004 toward a decline in beer purchases coverage is probably an artifact caused by the exclusion of alcohol-free beer starting in that year. By beverage, the highest
coverage was found for wine and the lowest for other beverages, both in self-reported purchases and con-sumption, with heterogeneous findings elsewhere [9, 10].
Strengths and limitations
Data from multiple sources were triangulated to obtain ac-tual consumption for Spanish residents. This revealed the weakness of official national estimates, which is often trans-ferred to international statistics. Calculation algorithms in-corporate data on various factors affecting the estimates, especially regarding consumption/purchases during inter-national visits (Spanish residents abroad and foreigners in Spain). However, empirical national data on various aspects were lacking. Thus, assumptions were made based essen-tially on international studies [4, 10, 13, 18, 21, 22, 62]. The algorithms and methodology used have been clearly ex-plained, and the sensitivity analyses allowed calculation of uncertainty ranges for estimates. The main uncertainties arise in estimating unrecorded alcohol consumption and purchases during international visits. Estimates of unre-corded alcohol have little empirical basis; in Spain, its main component is probably derived from informal wine-making, although this should have declined with progres-sive urbanization. Smuggled or surrogate alcohol is likely to be negligible due to low alcohol prices. As for pur-chases during international visits, the algorithms combine empirical data (i.e., number of visits, average stay, the ratio between Spain and foreign countries of alcohol prices, and of per capita alcohol consumption) and assumptions (price elasticity of alcohol demand [36], or average quan-tity of alcohol purchased in a visit involving countries with alcohol prices and per capita consumption similar to Spain) (Additional files 3, 4, and 5). Moreover, the number of entries and overnight stays of foreigners in Spain might be somewhat higher than estimated because some illegal immigrants cannot be included in the population register. However, the phenomenon probably has low relevance, because in 2001–2011 very few conditions were required to be included in this register [35]. Finally, identical alco-holic beverage strength (ABV percentage) was applied throughout the entire period, but as elsewhere, changes over time cannot be ruled out, especially affecting wine strength, which might have increased [63–65].
Conclusions
This work shows the weakness of existing per capita alco-hol consumption estimates in Spain during 2001–2011. Substantial between-agency discrepancies in alcohol avail-ability have been found, which probably also exist in many countries. The quality and consistency of alcohol avail-ability data should be improved, establishing greater coordination among agencies and seeking consensus on data management protocols. Meanwhile, triangulation of availability data from various sources seems essential. The
availability of alcoholic beverages not subject to excise duty appears to be better reflected in non-financial balance sheets than in self-reported purchases. Directly taking uncorrected alcohol availability, and especially self-reported purchases or consumption, to derive time trends in actual alcohol consumption can lead to misjudgments in assessing intervention needs and effectiveness. In Spain, the multiplier factor to shift self-reported consumption figures upward to obtain conservative estimates of alcohol-attributable disease burden or heavy drinking prevalence should be somewhat higher than elsewhere due to surplus tourism. The QF instrument currently used in population surveys in Spain, derived from the European Health Interview Survey, seems to greatly underestimate actual per capita alcohol consumption. It should be com-plemented with appropriate questions to better charac-terize binge drinking and irregular drinking patterns.
Extensive empirical work remains to be done to improve estimates of per capita alcohol consumption, focusing on alcohol consumption/purchases by international visitors, alcohol losses, unrecorded alcohol, volume and strength of standard drinks, and other aspects.
Additional files
Additional file 1:Characteristics of the main aggregate data regularly provided by different sources to estimate actual per capita alcohol consumption in Spain, 2001–2011. The definition and method of production of the main aggregate data regularly provided by different sources to estimate actual per capita alcohol consumption in Spain are described in detail, as well as how to access data and metadata. The main data sources considered are the Spanish Tax Agency, Eurostat, Word Health Organization, Food and Agriculture Organization, Spanish Food Consumption Panel, Spanish Tourism Institute, World Bank, and National Statistics Institute. (DOCX 17 kb)
Additional file 2:Methodological characteristics of main population surveys providing data to calculate self-reported alcohol consumption among population aged≥15, and calculation algorithms, Spain, 2001–2011. The characteristics considered are: year of the survey, effective sample size, mode of questionnaire administration, questions on frequency of consumption, questions on number of standard drinks, response rate, and percent of missing values for quantity-frequency questions. (DOCX 15 kb)
Additional file 3:Algorithms and assumptions to estimate actual per capita alcohol consumption from multisource availability, Spain, 2001–2011. Definition, algorithms, and assumptions are included for the following indicators: actual per capita alcohol consumption, alcohol consumption abroad by Spanish visitors, alcohol imported by Spanish visitors abroad, other unrecorded alcohol, alcohol losses after sale, alcohol consumption in Spain by foreign visitors, and alcohol exported from Spain by foreign visitors. (DOCX 21 kb)
Additional file 5:Example of estimation of alcohol consumed/purchased in visits to Spain by foreign residents and visits abroad by Spanish residents, 2011. Data for different countries on parameters needed for the estimation are included, specifically on: total alcohol per capita consumption, alcohol price index, number of inbound and outbound visits, and number of inbound and outbound stays. The calculations are disaggregated for overnight visitors and same-day visitors. (DOCX 24 kb)
Abbreviations
AAPC, average annual percent change; ABV, alcohol-by-volume or content of pure alcohol by beverage volume; APC, annual percent change; FAO, Food and Agriculture Organization; lpa/py, liters of pure alcohol per person-year; QF, quantity and frequency; ENS, Spanish National Health Survey; Tax Agency, Spanish Tax Agency; WHO, World Health Organization; 95 % CI, confidence intervals at 95 %
Competing interests
None of the authors have any conflicts of interest associated with this manuscript. The views expressed in this article are those of the authors and not necessarily those of the Ministry of Health, Social Services and Equality, or other institutions in which the authors work.
Authors’contributions
GB and ER designed and coordinated the study; MJB, AE, and MN carried out the search for information, and LS carried out the analysis with inputs from MJB, AE and MN; JRB contributed expertise on information systems and scientific literature on alcohol; LS, GB and ER wrote the first draft of the manuscript; all authors contributed to subsequent revisions and have approved the final version.
Acknowledgements
The authors are grateful to Kathy Fitch for translation. This work was supported by Spanish Health Research and Development Strategy (PI13/00183; PI15CIII/00022), National Plan on Drugs (2015I040). Writing of the paper was also partially supported by a grant of the National Plan on Drugs (Res. 8-7-15. Secretaría de Estado de Servicios Sociales e Igualdad) to the Alcohol Work Group of the Spanish Society of Epidemiology.
Author details
1National Epidemiology Center, Carlos III Health Institute, Avenida Monforte
de Lemos 5, E-28029 Madrid, Spain.2Consortium for Biomedical Research in Epidemiology & Public Health (CIBERESP), Avenida Monforte de Lemos 5, E-28029 Madrid, Spain.3Department of Preventive Medicine and Public Health, Madrid Complutense University, Ciudad Universitaria s/n, E-28040 Madrid, Spain.4National School of Public Health, Carlos III Health Institute, Avenida Monforte de Lemos 5, E-28029 Madrid, Spain.5Agència de Salut
Pública de Barcelona, Pl. Lesseps, 1. E-08023 Barcelona, Spain.6Ministry of Health, Social Services and Equality, Paseo del Prado 18-20, E-28071 Madrid, Spain.
Received: 17 February 2016 Accepted: 27 May 2016
References
1. WHO. International guide for monitoring alcohol consumption and related harm. Geneva:World Health Organization (WHO); 2000. http://www.who.int/ iris/handle/10665/66529. Accessed 11 Dec 2015.
2. Norstrom T, Skog OJ. Alcohol and mortality: methodological and analytical issues in aggregate analyses. Addiction. 2001;96 Suppl 1:S5–17.
3. Norstrom T, Ramstedt M. Mortality and population drinking: a review of the literature. Drug Alcohol Rev. 2005;24:537–47.
4. Rabinovich L, Brutscher PB, de Vries H, Tiessen J, Clift J, Reding A. The affordability of alcoholic beverages in the European Union. Understanding the link between alcohol affordability, consumption and harms. Arlington, VA:RAND Corporation; 2009. http://www.rand.org/content/dam/rand/pubs/ technical_reports/2009/RAND_TR689.pdf. Accessed 11 Dec 2015. 5. Engdahl B, Ramstedt M. Is the population level link between drinking and
harm similar for women and men?–a time series analysis with focus on gender-specific drinking and alcohol-related hospitalizations in Sweden. Eur J Public Health. 2011;21:432–7.
6. Rehm J, Scafato E. Indicators of alcohol consumption and attributable harm for monitoring and surveillance in European Union countries. Addiction. 2011;106 Suppl 1:4–10.
7. Gmel G, Rehm J. Measuring alcohol consumption. Contemporary Drug Problems. 2004;31:467–540.
8. Rehm J, Klotsche J, Patra J. Comparative quantification of alcohol exposure as risk factor for global burden of disease. Int J Methods Psychiatr Res. 2007;16:66–76.
9. Ramstedt M. How much alcohol do you buy? A comparison of self-reported alcohol purchases with actual sales. Addiction. 2010;105:649–54.
10. Robinson M, Thorpe R, Beeston C, McCartney G. A review of the validity and reliability of alcohol retail sales data for monitoring population levels of alcohol consumption: a Scottish perspective. Alcohol Alcohol. 2013;48:231–40. 11. Henderson A, Robinson M, McAdams R, McCartney G, Beeston C. Tracking
biases: an update to the validity and reliability of alcohol retail sales data for estimating population consumption in Scotland. Alcohol Alcohol. 2016;51: 363-6.
12. Smith PF, Remington PL, Williamson DF, Anda RF. A comparison of alcohol sales data with survey data on self-reported alcohol use in 21 states. Am J Public Health. 1990;80:309–12.
13. Norstrom T, editor. Alcohol in postwar Europe: Consumption, drinking patterns, consequences and policy responses in 15 European countries. Stockholm: European Commission; 2001. http://btg.ias.org.uk/alcohol-policy-eu.html. Accessed 11 Dec 2015.
14. Meier PS, Meng Y, Holmes J, Baumberg B, Purshouse R, Hill-McManus D, et al. Adjusting for unrecorded consumption in survey and per capita sales data: quantification of impact on gender- and age-specific alcohol-attributable fractions for oral and pharyngeal cancers in Great Britain. Alcohol Alcohol. 2013;48:241–9.
15. LaVallee RA, Yi HY. Apparent per capita alcohol consumption: national, state, and regional trends, 1977–2012. Arlington, VA: National Institute on Alcohol Abuse and Alcoholism; 2014. http://pubs.niaaa.nih.gov/publications/ surveillance98/CONS12.htm. Accessed 11 Dec 2015.
16. Knibbe RA, Bloomfield K. Alcohol consumption estimates in surveys in Europe: comparability and sensitivity for gender differences. Subst Abus. 2001;22:23–38. 17. Stockwell T, Donath S, Cooper-Stanbury M, Chikritzhs T, Catalano P,
Mateo C. Under-reporting of alcohol consumption in household surveys: a comparison of quantity-frequency, graduated-frequency and recent recall. Addiction. 2004;99:1024–33.
18. Boniface S, Shelton N. How is alcohol consumption affected if we account for under-reporting? A hypothetical scenario. Eur J Public Health. 2013;23:1076–81.
19. Rehm J, Kehoe T, Gmel G, Stinson F, Grant B, Gmel G. Statistical modeling of volume of alcohol exposure for epidemiological studies of population health: the US example. Popul Health Metr. 2010;8:3.
20. Norstrom T. Estimating changes in unrecorded alcohol consumption in Norway using indicators of harm. Addiction. 1998;93:1531–8. 21. Trolldal B. Alcohol sales figures in 15 European countries: corrected for
consumption abroad and tax-free purchases. Nordic Studies on Alcohol. 2001;18:71–81.
22. World Health Organization (WHO). Global status report on alcohol and health 2014 ed. Geneva:WHO; 2014. http://www.who.int/substance_abuse/ publications/global_alcohol_report/en/. Accessed 11 Dec 2015. 23. Agencia Tributaria. 2011. Impuestos sobre el alcohol y las bebidas
alcohólicas. http://www.agenciatributaria.es/AEAT.internet/Inicio/Aduanas_ e_Impuestos_Especiales/Impuestos_Especiales/Impuestos_Especiales.shtml. Accessed 12 Nov 2015.
24. Harper S, Lynch J. Methods for measuring cancer disparities: using data relevant to healthy people 2010 cancer-related objectives. Bethesda, MD: National Cancer Institute; 2005. http://seer.cancer.gov/archive/publications/ disparities/index.html. Accessed 11 Dec 2015.
25. Dawson DA. Methodological issues in measuring alcohol use. Alcohol Res Health. 2003;27:18–29.
26. Rodríguez-Martos A, Gual A, Llopis J. [The“standard drink unit”as a simplified record of alcoholic drink consumption and its measurement in Spain]. Med Clin (Barc). 1999;112:446–50. The“standard drink unit”as a simplified record of alcoholic drink consumption and its measurement in Spain.
27. Sociedad Española de Medicina Familiar y Comunitaria (SEMFYC). Guía rápida para abordar el abuso de alcohol. Barcelona:SEMFYC; 2005. https://www. semfyc.es/pfw_files/cma/Informacion/modulo/documentos/abuso-alcohol.pdf. Accessed 11 Dec 2015.
28. Organización Médica Colegial-Ministerio de Sanidad y Consumo. Guía de buena práctica clínica en uso y abuso de alcohol. Madrid:Organización Médica Colegial-Ministerio de Sanidad y Consumo; 2006. http://www.msssi. gob.es/alcoholJovenes/docs/guiaBPCusoabusoAlcohol07.pdf. Accessed 11 Dec 2015.
29. Suárez M, Neira M, Ichaso MS. Encuesta Nacional de Salud. España 2011/12. Consumo de Alcohol. Madrid:Ministerio de Sanidad, Servicios Sociales e Igualdad; 2013. http://www.msssi.gob.es/estadEstudios/estadisticas/ encuestaNacional/encuesta2011.htm. Accessed 11 Dec 2015. 30. National Cancer Institute (NCI). Joinpoint Trend Analysis Software.
http://surveillance.cancer.gov/joinpoint/. Accessed 11 Dec 2015. 31. Greenfield TK, Kerr WC. Tracking alcohol consumption over time. Alcohol
Res Health. 2003;27:30–8.
32. Gual A, Colom J. Why has alcohol consumption declined in countries of southern Europe? Addiction. 1997;92 Suppl 1:S21–31.
33. Matrai S, Casajuana C, Allamani A, Baccini M, Pepe P, Massini G, et al. The relationships between the impact of alcoholic beverage control policies, selected contextual determinants, and alcohol drinking in Spain. Subst Use Misuse. 2014;49:1665–83.
34. Villalbí JR, Bosque-Prous M, Gili-Miner M, Espelt A, Brugal MT. [Policies to prevent the harm caused by alcohol]. Rev Esp Salud Publica. 2014;88:515–28. 35. Sordo L, Indave BI, Vallejo F, Belza MJ, Sanz-Barbero B, Rosales-Statkus M,
et al. Effect of country-of-origin contextual factors and length of stay on immigrants’substance use in Spain. Eur J Public Health. 2015;25:930–6. 36. Anderson P, Møller L, Galea G. Alcohol in the European Union
Consumption, harm and policy approaches. Copenhagen: World Health Organization Regional Office for Europe; 2012.
37. Rabinovich L, Hunt P, Staetsky L, Goshev S, Nolte L, Pedersen J, Tiefensee C. Further study on the affordability of alcoholic beverages in the EU. A focus on excise duty pass-through, on- and off-trade sales, price promotions and pricing regulations. Arlington, VA:RAND Corporation; 2012. http://www.rand. org/pubs/technical_reports/TR1203.html. Accessed 11 Dec 2015. 38. Colell E, Sanchez-Niubo A, Delclos GL, Benavides FG, Domingo-Salvany A.
Economic crisis and changes in drug use in the Spanish economically active population. Addiction. 2015;110:1129–37.
39. Delegación del Gobierno para el Plan Nacional sobre Drogas. Informe 2011. Observatorio Español de la Droga y las Toxicomanías. Situación y tendencias de los problemas de drogas en España. Madrid:Ministerio de Sanidad, Política Social e Igualdad; 2011. http://www.pnsd.msc.es/ Categoria2/observa/pdf/oed2011.pdf. Accessed 11 Dec 2015.
40. Devaux M, Sassi F. Alcohol consumption and harmful drinking. Trends and social disparities across OECD countries. Paris:OECD Publishing; 2015. http://dx.doi.org/10.1787/5js1qwkz2p9s-en. Accessed 11 Dec 2015. 41. Kurkowiak B. Price levels for food, beverages and tobacco across the European
market differ significantly Comparative price levels in 37 European countries for 2009. Luxembourg:Eurostat; 2010. A. http://www.scb.se/Statistik/PR/ PR0401/_documents/KS-SF-10-030-EN.pdf. Accessed 11 Dec 2015. 42. Midanik L. The validity of self-reported alcohol consumption and alcohol
problems: a literature review. Br J Addict. 1982;77:357–82.
43. Nelson DE, Naimi TS, Brewer RD, Roeber J. US state alcohol sales compared to survey data, 1993–2006. Addiction. 2010;105:1589–96.
44. Livingston M, Callinan S. Underreporting in alcohol surveys: whose drinking is underestimated? J Stud Alcohol Drugs. 2015;76:158–64.
45. Northcote J, Livingston M. Accuracy of self-reported drinking: observational verification of‘last occasion’drink estimates of young adults. Alcohol Alcohol. 2011;46:709–13.
46. Boniface S, Kneale J, Shelton N. Drinking pattern is more strongly associated with under-reporting of alcohol consumption than socio-demographic factors: evidence from a mixed-methods study. BMC Public Health. 2014;14:1297. 47. Garnett C, Crane D, West R, Michie S, Brown J, Winstock A. Normative
misperceptions about alcohol use in the general population of drinkers: a cross-sectional survey. Addict Behav. 2015;42:203–6.
48. Makela P, Huhtanen P. The effect of survey sampling frame on coverage: the level of and changes in alcohol-related mortality in Finland as a test case. Addiction. 2010;105:1935–41.
49. Gorman E, Leyland AH, McCartney G, White IR, Katikireddi SV, Rutherford L, et al. Assessing the representativeness of population-sampled health surveys through linkage to administrative data on alcohol-related outcomes. Am J Epidemiol. 2014;180:941–8.
50. White AM, Kraus CL, McCracken LA, Swartzwelder HS. Do college students drink more than they think? Use of a free-pour paradigm to determine how college students define standard drinks. Alcohol Clin Exp Res. 2003;27:1750–6. 51. Gill JS, Donaghy M. Variation in the alcohol content of a‘drink’of wine and
spirit poured by a sample of the Scottish population. Health Educ Res. 2004;19:485–91.
52. Kerr WC, Patterson D, Koenen MA, Greenfield TK. Alcohol content variation of bar and restaurant drinks in Northern California. Alcohol Clin Exp Res. 2008;32:1623–9.
53. Devos-Comby L, Lange JE.“My drink is larger than yours”? A literature review of self-defined drink sizes and standard drinks. Curr Drug Abuse Rev. 2008;1:162–76.
54. Boniface S, Kneale J, Shelton N. Actual and perceived units of alcohol in a self-defined“usual glass”of alcoholic drinks in England. Alcohol Clin Exp Res. 2013;37:978–83.
55. Metzner C, Kraus L. The impact of alcopops on adolescent drinking: a literature review. Alcohol Alcohol. 2008;43:230–9.
56. Mart SM. Alcohol marketing in the 21st century: new methods, old problems. Subst Use Misuse. 2011;46:889–92.
57. Fierro I, Ochoa R, Yánez JL, Valderrama JC, Alvarez FJ. [Alcohol-related mortality and premature death in Spain between 1999 and 2004]. Med Clin (Barc). 2008;131:10–3. Alcohol-related mortality and premature death in Spain between 1999 and 2004.
58. Regidor E, Gutiérrez-Fisac JL, de los Santos I, Fernández E. Trends in principal cancer risk factors in Spain. Ann Oncol. 2010;21 Suppl 3:iii37–42. 59. Valencia-Martín JL, Galán I, Rodríguez-Artalejo F. Binge drinking in Madrid,
Spain. Alcohol Clin Exp Res. 2007;31:1723–30.
60. Soler-Vila H, Galán I, Valencia-Martín JL, León-Muñoz LM, Guallar-Castillón P, Rodríguez-Artalejo F. Binge drinking in Spain, 2008–2010. Alcohol Clin Exp Res. 2014;38:810–9.
61. Delegación del Gobierno para el Plan Nacional sobre Drogas. Encuesta sobre alcohol y drogas en España (EDADES), 1995–2011. http://www.pnsd. msssi.gob.es/profesionales/sistemasInformacion/sistemaInformacion/ encuestas.htm. Accessed 11 Dec 2015.
62. Leifman H. Estimations of unrecorded alcohol consumption levels and trends in 14 European countries. Nordic Studies on Alcohol. 2001;18:54–70. 63. Kerr WC, Greenfield TK, Tujague J. Estimates of the mean alcohol concentration
of the spirits, wine, and beer sold in the United States and per capita consumption: 1950 to 2002. Alcohol Clin Exp Res. 2006;30:1583–91. 64. Kerr WC, Greenfield TK, Tujague J, Brown SE. The alcohol content of wine
consumed in the US and per capita consumption: new estimates reveal different trends. Alcohol Clin Exp Res. 2006;30:516–22.
65. Chikritzhs TN, Allsop SJ, Moodie AR, Hall WD. Per capita alcohol consumption in Australia: will the real trend please step forward? Med J Aust. 2010;193:594–7.
• We accept pre-submission inquiries
• Our selector tool helps you to find the most relevant journal • We provide round the clock customer support
• Convenient online submission • Thorough peer review
• Inclusion in PubMed and all major indexing services • Maximum visibility for your research
Submit your manuscript at www.biomedcentral.com/submit