R E S E A R C H
Open Access
Greedy scheduling of tasks with time
constraints for energy-efficient
cloud-computing data centers
Ziqian Dong
1*, Ning Liu
2and Roberto Rojas-Cessa
3Abstract
In this paper, we introduce a model of task scheduling for a cloud-computing data center to analyze energy-efficient task scheduling. We formulate the assignments of tasks to servers as an integer-programming problem with the objective of minimizing the energy consumed by the servers of the data center. We prove that the use of a greedy task scheduler bounds the constraint service time whilst minimizing the number of active servers. As a practical approach, we propose the most-efficient-server-first task-scheduling scheme to minimize energy consumption of servers in a data center. Most-efficient-server-first schedules tasks to a minimum number of servers while keeping the data-center response time within a maximum constraint. We also prove the stability of most-efficient-server-first scheme for tasks with exponentially distributed, independent, and identically distributed arrivals. Simulation results show that the server energy consumption of the proposed most-efficient-server-first scheduling scheme is 70 times lower than that of a random-based task-scheduling scheme.
Keywords: Cloud computing; Energy efficiency; Data center; Greedy algorithm; Integer programming
Introduction
Cloud computing has risen as a new computing paradigm that brings unparalleled flexibility and access to shared and scalable computing resources. The increas-ing demand for data processincreas-ing and storage in this digital world is leading a significant growth of data centers, the size of which has grown from 1000’s to a few hundred thousands servers [1].
Cloud-computing data centers offer information tech-nology (IT) resources as services. The hardware systems (servers, data center network systems, storage, etc.) and software systems (operating systems, management soft-ware, etc.) represent the resources the data center pro-vides as Infrastructure as a Service (IaaS) and Platform as a Service (PaaS), respectively. Applications, such as web search, social networking, computation, etc., offered by cloud-computing data centers are hosted as Software as a Service (SaaS) [2]. These applications run on virtualized
*Correspondence: [email protected]
1Department of Electrical and Computer Engineering, New York Institute of Technology, 1855 Broadway, New York, NY 10023, USA
Full list of author information is available at the end of the article
IT resources, namely, virtual machines (VMs), provided by IaaS and PaaS. Based on the request, the cloud service providers provision resources such as different types of VMs to the requests.
Energy consumption of a data center constitutes a major operation cost [3-5]. The energy consumed by these large-scale data centers has reached billions of Kilowatt-hours per year and is expected to continue to grow [6]. The increasing energy demand could become a hurdle to data center scalability, let alone the carbon footprint they would leave [3-5]. An Emerson report estimates that the servers of a data center account for 52% of the total consumed energy, while the cooling systems account for 38%, and other miscellaneous supporting systems, such as power distribution, account for the remaining 10% [5]. These three different sub-systems of a data center may be optimized for energy efficiency.
In this paper, we target the reduction of energy expendi-ture of the servers of a data center and address this issue by bounding the number of active servers for workloads that require a constrained response time. We model the energy consumption of a data center and analyze the trade-off between the response time and the number of active
servers as an integer-programming optimization problem. Optimization of resource allocation in large-scale data centers is non-trivial and non-scalable.
As a practical solution, we propose the most-efficient-server-first (MESF) task-scheduling scheme to minimize the energy consumption while keeping the response within a constrained time. Here, a task is a request for a job of the contracted application that may require a defined amount of resources and the creation of a VM to sup-port the application. The job may be data transmission (uploading and downloading), data processing, software access and execution, or storage functions. Each task, as the corresponding VM, is then assigned to one of the available servers. In turn, the task is performed and the result (or a completion notice) is returned to the user. Fur-thermore, because tasks are assigned to servers as soon as they arrive, queues build up on some of the servers. Therefore, we analyze the queueing delay of tasks for the proposed MESF scheduling scheme and prove that the scheduling scheme is weakly stable under independent and identically distributed (i.i.d.) task arrivals that follow an exponential distribution. By simulation, we show the impact of MESF on the energy consumed by a data cen-ter, and compare it to that of a data center that assigns tasks to servers randomly [7]. Our simulation results show that MESF may reduce the data center energy consump-tion 70 times that consumed by the scheme that assigns tasks randomly.
The remainder of this paper is organized as fol-lows. We discuss the related work in the next section. The Data center model section presents the model of the cloud-computing data center adopted in this paper. Task scheduling and energy consumption section introduces the proposed energy consumption model for a cloud-computing data center. The most-efficient server first scheme section introduces the MESF task-scheduling scheme. The Stability analysis of MESF section presents the stability analysis of the proposed schedul-ing scheme. The Simulation results section presents our simulation results of energy consumption and task response time for the proposed MESF and random task-scheduling schemes. The Conclusions section presents our conclusions.
Related work
The servers of a data center account for the largest amount of energy consumed by the data center [5]. Recent works focus on schemes aiming at reducing energy consump-tion by servers through efficient job scheduling, resource allocation optimization, and virtual machine consolida-tion [8-12]. A conservative allocaconsolida-tion of resources and jobs in data centers may lead to powering ON a large number of servers, contributing to a large amount of con-sumed energy [13]. Energy-aware job allocation schemes
may be used towards receding the energy consumed by servers [14]. In such a scheme, the traffic distribution and link states of a data-center network are considered for deciding to which servers jobs are allocated. The objec-tive of these schemes is to consolidate network traffic and server load to reduce the fraction of active network equip-ment, set link speeds to match traffic demand, and turn off non-critical servers.
Cloud-computing data centers may use VMs to consol-idate workloads to reduce the number of active servers [9-12,15-19]. To ensure that the service level agreement (SLA) is met, cloud-computing data centers may set up upper limits for resource utilization while placing VMs. This may lead to poor utilization of resources due to the dynamics of data center workloads. A scheme that uses dynamic thresholds was proposed considering the follow-ing policies for placfollow-ing VMs: minimization of VM migra-tion, balancing of resource utilization and SLA violamigra-tion, and random selection [9]. This scheme achieves energy efficiency by allowing a level of SLA violations. Another approach introduces a power management scheme that implements multiple feedback controllers at the levels of racks, servers, and VMs to improve data center energy efficiency [11]. Although reducing the number of active servers in a data center may improve energy efficiency, over-consolidation may jeopardize the quality of the ser-vice (QoS) provided by the data center. Maintaining QoS whilst increasing energy efficiency is critical for the eco-nomical sustainability of a data center [10,15-17]. Mini-mizing the number of virtual-machine migrations may be employed to maintain service guarantees and to reduce the energy consumption of cloud-computing data centers [16]. In a more direct approach, jobs may be mapped to the existing computing resources to ensure that the satis-faction of the required QoS of different applications [20]. However, these methods require global knowledge of the state of the data center and, in turn, a fast central con-troller to perform timely decisions for the dynamic data center networks.
Data center model Data center network
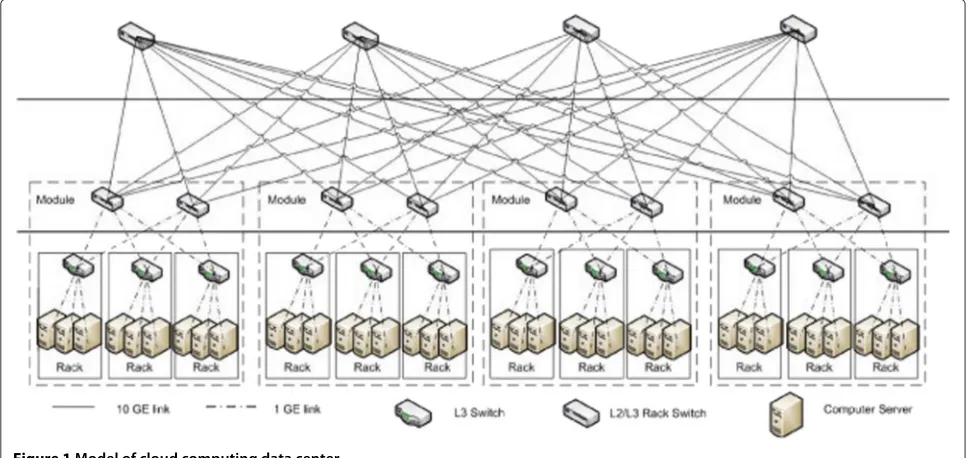
A data center houses a large number (e.g., hundreds to thousands) of servers and storage units, which are interconnected through a network with a number of switches/routers, in an arrangement that resembles a Clos-network or fat-tree topology [21-25]. Figure 1 shows the data center architecture considered in this paper. We assume that the network infrastructure provides enough bandwidth to avoid queueing delays in the intermediate network nodes.
Figure 1Model of cloud computing data center.
applications in the data center, thus requesting a large amount of resources. Therefore, the number of servers (and VMs) leased by each tenant is large. Resource pro-visioning in cloud data centers is a complex process that requires matching of a large number of requests with a large amount of software and hardware while satisfying the SLA. In this paper, we focus on resource provision-ing at the SaaS level to study the effect of task schedulprovision-ing schemes on the energy efficiency of a data center. In this paper, we consider the creation and allocation of VMs in cloud data centers as a part of the task, requiring a well-defined amount of resources such as CPU, memory, storage, etc. from the servers.
Data center workload
Data centers have different types of servers with each type dedicated to handle a specific type of tasks. The process-ing time and computprocess-ing resources for different types of tasks may also be different. In 2011, Google released the first set of one of its cluster workload traces to the pub-lic, which provides data from a 12K-machine data-center cell recorded over about a month, in May 2011 [26]. The data have enabled studies on trace analysis to charac-terize data center workload [27,28]. These studies show that the data center workload is highly dynamic and het-erogeneous. The workload includes both bursty jobs that demand quick response times and long-running jobs with intensive computing resource requirements. In this paper, we provide a perspective on evaluating the energy con-sumption of cloud-computing data centers by considering various task deadlines, resource requirements, and server energy profiles.
Task scheduling and energy consumption
A data center is required to handle a large number of tasks demanding different computational resources, e.g. CPU, memory, and communications. Under this variety, servers may provide different response times and consume dif-ferent levels of energy for difdif-ferent types of tasks. In this paper, we focus on the study of efficient task scheduling to minimize the energy consumption of a data center by reducing the number of active servers.
Optimization of energy consumption by minimizing the number of active servers
Terminology and definitions
We consider a data center withMservers, each denoted as Sj, where 1≤j≤M. The data center can processVtypes of tasks. A task of typeiprocessed at serverjis associated with a deadline or a maximum response time, denoted as Bi,j, where 1 ≤ i ≤ V, 1 ≤ j ≤ M. Task deadlines may be required by users or self-imposed by the data center [29]. Here, we assume that time is slotted with fixed dura-tion. Considering a constant service rate at the servers, the response time increases proportionally to the number of tasks waiting in the server. Therefore, we use the response time and number of tasks in servers interchangeably in this paper. The processing time for a type-itask at Sj is denoted asμi,j. The number of tasks arriving to the data center is denoted asN, and the number of typeitasks is ni, where
1≤i≤VandN= V
i=1 ni.
Figure 2Model of the data center task scheduler.
assigning tasks to servers. Tasks assigned to each server are processed on a first-come first-serve basis. If a server is busy, tasks are queued in the server queue awaiting pro-cessing. The task scheduler may also be implemented in a distributed manner [30]. For simplicity but, without losing generality, we set the queue capacity ofSjfor typeitasks equal to the task deadlineBi,j. The number of type-itasks assigned toSjis denoted asxi,j. The order in which tasks are scheduled toSjby the central scheduler is indicated as a task schedule vectorXj.
The schedule matrix,Xj, is anV× V
i=1
xi,j, where V
i=1 xi,j
is the total number of tasks assigned toSj.
Here, the matrix elements are either 0 or 1, where the position of the elements of the matrix represents the task sequence. The row of the matrix indicates the task type and the column indicates the time slot or sequence in which tasks are scheduled. For example, for three types of tasks (V = 3) and four tasks scheduled forSj, and the schedule vector is presented as a 3×4 matrix,
Xj=
⎛ ⎝1 1 0 00 0 1 0
0 0 0 1
⎞ ⎠
where the top row shows two type-1 tasks, the second row shows one type-2 task, and the bottom row shows one type-3 task. The columns show that two type-1 task are sent to the server in the first two time slots, a type-2 task is sent to the server in the next time slot, and a type-3 task is sent to the server in the four time slot.
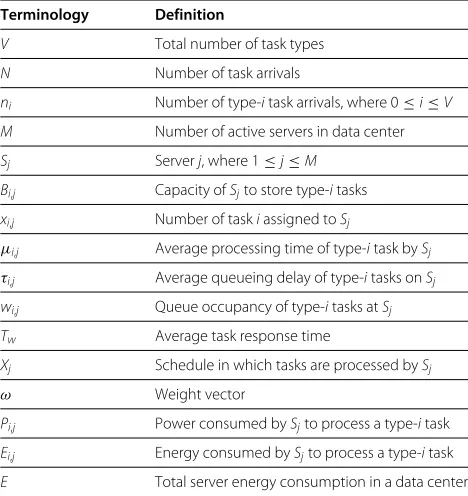
The average queueing delay for type-i task at Sj is denoted as τi,j. The average task response time, Tw, includes the task processing delay and queueing delay. The number of type-i tasks queued at Sj at a given time is denoted as wi,j. Table 1 summarizes the definitions and nomenclature used in this paper.
In this paper, we aim to find an optimum task-scheduling scheme to minimize task response time and energy consumed by the data center servers.
Table 1 Terminology definition
Terminology Definition
V Total number of task types
N Number of task arrivals
ni Number of type-itask arrivals, where 0≤i≤V
M Number of active servers in data center
Sj Serverj, where 1≤j≤M
Bi,j Capacity ofSjto store type-itasks
xi,j Number of taskiassigned toSj
μi,j Average processing time of type-itask bySj
τi,j Average queueing delay of type-itasks onSj
wi,j Queue occupancy of type-itasks atSj
Tw Average task response time
Xj Schedule in which tasks are processed bySj
ω Weight vector
Pi,j Power consumed bySjto process a type-itask
Ei,j Energy consumed bySjto process a type-itask
Optimization problem
We formulate the energy consumption of the data center in function of the number of active servers as an integer-programming problem with the objective of minimizing data center energy consumption. We denote the power consumed by Sj to complete a type-i task as Pij. The amount of energy consumed by all the data center servers is denoted asE, which is the sum of energy consumed by
servers processing all the tasks
V i=1 M j=1 xi,j
for the period
of time used to process these tasks. Therefore,
E= V
i=1 M
j=1
μi,jPi,jxi,j (1)
The objective function is defined as
min
x E=
V
i=1 M
j=1
μi,jPi,jxi,j
s.t. M
j=1
xi,j=ni, xi,j≤Bi,j−wi,j
(2)
Here, the number of tasks assigned to a server is such that the server ensures that all tasks can be processed within the task deadline constraint. We set the capacity of a server queue atSj to store typeitasks equal to this deadline orBi,j. Considering the queueing delay,wi,j, the number of task arrivals,xi,j, needs to be no larger than Bi,j−wi,j.
The average response time per task,Tw, is defined as the average queueing delays,xi,jτi,j, plus the average process-ing delays,TjXjωdivided by the total number of tasks in the data center,N.
Tw= M
j=1
V
i=1
xi,jτi,j+TjXjω
N (3)
Tj is the processing time vector at Sj, Tj =
(μ1,j,μ2,j, · · ·, μV,j), and ω is the weight vector. It accounts for the scheduling delay associated with the sequence a task is scheduled to be processed bySj:
ω=
V
i=1 xi,j−1,
V
i=1
xi,j−2, · · ·, 1, 0
T
(4)
When the data center has a light load and there is no backlogged tasks in the queues at the servers, the
upcoming tasking are immediately assigned to servers and this assignment incurs no queueing delay. In this case, the optimization problem is a subset of the general problem, or:
min
x E(x)= V
i=1 M
j=1
μi,jPi,jxi,j
s.t.
M
j=1
xi,j=ni, xi,j≤Bi,j
(5)
Here,Twis bounded by the average processing time of the number of different types of tasks assigned to each server and the sequence of the task allocation in the task scheduler:
Tw=TjXjω (6)
Analysis of homogeneous tasks
In the remainder of this section, we analyze the assign-ment of a single type of tasks (V = 1) and estimate a bound of the number of servers required to comply with the maximum response time. This can be considered under the assumption that other task types can be decom-posed into a linear combination of a unitary task of a basic task type.
For simplicity, we remove the subscript iin the nota-tion forμi,j,xi,j, andτi,jin the remainder of this section. Eqn. (3) becomes:
Tw= M
j=1 μj
2xj(xj−1) (7)
withM j=1
xj=n. Let us assume that
F(xj,λ)=T = M
j=1 μj
2xj(xj−1)+λ
⎛ ⎝M
j=1 xj−n
⎞ ⎠ (8)
to find the minimum response time, we take the partial derivatives ofF with respect toxj andλ, whereλ is the Lagrange multiplier, or:
∂F ∂xj =
μj
2 (2xj−1)+λ=0 (9)
∂F ∂λ =
M
j=1
Therefore,
xj= 1 2−
λ μj
, forj=1, . . ., M (11)
and
M 2 −λ
M
j=1 1 μj =
n (12)
From (11) and (12):
λ= M−2n
2 M j=1 1 μj (13)
xj= 1 2−
M−2n 2μj
M j=1 1 μj (14)
Since 1≤xj≤Bj, the number of servers,M, is bounded by
2n−(2Bj−1)μj M
j=1 1 μj ≤
M≤2n−μj M
j=1 1 μj
(15)
Here, for a given number ofntask arrivals with a Pois-son distribution, the number of serversMis bounded by the task deadlinesBj and service rate μj at each server. The tightness of the bound is in function of the maximum allowable time to service the task,Bj as (15) shows. For example, whenBj =1, the number of servers required to completentasks in one time slot is 2n−μj
M
j=1 1
μj.
The most-efficient server first scheme
In a data center with heterogeneous servers, the servers with the highest computing capacity, which is defined as the maximum number of tasks a sever can process in par-allel, are the most preferred servers in the assignment of tasks. This server may provide a lower energy expenditure per processed task (or bytes). In this case, the optimiza-tion problem can be interpreted as a greedy-assignment scheme. For this, it is considered that the central sched-uler sorts the servers based on their energy efficiency, and assigns tasks to the most energy-efficient servers first and it then continues to allocate tasks to the second most effi-cient servers on the list, and so on, until no task remains or else, servers’ queues are full.
For a data center with a single server type, MESF assigns a number of tasks to each active server, until the satura-tion point (where the server performance decays signifi-cantly, or the task queueing delay is approaching its delay constraint) is reached. The greedy scheduling scheme is described Algorithm 1.
Algorithm 1The Most-Efficient-Server First Scheme S←list of servers
X←current task
most efficient server(mes)←NULL
for allsinSdo
ifs is available to processXthen
if mes = NULLor s.Eincrement < mes.Eincrement
then mes←s end if end if end for
if notmes=NULLthen Xis allocated tomes end if
The central scheduler maintains a sorted list of non-saturated and active servers with their energy profiles. The servers are sorted according to their energy profiles where the most energy-efficient servers are placed on the top of the list. Upon receiving task requests, the scheduler assigns tasks to the servers from the sorted list from top to bottom. The servers receive task assignments and their energy profile is updated. Once the most energy-efficient servers are saturated, they are removed from the list until they become unsaturated.
Discussion on the complexity of the scheduling scheme The complexity of the proposed MESF scheduling scheme is mostly that of the complexity of sorting servers by their energy efficiency. Without knowledge of the server energy profile, the complexity of the algorithm is based on the sorting complexity of the servers energy profiles, which isO(m2)to sortmservers [31]. However, the power profile for cloud-computing data center servers are avail-able. The energy profile sorting can be done prior to the server’s activation for function. Therefore, the complex-ity of the MESF task scheduling scheme is reduced to insertion of a sorted list, which has a time complexity of
O(m log(m))[31].
Stability analysis of MESF
We first defineQ(t)as queue occupancy matrix for all task queues at time slott, where
Q(t):=
⎧ ⎪ ⎨ ⎪ ⎩
x1,1(t) · · · x1,M(t) ..
. ... ... xN,1(t) · · · xN,M(t)
⎫ ⎪ ⎬ ⎪ ⎭
Here, xi,j(t) is an independent and identically dis-tributed (i.i.d.) random variable of task typeiassigned to serverjat time slott.
The queue occupancy at time slot,tin a given server, is
Q(t)=Q(t−1)+R(t−1)−L(t−1) (16) whereR(t) is the matrix of packet arrivals at time slott, L(t)is the matrix of the tasks serviced at time slott.
Given that,
Q(1) =Q(0)+R(0)−L(0) Q(2) =Q(1)+R(1)−L(1)
=Q(0)+R(0)−L(0)+R(1)−L(1) ..
.
Q(t) =Q(0)+ t
k=0
[R(k)−L(k)]
(17)
where,
L(k) =min(Q(k)+R(k),q)
=1
2
Q(k)+R(k)+q− 1
2Q(k)+R(k)−q
Here, the task-service matrix, L(k), is defined by the proposed task-scheduling scheme and the response dead-line, q = τt
i,j. The scheduler allocates a task based on
the minimum of the task deadline and the server queue length. If the task deadline is smaller than the waiting time in the server queue, the task will be placed to a server that meets the deadline constraint.
SubstitutingL(t−1)in from (16) with (17),Q(t)can be written as
Q(t) =Q(t−1)+R(t−1)−L(t−1)
=Q(t−1)+R(t−1)−1
2[Q(t−1)+ R(t−1)+q+ 1
2Q(t−1)+R(t−1)−q
=1
2
Q(t−1)+R(t−1)−q+ 1
2Q(t−1)+R(t−1)−q
=1
2
ft−1+ |ft−1|
(18)
where
ft−1=Q(t−1)+R(t−1)−q. Ifft>0,Q(t)=ft−1>0,
Q(t)=Q(0)+ t
k=1
R(k)−tq>0
⇒
t
k=1 R(k)
t >q− Q(0)
t .
WhenQ(t)→ ∞, asn→ ∞, the system is unstable, or t
k=1
R(k)−tq→ ∞ ast→ ∞.
Therefore, the condition for the system to be unstable is t
k=1 R(k)
t >q.
The system is considered weakly stable whenQ(t) =0, not necessarily consecutively but not exclusively repeti-tive, astgoes to infinity, which is
lim
t→∞infQ(t)=0.
Equivalently, the condition for the system to be weakly stable is lim t→∞ t k=1 R(i)
t ≤q.
Evaluation of stability of the proposed task scheduling scheme
We performed an evaluation of a data center under i.i.d. task arrivals following an exponential distribution, with a mean of 10 tasks. We evaluated the mean response time for different task egress rates. The egress rate is the rate at which tasks leave the data center. The rate depends on the number of servers providing the service, processing time, and task load. Figure 3 shows the average queue length of the proposed scheduler. The arrow in the figure points to where the average delay decreases significantly (as the slope starts approaching to zero, or critical minimum); the slope between task egress rate 10 and 11. Note that smaller task egress rates produce larger queue lengths. This backlogging of tasks may lead to instability.
Figure 3Average queue length under task arrivals with exponential distribution.
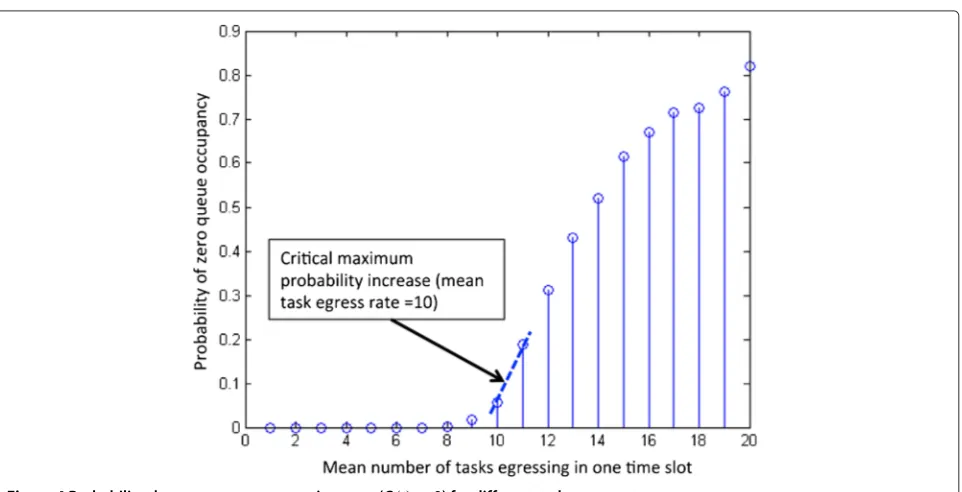
rates. The figure shows that the probability increases for this event if the task egress rate is equal to or larger than 10 (again, we refer to the slope formed by rates of 10 and 11, but now in Figure 4).
Simulation results
In this section, we present the performance evaluation of the proposed MESF task-scheduling scheme. We modeled
a data center with a central scheduler and a number of servers in Matlab to evaluate the energy consumption through computing simulation. We simulated the pro-posed greedy algorithm under homogenous (V = 1) and exponentially-distributed task arrivals, with a mean of n=1000 tasks and random server profiles. We measured the average task-response time and total energy consumed with respect to the number of servers available to handle the tasks.
Figure 5Average response time vs. number of servers.
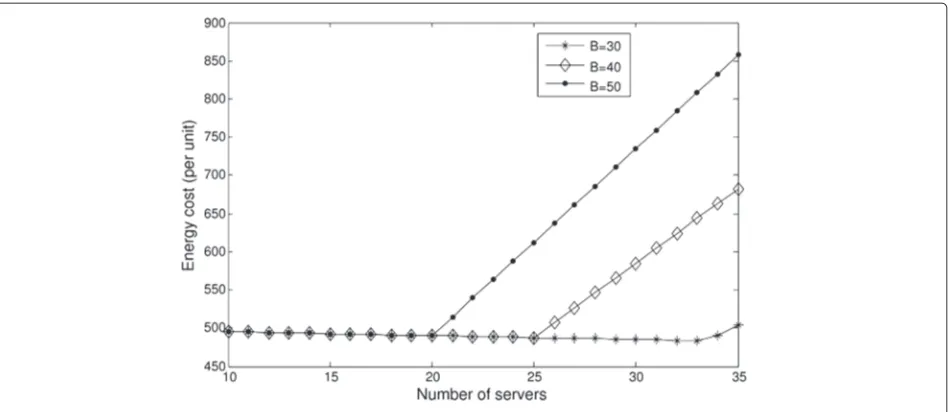
Figure 5 shows the average task response time for dif-ferent queueing capacities. We set B = {30, 40, 50} in our simulation, which is also the maximum response time constraint of tasks. As the number of servers increases, the average task response time decreases. However, the response time stops decreasing when 34, 25, and 20 servers are available in a data center for a queue capacity of 50, 40, and 30 tasks, respectively. The reason for this is that the tasks are serviced by the 34, 25, and 20 servers, respec-tively, under these conditions and additional servers don’t contribute to the service as task are fully allocated. In fact, the larger the server capacity, the smaller the number of
servers required to reach the minimum response time. This relationship remains as long as the servers comply with the constrained task response time. Therefore, the number of servers is bounded to M = {34, 25, 20} for B= {30, 40, 50}, respectively.
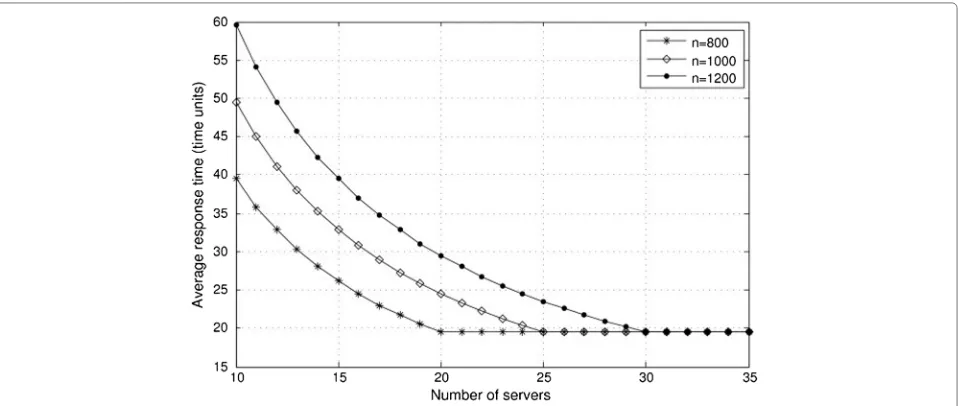
We also evaluated the average task response time under different input loads, the tasks arrivals with mean n =
{800, 1000, 1200}and a server queueing capacity ofB = 40. Figure 6 shows the average response time for differ-ent numbers of servers and differdiffer-ent loads (i.e., differdiffer-ent number of tasks). As the number of tasks (n) increases, the number of servers required to keep the average response
Figure 7Energy vs. number of servers.
time within the bound also increases. This shows the trade-off between the number of servers and the obtained response time.
We evaluated the energy consumption of our proposed MESF scheduling scheme, in function of the number of servers. Figure 7 shows the amount of energy consumed versus the number of servers forn =1000. As the figure shows, the amount of energy reduces slightly as the num-ber of servers increases until reaching a bound, M =
{20, 25, 33} forB = {30, 40, 50}, respectively. The simu-lation results show the proposed MESF scheme achieves minimum average task response time, which is bounded by the capacities of the queues, and at the same time,
minimum energy consumption for a given number of servers,M.
We also modeled and simulated a data center using a random-based task-scheduling scheme [32] to compare the performance of the random-based and the MESF schemes. The random-based task-scheduling scheme assigns tasks to servers on a random basis and without constraints, except for available queue at each server, for task allocation or server selection. We simulated both schemes using 20 task types (V = 20) and exponen-tially distributed task arrivals. Here, we consider that the different types of tasks can be decomposed into a lin-ear combination of a unit task type. Tasks of the same
Figure 9Histogram of total task response time for the MESF and random scheduling schemes.
type have the same response time constraint, which is equivalent to the queueing capacity for each type. To simplify the comparison, we set the same response time constraint for all task types in these experiments. We evaluated 1000 experiments (one experiment is a task allo-cation trial with a duration of sufficient events to allow the distribution of the task to complete) for each scheduling scheme.
Figure 8 presents the histogram of the energy consump-tion of both schemes. We represent energy consumpconsump-tion in general energy units (units of power can be converted to Watts, for instance 1 unit =10 W) in the following figures. The energy savings achieved with the proposed schedul-ing scheme are between 6× 10⁵ and 4.7× 10⁶ energy units. This is the result of having heterogeneous servers; servers with different power profile. This histogram shows
the impact on energy consumption by the different task-scheduling schemes. Specifically, the energy distribution shows that our proposed scheme consumes less energy than the random-based scheme. In addition, the distribu-tion of the random-based scheme presents a distribudistribu-tion around the mean with large deviations while the MESF scheme shows a very tight distribution; meaning that most task and server assignments result in energy sav-ings. This occurs as the proposed scheme assigns tasks to the most efficient servers and no new servers are assigned unless the number of servers may not be enough to serve tasks on time or else, the server capacity is reached. In the random-based scheme, servers may be assigned to a small number of tasks and higher level of parallelism may be achieved; however, at the cost of higher energy expenditure.
Table 2 Performance comparison of MESF- and random-scheduling schemes
Task scheduling Average task Total task Total energy
scheme response time response time consumption
(time units) (time units) (energy units)
MESF 472.6 4.83E+05 2.597E+04
Random 123.9 1.33E+05 1.989E+06
Figure 9 shows the histogram of the total (cumula-tive) task response time for the MESF and random task-scheduling schemes. We use a generic time unit, which can be converted to μs, or any other specific unit. The figure shows that the random-based scheme has a smaller total task response time than the proposed scheme. This is expected as the random-based scheme selects a larger number of servers to process the tasks. The larger devi-ation in the distribution of the response time for the proposed scheme may be caused by the queueing dynam-ics because more tasks are queued for process. The small deviation for the random-based scheme indicates a small fluctuation in queue length where the queue occupancy of a server is small (or zero). The random-based scheme keeps the response time small but at the expense of using a large number of servers on active state and there-fore, a large energy consumption. On the other hand, the MESF scheduling algorithm uses longer processing time as the algorithm attempts to use the smallest number of servers, and in turn, minimizes the amount of energy con-sumed. More importantly, although not obviously shown in this figure, the task response time of the proposed task-scheduling scheme is bounded.
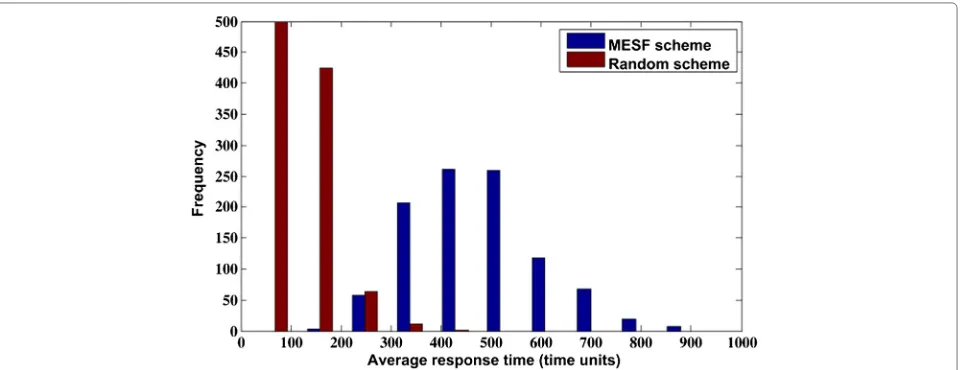
Figure 10 shows the average task response time (total task response time divided by the number of tasks) and its histogram for the proposed task-scheduling scheme and random-based task-scheduling scheme. The average response times of the two schemes follow similar trends as in the total response time; the average response time of the proposed scheme is larger than that achieved by the random-based scheme. This is because the same number of tasks is processed by both schemes.
Table 2 summarizes the results of average task response time, total task response time, and total energy con-sumption (all in generic units) of the MESF and random task-scheduling schemes. The total amount of energy con-sumed by the MESF and random scheduling schemes are 2.597E+04 and 1.98E+06 energy units, respectively. The energy savings achieved by the MESF scheduling scheme is over 70 times that of the random task-scheduling scheme. The cost of achieving these savings is the addi-tional response time the MESF scheduling scheme takes (472.6 time units on average) as compared to that of the random scheduling scheme (123.9 time units on aver-age). However, the response time of the MESF scheduling scheme is within the response time constraints.
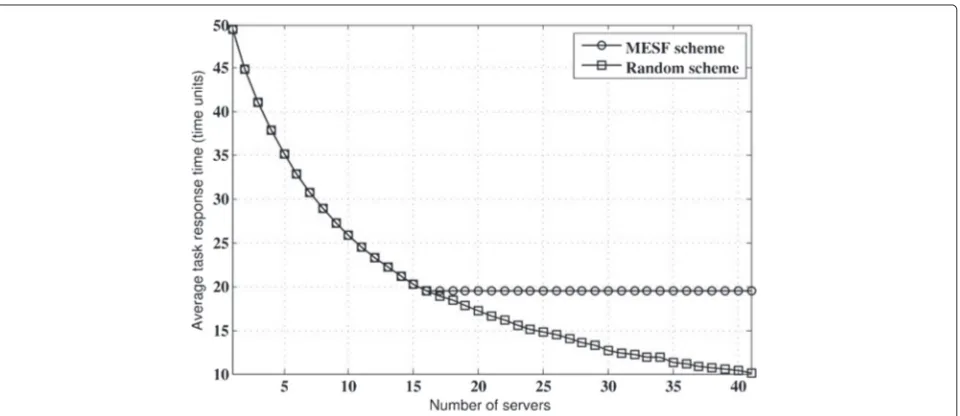
In addition, we evaluated the average response time, in function of the number of servers in the data cen-ter, achieved by both schemes. Again, task arrivals are exponentially distributed, with a mean of 1000 tasks, and server capacity is capped to, B = 40. Figure 11 shows the average task response time of both schemes. As for the random scheduling scheme, the average task response time decreases as the number of servers increases, until the ratio between servers and task becomes 1:1 (one task per server), for which the number of servers, and
therefore, the energy consumption are too large. On the other hand, the average response time of the MESF scheduling scheme decreases as the number of servers increases. Once the number of servers reaches the opti-mum number, tasks are handled within the constrained task response time. In this case, increasing the num-ber of servers beyond the optimum numnum-ber provides no additional benefit. Therefore, turning off unnecessary servers reduces energy consumption. On the other hand, the larger number of servers used by the random-based scheme results in larger energy consumption and resource over-provisioning.
Conclusions
In this paper, we formulated the task assignment for a data center as an integer programming optimization problem and proved the average task response time is bounded with an optimized number of active servers. We proposed a greedy task-scheduling scheme, the most-efficient-server-first scheduling, to reduce energy con-sumption of data center servers. The proposed MESF scheduling scheme schedules tasks to the most energy-efficient servers of a data center. This scheme minimizes the average task response time and, at the same time, min-imizes the server-related energy expenditure. We showed that the system using MESF is weakly stable under i.i.d. task arrivals with an exponential distribution. We eval-uated and compared the performance of the proposed scheme with that of a random-based task-scheduling scheme using Matlab simulation. Our simulation results show that a data center using the proposed MESF task-scheduling scheme saves on average over 70 times that of a data center using a random-based task-scheduling scheme. The proposed scheme saves energy at the cost of longer task response times, albeit within the maximum constraint.
Competing interests
The authors declare that they have no competing interests.
Authors’ contributions
ZD, NL, and RRC conducted the design, analysis, and experiments of the most-efficient-server-first scheduling scheme. ZD and RRC drafted the manuscript. All authors read and approved the final manuscript.
Authors’ information
The work was conducted when Ning Liu was with New Jersey Institute of Technology.
Acknowledgments
The authors would like to thank the anonymous reviewers for their insightful comments and suggestions on improving this paper.
Author details
1Department of Electrical and Computer Engineering, New York Institute of Technology, 1855 Broadway, New York, NY 10023, USA.2Department of Mathematics, University of California, Davis, Davis Gunrock, CA, USA. 3Networking Research Laboratory, Department of Electrical and Computer Engineering, New Jersey Institute of Technology, University Heights, Newark, NJ 07102, USA.
Received: 22 October 2014 Accepted: 23 February 2015
References
1. Miller R New Numbers: Who has the most web servers? http://www. datacenterknowledge.com/archives/2013/07/15/new-numbers-who-has-the-most-web-servers/
2. Calheiros RN, Ranjan R, Buyya R (2011) Virtual machine provisioning based on analytical performance and qos in cloud computing environments. In: Parallel Processing (ICPP), 2011 International Conference On. IEEE, Taipei, Taiwan. pp 295–304
3. Patel CD, Shah AJ (2005) Cost Model for Planning, Development and Operation of a Data Center. http://www.hpl.hp.com/techreports/2005/ HPL-2005-107R1.pdf
4. Baliga J, Ayre RWA, Hinton K, Tucker RS (2011) Green cloud computing: balancing energy in processing, storage, and transport. In: Proceedings of the IEEE, vol. 99. pp 149–167
5. Energy Logic: Reducing Data Center Energy Consumption by Creating Savings that Cascade Across Systems. A White Paper from Experts in Business-Critical Continuity. http://www.emersonnetworkpower.com/ documentation/en-us/latest-thinking/edc/documents/white paper/ energylogicreducingdatacenterenergyconsumption.pdf
6. Brown R, Masanet E, Nordman B, Tschudi B, Shehabi A, Stanley J,et al (2008) Report to congress on server and data center energy efficiency: Public law 109-431. National Laboratory, Lawrence, Berkeley. https:// escholarship.org/uc/item/74g2r0vg#page-1
7. Berral JL, Goiri Í, Nou R, Julià F, Guitart J, Gavaldà R, Torres J (2010) Towards energy-aware scheduling in data centers using machine learning. In: Proceedings of the 1st, International Conference on energy-Efficient Computing and Networking. ACM, New York, NY, USA. pp 215–224 8. Bohra AEH, Chaudhary V (2010) Vmeter: Power modelling for virtualized
clouds. In: Parallel Distributed Processing, Workshops and Phd Forum (IPDPSW), 2010 IEEE International Symposium On. IEEE, Atlanta, GA, USA. pp 1–8
9. Goiri I, Julia F, Nou R, Berral JL, Guitart J, Torres J (2010) Energy-aware scheduling in virtualized datacenters. In: Cluster Computing (CLUSTER), 2010 IEEE International Conference On. IEEE, Heraklion, Crete, Greece. pp 58–67
10. Beloglazov A, Buyya R (2010) Energy efficient resource management in virtualized cloud data centers. In: Proceedings of the 2010 10th IEEE/ACM International Conference on Cluster, Cloud and Grid Computing. IEEE Computer Society, Washington, DC, USA. pp 826–831
11. Raghavendra R, Ranganathan P, Talwar V, Wang Z, Zhu X (2008) No “power” struggles: coordinated multi-level power management for the data center. In: Proceedings of the 13th International Conference on Architectural Support for Programming Languages and Operating Systems. ASPLOS XIII. ACM, New York, NY, USA. pp 48–59
12. Zhang Q, Cheng L, Boutaba R (2010) Cloud computing: state-of-the-art and research challenges. J Internet Serv Appl 1(1):7–18
13. Glanz J (2012) Power, Pollution and the, Internet. The New York Times, Vol. 22. http://www.nytimes.com/2012/09/23/technology/data-centers-waste-vast-amounts-of-energy-belying-industry-image.html 14. Mahadevan P, Sharma P, Banerjee S, Ranganathan P (2009) Energy aware
network operations. In: INFOCOM Workshops 2009. IEEE, Rio de Janeiro, Brazil. pp 1–6
15. Buyya R, Beloglazov A, Abawajy J (2010) Energy-efficient management of data center resources for cloud computing: A vision, architectural elements, and open challenges. In: arXiv preprint arXiv:1006.0308. http:// arxiv.org/abs/1006.0308
16. Beloglazov A, Abawajy J, Buyya R (2010) Energy-aware resource allocation heuristics for efficient management of data centers for cloud computing. Future Generation Comput Syst 28(5):755–768
17. Xu Y, Rojas-Cessa R, Grebel H (2012) Allocation of discrete energy on a cloud-computing datacenter using a digital power grid. In: Green Computing and Communications (GreenCom), 2012 IEEE International Conference On. IEEE, Besancon, France. pp 615–618
18. Beloglazov A, Buyya R (2010) Energy efficient allocation of virtual machines in cloud data centers. In: Cluster, Cloud and Grid Computing (CCGrid), 2010 10th IEEE/ACM International Conference On. IEEE. pp 577–578 19. Rojas-Cessa R, Pessima S, Tian T (2012) Experimental evaluation of energy
20. Papagianni C, Leivadeas A, Papavassiliou S, Maglaris V, Cervello-Pastor C, Monje A (2013) On the optimal allocation of virtual resources in cloud computing networks. Comput IEEE Trans 62(6):1060–1071
21. Al-Fares M, Loukissas A, Vahdat A (2008) A scalable, commodity data center network architecture. In: ACM SIGCOMM Computer Communication Review, vol. 38. ACM, New York, NY, USA. pp 63–74 22. Greenberg A, Hamilton JR, Jain N, Kandula S, Kim C, Lahiri P, Maltz DA,
Patel P, Sengupta S (2009) Vl2: a scalable and flexible data center network. In: ACM SIGCOMM Computer Communication Review, vol. 39. ACM, New York, NY, USA. pp 51–62
23. Niranjan Mysore R, Pamboris A, Farrington N, Huang N, Miri P,
Radhakrishnan S, Subramanya V, Vahdat A (2009) Portland: a scalable fault-tolerant layer 2 data center network fabric. In: ACM SIGCOMM Computer Communication Review, vol. 39. ACM, New York, NY, USA. pp 39–50 24. Dong Z, Rojas-Cessa R, Oki E (2011) Memory-memory-memory
clos-network packet switches with in-sequence service. In: High Performance Switching and Routing (HPSR), 2011 IEEE 12th International Conference On. IEEE, Cartagena, Spain. pp 121–125
25. Dong Z, Rojas-Cessa R (2012) MCS: buffered Clos-network switch with in-sequence packet forwarding. In: Sarnoff Symposium (SARNOFF), 2012 35th IEEE. IEEE, Newark, NJ, USA. pp 1–6
26. Reiss C, Wilkes J, Hellerstein JL (2011) Google cluster-usage traces: format + schema. Technical report, Google, Inc, Mountain View, CA, USA. http:// code.google.com/p/googleclusterdata/wiki/TraceVersion2
27. Reiss C, Tumanov A, Ganger GR, Katz RH, Kozuch MA (2012)
Heterogeneity and dynamicity of clouds at scale: Google trace analysis. In: ACM Symposium on Cloud Computing (SoCC). ACM, San Jose, CA, USA. http://www.pdl.cmu.edu/PDL-FTP/CloudComputing/googletrace-socc2012.pdf
28. Liu Z, Cho S (2012) Characterizing machines and workloads on a Google cluster. In: 8th International, Workshop on Scheduling and Resource Management for Parallel and Distributed Systems (SRMPDS’12). IEEE, Pittsburgh, PA, USA
29. DeCandia G, Hastorun D, Jampani M, Kakulapati G, Lakshman A, Pilchin A, Sivasubramanian S, Vosshall P, Vogels W (2007) Dynamo: amazon’s highly available key-value store. In: ACM SIGOPS Operating Systems Review, vol. 41. ACM, New York, NY, USA. pp 205–220
30. Tam ASW, Xi K, Chao HJ (2011) Use of devolved controllers in data center networks. In: Computer Communications Workshops (INFOCOM WKSHPS), 2011 IEEE Conference On. IEEE, Shanghai, China. pp 596–601 31. Cormen TH, Leiserson CE, Riverst RL, Stein C (2001) Introduction to
Algorithms. 2nd edn. The MIT Press, Cambridge, Massachusetts 32. Khan SU, Ahmad I (2006) Non-cooperative, semi-cooperative, and
cooperative games-based grid resource allocation. In: Parallel and Distributed Processing Symposium, 2006. IPDPS 2006. 20th International. IEEE, Rhodes Island, Greece. p 10
Submit your manuscript to a
journal and benefi t from:
7Convenient online submission
7 Rigorous peer review
7Immediate publication on acceptance
7 Open access: articles freely available online
7High visibility within the fi eld
7 Retaining the copyright to your article