R E S E A R C H A R T I C L E
Open Access
Identification of candidate genes for
myeloma-induced osteocyte death based
on microarray data
Honglai Tian
Abstract
Background:The study was aimed to investigate the molecular mechanisms of osteocyte death in multiple
myeloma (MM) patients.
Methods:GSE27372 was downloaded from Gene Expression Omnibus, including three HOB-01 (osteocyte cell line)
control samples and three HOB-01 samples co-cultured with JJN3 (human MM cell line). After the differentially expressed genes (DEGs) were identified by Student’sttest method, enrichment analyses were performed for them using DAVID software. Using TRANSFAC, TSGene, and tumor-associated gene (TAG) databases, functional annotation was conducted for the DEGs. Additionally, protein-protein interaction (PPI) network and sub-network analyses were performed using STRING database and Cytoscape software.
Results:Total 393 DEGs were identified, including 22 transcription factors (e.g.,KLF4andIRF8) and 37 TAGs. Enrichment analysis suggested thatEGF,S1PR1, andNPY1Rwere enriched in the function of circulatory system development. EGF (degree = 31) and EGR1 (degree = 19) had high degrees and interactions in the PPI network. In the sub-network, S1PR1, C3AR1, and NPY1R could interact with each other.
Conclusions:These DEGs might participate in the osteocyte apoptosis induced by myeloma cells. These findings
might provide a theoretical basis for a better understanding of the osteolysis in MM patients.
Keywords:Multiple myeloma, Osteocyte, Differentially expressed genes, Enrichment analysis, Protein-protein interaction network
Background
Multiple myeloma (MM) originates in neoplastic plasma cell disorder, and it is characterized by the clonal prolif-eration of malignant plasma cells in the bone marrow. As the second most general hematological cancer, the incidence of MM worldwide is about 1.5/100,000 new case [1]. It is also found that the incidence of MM is higher in men than in women, as well as in black than white in the USA [2]. MM is always associated with organ dysfunction, especially osteolysis [3]. Although the survival rate of MM patients is increased due to the ad-vanced medicines [4], MM continues to be considered as an incurable disease, and further study is required to
fully understand the potential molecular mechanisms of osteolysis in MM patients.
To adopt a volume appropriate for the local environ-ment, the bone continuously remodels to keep the bal-ance between bone formation and resorption mediated by osteocytes, osteoblasts, and osteoclasts [5]. Osteocyte represents the most abundant cell type in the bone and is actively involved in bone turnover. Dickkopf 1(DKK1) levels increase in the peripheral blood and bone marrow plasma of MM patients and relate to the development of osteolytic lesions [6, 7]. Tumor necrosis factor-related apoptosis-inducing ligand (TRAIL) produced by mye-loma cells is positively correlated with osteolytic markers (such as urinary deoxypyridinoline and serum calcium), indicating thatTRAILmay function in osteolysis of MM patients [8]. Via promoting the expression of receptor activator of NF-kB (RANK) in osteoclast precursors,
Correspondence:[email protected]
Department of Orthopaedics, Qilu Hospital of Shandong University, No. 42 Wenhua West Road, Jinan 250012, China
c-Akt (AKT) plays a role in the osteoclast formation and bone osteolysis induced by MM [9]. Giuliani et al. found that MM cells promoted osteocyte death and altered the transcriptional profile in osteocyte [10]. However, they did not further perform comprehensive bioinformatics analysis to investigate the internal causes. In spite of the above researches, the molecular mechanism of the in-creased osteocyte death in MM patients is still unclear.
In our study, in order to investigate the molecular mechanism of osteocyte death in MM patients, we rea-nalyzed the gene expression profile in Giuliani et al. study and identified the differentially expressed genes (DEGs) between normal osteocytes and osteocytes af-fected by MM cells. The enriched functions and path-ways of DEGs were further identified. In addition, we constructed the protein-protein interaction (PPI) net-work of DEGs. Then, the most significant sub-netnet-work was screened out.
Methods
Affymetrix microarray data
Gene transcriptional profile of GSE27372 [10] was down-loaded from Gene Expression Omnibus (GEO) database (https://www.ncbi.nlm.nih.gov/geo/), and GSE27372 was based on the platform of GPL570 [HG-U133_Plus_2] Affymetrix Human Genome U133 Plus 2.0 array. There
were six specimens in this dataset, including three HOB-01 (osteocyte cell line) control samples and three HOB-HOB-01 samples co-cultured with JJN3 (human myeloma cell line).
DEGs screening
AFFY package (version 1.28.0, http://www.bioconductor. org/packages/release/bioc/html/affy.html) of Bioconduc-tor [11] was used to pre-process the Affymetrix micro-array data. All raw data were scaled according to the robust multi-array average (RMA) method [12] with de-fault settings. After background correction, quantile normalization, and probe summarization, the gene ex-pression matrix was obtained. The Student’s t test method [13] was adopted to analyze the expression dif-ferences between control and co-culture group. For each significant DEG, both Pvalue <0.05 and |log2fold
change (FC)| >0.58 need to be met.
Function and pathway enrichment analyses of DEGs Functional annotation for DEGs was performed by Gene Ontology [14]. Kyoto Encyclopedia of Genes and Ge-nomes (KEGG http://www.genome.jp/kegg/pathway.html) pathway enrichment analysis was used to identify main functional and metabolic pathways involving DEGs. We usedPvalue <0.01 as the cut-off criterion for the enrich-ment analysis which was conducted by the Database for
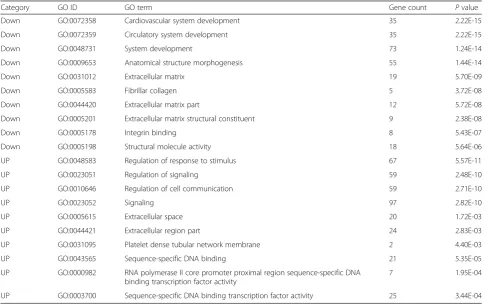
Table 1Function enrichment analysis of DEGs
Category GO ID GO term Gene count Pvalue
Down GO:0072358 Cardiovascular system development 35 2.22E-15
Down GO:0072359 Circulatory system development 35 2.22E-15
Down GO:0048731 System development 73 1.24E-14
Down GO:0009653 Anatomical structure morphogenesis 55 1.44E-14
Down GO:0031012 Extracellular matrix 19 5.70E-09
Down GO:0005583 Fibrillar collagen 5 3.72E-08
Down GO:0044420 Extracellular matrix part 12 5.72E-08
Down GO:0005201 Extracellular matrix structural constituent 9 2.38E-08
Down GO:0005178 Integrin binding 8 5.43E-07
Down GO:0005198 Structural molecule activity 18 5.64E-06
UP GO:0048583 Regulation of response to stimulus 67 5.57E-11
UP GO:0023051 Regulation of signaling 59 2.48E-10
UP GO:0010646 Regulation of cell communication 59 2.71E-10
UP GO:0023052 Signaling 97 2.82E-10
UP GO:0005615 Extracellular space 20 1.72E-03
UP GO:0044421 Extracellular region part 24 2.83E-03
UP GO:0031095 Platelet dense tubular network membrane 2 4.40E-03
UP GO:0043565 Sequence-specific DNA binding 21 5.35E-05
UP GO:0000982 RNA polymerase II core promoter proximal region sequence-specific DNA binding transcription factor activity
7 1.95E-04
UP GO:0003700 Sequence-specific DNA binding transcription factor activity 25 3.44E-04
Annotation, Visualization and Integrated Discovery (DA-VID; version 2.1b, http://david.abcc.ncifcrf.gov/) online software [15].
Transcription factors (TFs) and tumor-associated genes (TAGs) in DEGs
DEGs with the function of transcriptional regulation, namely, differentially expressed transcription factors were selected based on the TRANSFAC database (http:// www.gene-regulation.com/pub/databases.html) [16]. Ac-cording to the TSGene database (http://bioinfo.mc. vanderbilt.edu/TSGene/search.cgi) [17] and TAG database (http://www.binfo.ncku.edu.tw/TAG/) [18], we extracted the TAGs from DEGs, including tumor suppressor genes and oncogenes.
Construction of PPI network and sub-network
The interaction pairs of DEGs were analyzed via online tool Search Tool for the Retrieval of Interacting Genes (STRING; version 9.0, http://string-db.org) [19], and
interaction data were downloaded on June 27, 2014. Only the gene pairs which were recorded in database, and experimental validated, text-mined, or co-expressed were used and combined score >0.4 was set as the criter-ion of PPI. Then, the PPI network was constructed using Cytoscape (version 2.8, http://cytoscape.org) [20].
The sub-network analysis of PPI network was per-formed using the ClusterONE plug of Cytoscape [21]. The pathway enrichment analysis of the genes in the most significant sub-network was performed by using the DAVID online software [15].
Results
MM-induced DEGs in osteocytes
After analyzing the microarray data of control and co-culture groups, a total of 393 DEGs were screened out, including 167 down-regulated genes and 226 up-regulated genes in co-culture group.
Functions and pathways enriched by DEGs
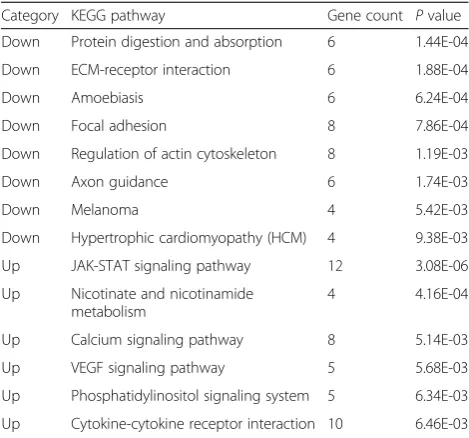
To explore the specific functions and pathways of DEGs, functional and pathway enrichment analyses were per-formed. The down-regulated genes were most signifi-cantly enriched in the functions of cardiovascular system development, circulatory system development (Table 1), and the pathways of protein digestion, absorption, and extracellular matrix (ECM)-receptor interaction path-way (Table 2). Especially, epidermal growth factor (EGF), sphingosine-1-phosphate receptor 1 (S1PR1), and Neuropeptide Y1 receptor (NPY1R) were involved in circulatory system development. Moreover, the up-regulated genes were most significantly enriched in the functions of regulation of response to stimulus and regulation of signaling function (Table 1), as well as the pathways of JAK-STAT signaling, nicotinate, and nico-tinamide metabolism (Table 2).
Differentially expressed TFs and TAGs
The TFs and TAGs differentially expressed between control and co-culture groups were further extracted from DEGs. As shown in Table 3, four down-regulated TFs and 18 up-down-regulated TFs (e.g.,
Krüppel-Table 2Pathway enrichment analysis of DEGs
Category KEGG pathway Gene count Pvalue
Down Protein digestion and absorption 6 1.44E-04
Down ECM-receptor interaction 6 1.88E-04
Down Amoebiasis 6 6.24E-04
Down Focal adhesion 8 7.86E-04
Down Regulation of actin cytoskeleton 8 1.19E-03
Down Axon guidance 6 1.74E-03
Down Melanoma 4 5.42E-03
Down Hypertrophic cardiomyopathy (HCM) 4 9.38E-03
Up JAK-STAT signaling pathway 12 3.08E-06
Up Nicotinate and nicotinamide metabolism
4 4.16E-04
Up Calcium signaling pathway 8 5.14E-03
Up VEGF signaling pathway 5 5.68E-03
Up Phosphatidylinositol signaling system 5 6.34E-03
Up Cytokine-cytokine receptor interaction 10 6.46E-03
KEGGKyoto Encyclopedia of Genes and Genomes;DEGsdifferentially expressed genes
Table 3Differentially expressed TFs and TAGs
Regulation TF counts
TFs TAG
counts
Oncogenes Tumor suppressor genes Other TAGs
Down 4 TGFB1I1, NKX2-2, KLF5, ID2 16 RUNX1T1, PDGFRB,
CD24
TPM1, SPTBN1,PRICKLE1, KLF5, IGFBP3, FAT4,EFNA1, DNAJB4, DAB2, CADM1
TGFB2, LRRC17, BAMBI
Up 18 SOX9, SOX7, NR3C2, MSX1, MAFF, KLF4, JUNB, IRF8, HOXB6, HMGA2, HES1, OXF1, FOXA2, ETV5, ETV4, ELK3, EGR3, EGR1
21 VEGFA, SPHK1, PDGFRA, JUNB, HMGA2, FOSL1, FGF5, ETV1, CCND1
SPRY2, SOX7, IRF8, IL24, HOPX, FOXA2, EPHB2, ENC1, EGR1, DUSP6
KLF4, EMP1
like factors 4, KLF4; and IFN regulatory factor-8,
IRF8) were discovered.
Furthermore, 16 down-regulated TAGs and 21 up-regulated TAGs were screened out (Table 3). Among the down-regulated TAGs, there were 10 tumor suppressor genes and 3 oncogenes. Meanwhile, among the up-regulated TAGs, there were 10 tumor suppressor genes (e.g.IRF8) and 9 oncogenes.
Construction of PPI network and sub-network
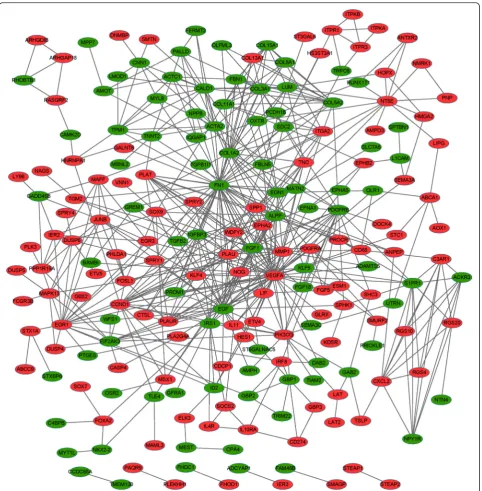
Interactions between DEGs were identified using STRING software. By integrating DEG pairs with combined score >0.4, a PPI network was built (Fig. 1), consisting of 89 down-regulated genes and 113 up-regulated genes. A total of 10 DEGs had con-nectivity degree larger than 15, e.g., EGF (degree = 31) and early growth response 1 (EGR1, degree = 19).
Besides, EGF could interact with EGR1 in the PPI network.
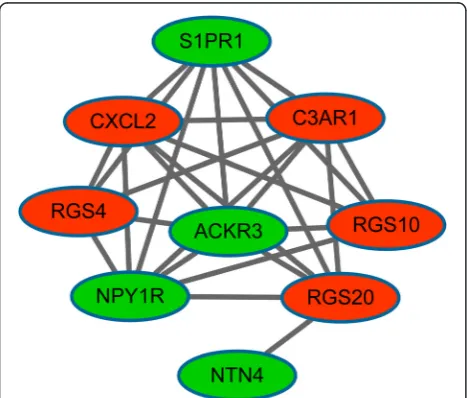
Moreover, a sub-network was obtained from PPI net-work (P value = 0.0004.3) (Fig. 2), consisting of nine sig-nificant DEGs like S1PR1, complement-3a receptor1 (C3AR1), and NPY1R. In the sub-network, S1PR1, C3AR1, and NPY1R had interactions with each other. Furthermore, the up-regulated C3AR1, as well as the down-regulated S1PR1 and NPY1R in the sub-network were enriched in the neuroactive ligand-receptor inter-action pathway (Table 4).
Discussion
To gain insight into the molecular mechanisms of the myeloma-induced osteocyte death, gene expression pro-files in osteocytes co-cultured with or without myeloma cells were systematically analyzed here. A total of 226 up-regulated genes and 167 down-regulated genes were identified. Then, PPI network was constructed, and sub-network was identified.
TFs like KLF4 and IRF8 were up-regulated in osteo-cytes co-cultured with myeloma cells in comparison with osteocytes cultured alone. Previous study reported that
KLF4 expression is essential for blocking cell cycle and increasing the resistance of MM cells to alkylating agents [22]. As one of the Yamanaka reprogramming fac-tors and TFs, KLF4 can promote the expression of autophagy-related genes [23]. In addition, silencing of the interferon consensus sequence-binding protein (ICSBP/IRF8) gene may be induced by DNA methylation or other mechanisms and correlates with the malignant phenotype of MM [24]. In our study, KLF4 and IRF8 were up-regulated TFs, and IRF8 was a tumor
suppressor gene. These suggested that KLF4 and IRF8 might play a role in osteolysis in MM patients.
In this study, EGF and EGR1 had high connectivity degrees in PPI network. A heparin-binding factor in EGF family, amphiregulin (AREG) is overexpressed in primary myeloma cells and can promote growth of bone marrow stromal cell [25]. EGR-1 induces apop-tosis in MM via interacting with JUN, and decreased
JUN/EGR-1 can enhance resistance of MM cells to
bortezomib [26]. Functional enrichment indicated that
EGF was involved in circulatory system development. It has been reported that the substances of the circula-tory system can induce the apoptosis of tumor cells [27]. EGF could interact with EGR1 in the PPI net-work, indicating thatEGFandEGR1might be involved in osteocytes apoptosis induced by MM cells through interacting with each other.
Enrichment analysis suggested that S1PR1, C3AR1,
and NPY1R in sub-network were enriched in the
pathway of neuroactive ligand-receptor interaction, meanwhile S1PR1 and NPY1R were involved in the function of circulatory system development. S1PR1 is a G-protein-coupled receptor which binds to the bio-active signaling molecule sphingosine 1-phosphate (S1P) [28]. It is reported that S1PR1 and S1PR2 regu-late osteoclast precursor migration between the bone marrow cavities and the circulation [29]. It is shown that component 3 (C3A) and its receptor C3AR play a role in osteoclast formation [30, 31], implying a po-tential role of C3AR in osteocyte death. Thus, S1PR1 and C3AR1 may promote the death of osteocytes, and this is consistent with the finding of Giuliani et al. [10]. NPY1R is a receptor of neuropeptide Y (NPY), which is a neurotransmitter. There is evidence that
NPY regulates bone homeostasis via actions in periph-eral tissues [32]. NPY1R is the only Y receptor which is robustly expressed in bone marrow stromal cells [33] and osteoblasts [34], implying a direct role of
NPY1R in bone remodeling. In addition, the absence of peripheral Y1 receptor will lead to pronounced anabolic effects on the bone [35]. Here, NPY1R was significantly down-regulated in osteocytes co-cultured with myeloma cells, inhibiting bone remodeling. In the sub-network, S1PR1, C3AR1, and NPY1R had in-teractions with each other, suggesting that S1PR1,
C3AR1, and NPY1R might function in osteocytes
apoptosis induced by MM cells via interactions. Fig. 2Sub-network in the protein-protein interaction (PPI) network
of differentially expressed genes (DEGs).Redandgreen nodesstand for up-regulated genes and down-regulated genes, respectively
Table 4Pathways enriched by the genes in sub-network
KEGG pathway Gene
count
Pvalue Genes
Neuroactive ligand-receptor interaction
3 1.42E-02 C3AR1, S1PR1, NPY1R
Conclusions
In conclusion, a total of 393 DEGs were identified be-tween osteocytes co-cultured with and without myeloma cells, and KLF4, IRF8, EGF, EGR1, S1PR1, C3AR1, and
NPY1Rmight be involved in osteocyte cell apoptosis in-duced by MM cells. Here, we studied the potential mo-lecular mechanism of the increased osteocyte death, which may provide a theoretical basis for understanding and treatment of osteolysis in MM patients. However, the present study analyzed gene expression data gener-ated from not primary cells isolgener-ated from myeloma pa-tients and healthy controls but cell lines, and the sample size was small. Thus, confirmation of results by quanti-tative real-time polymerase chain reaction (qRT-PCR) in cell lines followed by the investigation of the roles and functions of candidate genes in cells isolated from MM patients and healthy controls is still needed.
Abbreviations
DEGs, differentially expressed genes; DKK1, Dickkopf 1; ECM, extracellular matrix; EGF, epidermal growth factor; KEGG, Kyoto Encyclopedia of Genes and Genomes; MM, multiple myeloma; NPY1R, neuropeptide Y1 receptor; PPI, protein-protein interaction; RMA, robust multi-array average; S1P, sphingosine 1-phosphate; S1PR1, sphingosine-1-phosphate receptor 1; STRING, Search Tool for the Retrieval of Interacting Genes; TAG, tumor-associated gene; TAGs, tumor-tumor-associated genes; TFs, transcription factors; TRAIL, tumor necrosis factor-related apoptosis-inducing ligand
Acknowledgements
This work was supported by special fund for medical service of Jilin finance department (No.: SCZSY201507).
Availability of data and materials
The dataset“Gene transcriptional profile of GSE27372”supporting the conclusions of this article can be downloaded from Gene Expression Omnibus (GEO) database (http://www.ncbi.nlm.nih.gov/geo/). GSE27372 was based on the platform of GPL570 [HG-U133_Plus_2] Affymetrix Human Genome U133 Plus 2.0 Array.
Authors’contributions
HT was responsible to the conception and design of the research, acquisition of data. obtaining funding, drafting the manuscript and revision of the manuscript for important intellectual content.
Competing interests
The author declares that they have no competing interests.
Ethics approval and consent to participate None.
Received: 26 May 2016 Accepted: 30 June 2016
References
1. Campa D, Martino A, Varkonyi J, Lesueur F, Jamroziak K, Landi S, Jurczyszyn A, Marques H, Andersen V, Jurado M. Risk of multiple myeloma is associated with polymorphisms within telomerase genes and telomere length. Int J Cancer. 2015;136:E351–E8.
2. Howlader N, Noone A, Krapcho M, Neyman N, Aminou R, Altekruse S, Kosary C, Ruhl J, Tatalovich Z, Cho H. SEER cancer statistics review, 1975– 2009 (vintage 2009 populations). Bethesda: National Cancer Institute; 2012. 3. Rajkumar SV. Multiple myeloma: 2011 update on diagnosis, risk‐stratification,
and management. Am J Hematol. 2011;86:57–65.
4. Bergsagel PL, Mateos M-V, Gutierrez NC, Rajkumar SV, San Miguel JF. Improving overall survival and overcoming adverse prognosis in the treatment of cytogenetically high-risk multiple myeloma. Blood. 2013;121:884–92.
5. Crockett JC, Rogers MJ, Coxon FP, Hocking LJ, Helfrich MH. Bone remodelling at a glance. J Cell Sci. 2011;124:991–8.
6. Tian E, Zhan F, Walker R, Rasmussen E, Ma Y, Barlogie B, Shaughnessy Jr JD. The role of the Wnt-signaling antagonist DKK1 in the development of osteolytic lesions in multiple myeloma. N England J Med. 2003;349:2483–94. 7. Kocemba KA, Groen R, Van Andel H, Kersten MJ, Mahtouk K, Spaargaren M,
Pals ST. Transcriptional silencing of the Wnt-antagonist DKK1 by promoter methylation is associated with enhanced Wnt signaling in advanced multiple myeloma. PLoS One. 2012;7:e30359.
8. Kawano Y, Ueno S, Abe M, Kikukawa Y, Yuki H, Iyama K, Okuno Y, Mitsuya H, Hata H. TRAIL produced from multiple myeloma cells is associated with osteolytic markers. Oncol Rep. 2012;27:39–44.
9. Cao H, Zhu K, Qiu L, Li S, Niu H, Hao M, Yang S, Zhao Z, Lai Y, Anderson JL. Critical role of AKT protein in myeloma-induced osteoclast formation and osteolysis. J Biol Chem. 2013;288:30399–410.
10. Giuliani N, Ferretti M, Bolzoni M, Storti P, Lazzaretti M, Dalla Palma B, Bonomini S, Martella E, Agnelli L, Neri A. Increased osteocyte death in multiple myeloma patients: role in myeloma-induced osteoclast formation. Leukemia. 2012;26:1391–401.
11. Gautier L, Cope L, Bolstad BM, Irizarry RA. affy—analysis of Affymetrix GeneChip data at the probe level. Bioinformatics. 2004;20:307–15. 12. Irizarry RA, Hobbs B, Collin F, Beazer‐Barclay YD, Antonellis KJ, Scherf U,
Speed TP. Exploration, normalization, and summaries of high density oligonucleotide array probe level data. Biostatistics. 2003;4:249–64. 13. Haynes W. Student’s t-test. Encyclopedia of systems biology. New York;
Springer; 2013; p. 2023–5.
14. Ashburner M, Ball CA, Blake JA, Botstein D, Butler H, Cherry JM, Davis AP, Dolinski K, Dwight SS, Eppig JT. Gene Ontology: tool for the unification of biology. Nat Genet. 2000;25:25–9.
15. Huang DW, Sherman BT, Lempicki RA. Systematic and integrative analysis of large gene lists using DAVID bioinformatics resources. Nat Protocols. 2008;4:44–57.
16. Matys V, Fricke E, Geffers R, Gößling E, Haubrock M, Hehl R, Hornischer K, Karas D, Kel AE, Kel-Margoulis OV. TRANSFAC®: transcriptional regulation, from patterns to profiles. Nucleic Acids Res. 2003;31:374–8.
17. Zhao M, Sun J, Zhao Z. TSGene: a web resource for tumor suppressor genes. Nucleic Acids Res. 2013;41:D970–D6.
18. Chen J-S, Hung W-S, Chan H-H, Tsai S-J, Sun HS. In silico identification of oncogenic potential of fyn-related kinase in hepatocellular carcinoma. Bioinformatics. 2013;29:420–7.
19. Franceschini A, Szklarczyk D, Frankild S, Kuhn M, Simonovic M, Roth A, Lin J, Minguez P, Bork P, von Mering C. STRING v9. 1: protein-protein interaction networks, with increased coverage and integration. Nucleic Acids Res. 2013;41:D808–D15.
20. Smoot ME, Ono K, Ruscheinski J, Wang P-L, Ideker T. Cytoscape 2.8: new features for data integration and network visualization. Bioinformatics. 2011; 27:431–2.
21. Demchak B, Hull T, Reich M, Liefeld T, Smoot M, Ideker T, Mesirov JP. Cytoscape: the network visualization tool for GenomeSpace workflows. F1000Research. 2014;3:151.
22. Schoenhals M, Kassambara A, Veyrune J-L, Moreaux J, Goldschmidt H, Hose D, Klein B. Krüppel-like factor 4 blocks tumor cell proliferation and promotes drug resistance in multiple myeloma. Haematologica. 2013;98:1442–9. 23. Riz I, Hawley TS, Hawley RG. KLF4-SQSTM1/p62-associated prosurvival autophagy contributes to carfilzomib resistance in multiple myeloma models. Oncotarget. 2015;6:14814.
24. Tshuikina M, Jernberg-Wiklund H, Nilsson K, Oberg F. Epigenetic silencing of the interferon regulatory factor ICSBP/IRF8 in human multiple myeloma. Exp Hematol. 2008;36:1673–81. e1.
25. Mahtouk K, Hose D, Rème T, De Vos J, Jourdan M, Moreaux J, Fiol G, Raab M, Jourdan E, Grau V. Expression of EGF-family receptors and amphiregulin in multiple myeloma. Amphiregulin is a growth factor for myeloma cells. Oncogene. 2005;24:3512–24.
26. Chen L, Wang S, Zhou Y, Wu X, Entin I, Epstein J, Yaccoby S, Xiong W, Barlogie B, Shaughnessy Jr JD. Identification of early growth response protein 1 (EGR-1) as a novel target for JUN-induced apoptosis in multiple myeloma. Blood. 2010;115:61–70.
27. Kulcsár G. Apoptosis of tumor cells induced by substances of the circulatory system. Cancer Biother Radiopharm. 1997;12:19–26.
29. Ishii M, Kikuta J. Sphingosine-1-phosphate signaling controlling osteoclasts and bone homeostasis. Biochimica et Biophysica Acta (BBA)-Molecular and Cell Biology of Lipids. 2013;1831:223–7.
30. Abe M, Hiura K, Wilde J, Shioyasono A, Moriyama K, Hashimoto T, Kido S, Oshima T, Shibata H, Ozaki S. Osteoclasts enhance myeloma cell growth and survival via cell-cell contact: a vicious cycle between bone destruction and myeloma expansion. Blood. 2004;104:2484–91.
31. Ignatius A, Schoengraf P, Kreja L, Liedert A, Recknagel S, Kandert S, Brenner RE, Schneider M, Lambris JD, Huber‐Lang M. Complement C3a and C5a modulate osteoclast formation and inflammatory response of osteoblasts in synergism with IL‐1β. J Cell Biochemistry. 2011;112:2594–605.
32. Sousa D, Herzog H, Lamghari M. NPY signalling pathway in bone homeostasis: Y1 receptor as a potential drug target. Current Drug Targets. 2009;10:9–19.
33. Lundberg P, Allison SJ, Lee NJ, Baldock PA, Brouard N, Rost S, Enriquez RF, Sainsbury A, Lamghari M, Simmons P. Greater bone formation of Y2 knockout mice is associated with increased osteoprogenitor numbers and altered Y1 receptor expression. Journal of Biological Chemistry. 2007;282:19082–91.
34. Teixeira L, Sousa DM, Nunes AF, Sousa MM, Herzog H, Lamghari M. NPY revealed as a critical modulator of osteoblast function in vitro: new insights into the role of Y1 and Y2 receptors. Journal of cellular biochemistry. 2009;107:908–16.
35. Lee NJ, Nguyen AD, Enriquez RF, Doyle KL, Sainsbury A, Baldock PA, Herzog H. Osteoblast specific Y1 receptor deletion enhances bone mass. Bone. 2011;48:461–7.
• We accept pre-submission inquiries
• Our selector tool helps you to find the most relevant journal • We provide round the clock customer support
• Convenient online submission • Thorough peer review
• Inclusion in PubMed and all major indexing services • Maximum visibility for your research
Submit your manuscript at www.biomedcentral.com/submit