Research article Available online www.ijsrr.org
ISSN: 2279–0543
International Journal of Scientific Research and Reviews
Study of Waste Water Characteristics and Bio-Solid Recovery in
Pudukottai District
Kanagalakshmi AS
1, Sharan Kumar K
2, Kavitha V
3and Sunitha R
4Department of civil engineering, Panimalar Engineering College,Varadharajhapuram, Nasarethpettai, Poonamallee, Chennai 600123, India
askv26@gmail. com, sksharan5@gmail. com, kavitha2014pecce115@gmail. com,
sunitharajendran1996@gmail. com
ABSTRACT
This Increase in population leads to increase in demands. Driven by environmental, economic and ecological benefits, resource recovery from waste water draws worldwide attention. Biotechnological processes offer an economic and versatile way to concentrate and transform resources from wastewater into valuable products, which is a prerequisite for the technological development of a cradle-to-cradle bio-based economy. There are many emerging technologies that enable resource recovery from waste water treatment cycle. Bioenergy can be obtained as well as bio solids which can be utilized for agricultural practice. As a result, vermiculture can also be introduced to reduce heavy metals. Anticipating the next generation of wastewater treatment plants driven by biological recovery technologies, this review is based on the generation and re-synthesis of energetic resources and key resources.
KEYWORDS
: Bioenergy, Cradle to Cradle bio based economy, characteristics of manure, Resource recovery, parameters of waste water.*Corresponding Author:
Dr. Kanagalakshmi AS
Department of civil engineering,Panimalar Engineering College, Varadharajhapuram,
Nasarethpettai, Poonamallee, Chennai 600123, India
IJSRR, 7(1) Jan. – March, 2018 Page 350
INTRODUCTION
The earth’s surface is enveloped by water to about 71% and amidst that only 2.5% comprises
of freshwater . Still about 1.1 billion people consume unsafe water due to lack of economic
technologies . The waste water is produced from micro industries, macro industries and household
activities which ultimately comprises of Industrialization and Urbanization.
According to WORLD BANK, 21% of the communicable diseases are water related.
Treatment of waste water tends to be quite expensive so to resort to economical means, Green
technical methods are practiced. Some of the traditional methods are Removal of metals by filtration,
flocculation, activation of charcoal and ion exchange process.
The study says that the recovered resource- bio solids which can otherwise be called as
manure can be tested and utilized as plant feed and also in vermicomposting. It was found that the
metal concentration was less in later stages than the initial period. By this method we can provide
natural fertilizers for plants and also recover useful resources like from the waste water.
The study was conducted in the district of Pudukottai, Tamil Nadu. Around 1900-1970,
people focused on removal of suspended, floatables, BOD andpathogens . Later aesthetic and
environmental concerns were targeted but now recovering any resource from waste water is the
active task. Since there are drastic changes in the environment, scientists have purposed to recover
maximum resources from the waste water by any means necessary. This led to the invention of
economic technique of recovering the resources and other chemicals like heavy metals, detergents
and pesticides.
Waste water and treatment has been in use for a long time and has been evolved in stages
throughout the human history. The recent technology has led to treatment of waste water where the
resources recovered can be used as a raw material. This concept serves as a substitution for the 3R’s
(Recycle, Reuse and Recover) concept. This is better known as a cradle to cradle concept , . With wastewater being increasingly recognized as a valued source of renewable resources, the EPA is
urging wastewater treatment facilities, which treat human and animal waste, to be viewed as
Renewable Resource Recovery Facilities that produce clean water, recover energy and generate
nutrients so as to provide a satiable solution for the waste water from the sewer lines that gets
PARAMETERS OF WASTE WATER
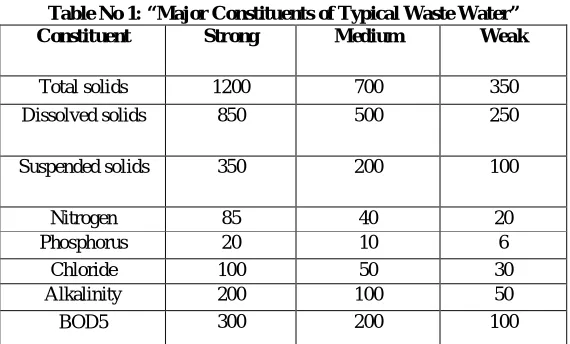
Table No 1: “Major Constituents of Typical Waste Water”
Constituent Strong Medium Weak
Total solids 1200 700 350
Dissolved solids 850 500 250
Suspended solids 350 200 100
Nitrogen 85 40 20
Phosphorus 20 10 6
Chloride 100 50 30
Alkalinity 200 100 50
BOD5 300 200 100
The municipal wastewater comprises of 99.9% water and the rest with dissolved organic and
inorganic solids. Among the organic substances are the carbohydrates, lignin, fats, soaps, proteins,
synthetic detergents etc. and certain other organic chemicals are also present in few percentages. The
tabulation above shows the various level of concentration of the constituents in waste water.
Total salt concentration
Total salt concentration is one of the most important agricultural water quality parameters.
This is because the salinity of the soil water is related to, and often determined by, the salinity of the
irrigation water. Accordingly, plant growth, crop yield and quality of produce are affected by the
total dissolved salts in the irrigation water. Equally, the rate of accumulation of salts in the soil, or
soil salinization, is also directly affected by the salinity of the irrigation water. Total salt
concentration is expressed in milligrams per litre (mg/l) or parts per million (ppm).
Electrical conductivity
Electrical conductivity is widely used to indicate the total ionized constituents of water. It is
directly related to the sum of the cations (or anions), as determined chemically and is closely
correlated, in general, with the total salt concentration. Electrical conductivity is a rapid and
reasonably precise determination and values are always expressed at a standard temperature of 25°C
to enable comparison of readings taken under varying climatic conditions. It should be noted that the
electrical conductivity of solutions increases approximately 2 percent per °C increase in temperature.
Sodium absorption ratio
Sodium is a unique cation because of its effect on soil. It has the ability to disperse soil, when
present above a certain threshold value, relative to the concentration of total dissolved salts.
IJSRR, 7(1) Jan. – March, 2018 Page 352 dispersed soil forms crusts which are hard to till and interfere with germination and seedling
emergence.
The most reliable index of the sodium hazard of irrigation water is the sodium adsorption
ration, SAR. The sodium adsorption ratio is defined by the formula:
Where the ionic concentrations are expressed in mg/l.
Toxic ions and heavy metals
Many plants are susceptible to toxic elements and it normally results in impaired growth,
reduced yield, changes in the morphology of the plant and even its death. The degree of damage
depends on the crop, its stage of growth, the concentration of the toxic ion, climate and soil
conditions.
The most common phytotoxic ions that may be present in municipal sewage are: boron (B),
chloride (Cl) and sodium (Na). Hence, it is necessary to know the concentration of these ions for
further utilization for plants.
pH
The pH is an indicator of the acidity or basicity of water but is seldom a problem by itself.
The normal pH range for irrigation water is from 6.5 to 8.4; pH values beyond this range can be
considered abnormal. Basically, pH is a routine measurement in irrigation water quality assessment.
STUDY AREA
The study was conducted in Pudukottai district, Arimalam block. Pudukkottai district was
carved out of Tiruchirappalli and Thanjavur districts in January 1974.The district has an area of 4663
Sq. Km. The predominant soil is RED LOAM. Though agriculture is the main source of sustenance
for a majority of the population, the scenario is not quite encouraging. There is no perennial river,
however AgniarVellar, Koraiyar, Gundar, etc. are some of the seasonal rivers that drain the district.
Since the river flows are copious in this district, there are no reservoirs. The sewage waste from each
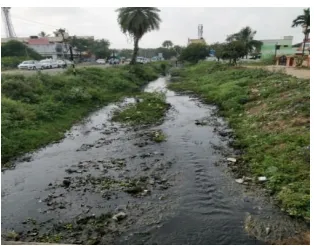
Figure No 1: “Improper Sewage into Water Body”
COLLECTION OF SAMPLE
As said earlier the tests were conducted in the Arimalam block of Pudukottai. The following
images will clearly envision the problem and the cause of the production of waste water. The sewage
or the waste water sample was collected from this area and suitable tests were conducted.
Figure No 2: “Waste Disposal” Figure No 3: “Eutrophification”
The figure 1&2 shows that the locality is affected by pollution due to improper disposal of
sewage waste into the water body. At the same time the solid waste including plastic covers, bags
and daily households are disposed into the stagnant water. This leads to breeding of mosquitoes,
Eutrophication, and water pollution.
TESTS PERFORMED WITH THE SAMPLE
Various simple tests were performed on the collected sample from the local area. The tests
conducted are as follows-
Litmus paper test
The inference that we achieve from this test is that if the sample is acidic, the blue litmus
paper turns to red colour. Similarly, if the sample is basic in nature then the red litmus paper turns
blue in color. This test was performed on all the four test samples. The test was conducted and the
Figure No 4: “Litmus paper test”
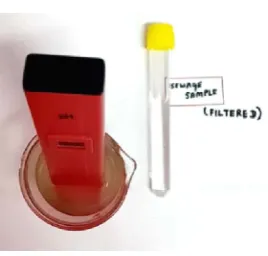
pH Test:
The pH refers to the negative logarithmic of hydrogen ion concentration in the particular
sample. The test was conducted by simply inserting the pH meter into the test samples and the value
was noted for each sample. According to this test, Solutions with a pH less than 7 are acidic and
solutions with a pH greater than 7 are basic. Pure water is neutral, at pH 7 (25 °C), being neither an
acid nor a base. Contrary to popular belief, the pH value can be less than 0 or greater than 14 for very
strong acids and bases respectively.
Figure No 5: “pH TEST”
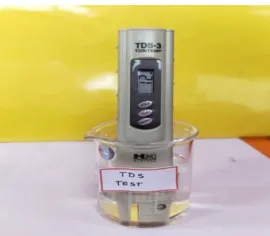
TDS test
TDS refers to total dissolved solids and is the measure of the combined content of all
inorganic and organic substances contained in a liquid in molecular, ionized or micro-granular
(colloidal sol) suspended form. This test was conducted on the samples and the results were
Figure No 6: “TDS test”
Total hardness test
Total hardness is a measurement of the mineral content in a water sample that is irreversible
by boiling. Therefore, total hardness can be equivalent to the total calcium and magnesium hardness.
By using the total hardness testing kit, the sample was classified as hard or soft water. The test was
conducted by using a series of reagents like RTH 1, RTH 2, and RTH 3 etc.
For hard water the inference is got by observing the color change as to from pink to blue and vice
versa for soft water.
Figure No 7:“Hardness testing kit”
INFERENCE FOR THE TESTS UNDERTAKEN
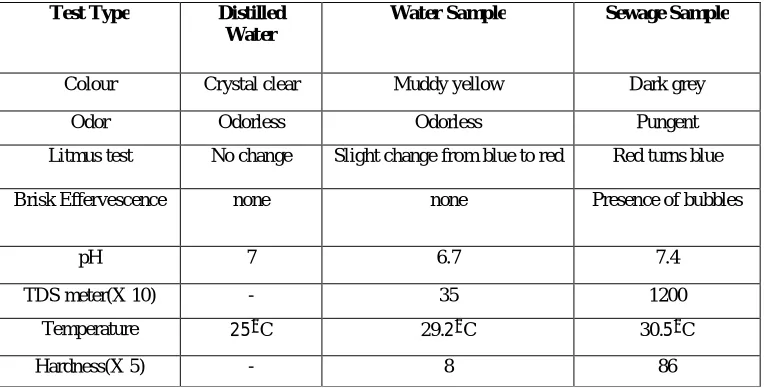
The appropriate tests were conducted from the sample taken the wastewater samples. The
wastewater (sewage) is compared with the other fluid samples from Arimalam and are tabulated in
Table 1.
The test results show that the values of the sewage sample are slightly higher than that of the
other samples. This shows that the sewage sample has biological contents which alter the
IJSRR, 7(1) Jan. – March, 2018 Page 356 Table No 2: “Comparison of Distilled Water, Water Sample and Sewage Sample”
Test Type Distilled
Water
Water Sample Sewage Sample
Colour Crystal clear Muddy yellow Dark grey
Odor Odorless Odorless Pungent
Litmus test No change Slight change from blue to red Red turns blue
Brisk Effervescence none none Presence of bubbles
pH 7 6.7 7.4
TDS meter(X 10) - 35 1200
Temperature 25 C 29.2 C 30.5 C
Hardness(X 5) - 8 86
PROCEDURE FOR COMPOST ANALYSIS
, ,Determination of pH
The pH of the compost sample was determined as per the procedure described by Chandraboseet al.,
(1988). The pH is defined as the negative log to the base 10 of the H+ ion concentration. The pH of the
bedding materials was determined Potentiometric method using a digital pH meter.
Thirty gm of air-dried sample passed through a 2mm sieve was transferred to a clean 100ml beaker to
in which 60ml of distilled water was added. The contents were stirred intermittently and the sample
suspension was again stirred just before taking the reading. The electrodes were immersed into the beaker
containing sample water suspension and meter readings both in the supernatant solution and suspension were
recorded.
Determination of Electrical Conductivity (EC)
The electrical conductivity of the test samples was determined as per the procedure outlined
by Chandraboseet al., (1988). Electrical conductivity is the measurement of total amount of soluble salts present in the sample and is expressed as millisimens/cm (mS/cm). To five gm of the
experimental sample, 50 ml of distilled water was added, stirred well and the suspension was
allowed to settle for eight hrs. The electrode of the conductivity cell was immersed into the sample
Estimation of Organic Carbon by Empirical
The determination of organic carbon was carried out as per the procedure of Empirical Method.
Exactly one g of finely ground oven dried sample (at 1050C) was placed in a constant mass silica crucible
and heated in a muffle furnace at 5500C for 2h. The crucible was allowed to cool down in a desiccator
and again weighed.
Organic matter (%) = Initial mass - Final mass x 100
Initial mass
The ratio of carbon content to volatile substance content remains to some extent for a
particular type of organic waste. The volatile substance in the sample was determined as for organic
matter estimation.
Organic Carbon (%)=VS =Organic matter (%)
A 1.724
Where, A = a constant 1.724 (Walkley and Black, 1934)
VS = Volatile substance percent (organic matter percentage)
Estimation of Total Nitrogen (N
) The total nitrogen of the sample was estimated by Kjeldahlmethod. This method involved two steps
(i) Digestion of the sample to convert the N compound in the sample to the NH4+ form:
To a 100 ml Kjeldahl flask 0.5gm of dried sample was transferred. Twenty ml of the sulphuric
salicylic acid mixture was added and swirled gently so as to bring the dry sample in contact with the
reagents. It was allowed to stand overnight. About 5gm of sodium thiosulphate was added the next
day and heated gently for about 5 min. Care was taken to avoid frothing. The contents were cooled to
which 10gm of sulphate mixture was added and digested in the Kjeldahl apparatus for 1hr. Bumping
during the digestion can be avoided by adding glass beads. When the digestion was completed, the
digest was cooled, diluted and distilled as follows.
(ii) Distillation and determination of NH4+ in the digest: To a vacuum jacket of micro- Kjeldahl
distillation apparatus, 10ml of the digest was transferred. In a conical flask, 10ml of 4% boric acid
solution was taken containing bromocresol green and methyl red indicators, to which the condenser
outlet of the flask was dipped. After adding the aliquot digest, the funnel of the apparatus was
washed with 2-3 ml of deionized water and 10ml of boric acid. After completion of distillation, boric
acid was titrated against N/200 H2SO4. Blank was also carried out to the same end point as has been
followed in the case of the sample.
Weight of the sample = 0.5gm Normality of H2SO4 = N/200
IJSRR, 7(1) Jan. – March, 2018 Page 358 Titrant Value (TV) = Sample TV-Blank TV
N (%)=TVx0.00007 x100x100 (1ml of N/10 H2So4 + = 0.000014gm N)
0.5 X 0.5
Estimation of
,I) Diacid digestion
Using a 9:4 mixture of HNO3 carried out Diacid digestion: HClO4. One gm of ground sample
was placed in a 1000ml volumetric flask. To this, 10 ml of acid mixture was added and the contents
of the flask were mixed by swirling. The flask was placed on a hot plate at low heat in a digestion
chamber. The flask was subsequently heated at higher temperature until the production of red NO2
fumes ceases. The contents were further evaporated until the volume was reduced to about 3-5 ml
but not to dryness. The completion of digestion was confirmed when the liquid becomes colourless.
After cooling the flask, 20ml of deionized or glass distilled water was added and the solution was
made up to the mark with deionized water. Then it was through Whatman No.1 filter paper.
II) Determination of Phosphorus (P)
Total phosphorus content of the sample was estimated by colorimetric method. The aliquot
from sample digestion was pipetted out to 50ml volumetric flask. Then 10ml of vanadomolybdate
reagent was added to each flask. The volume was made up with deionized water and mixed
thoroughly (by shaking). Yellow colour was developed in about 30 minutes (The colour is stable for
2-3 weeks). The absorbance /transmittance of the solution was read at 420nm with a
spectrophotometer. The phosphorus concentration was determined using the prepared standard curve.
P (%)= Sample concentration (ppm) X 1 X 100 X Final volume(ml)
Weight of Aliquot sample(ml) 1000
Estimation of Potassium
Total potassium content of the manure sample was determined as per Tandon (1993) by
flame photometric method. The unknown sample was atomized in the flame photometric and the
readings were recorded. The potassium concentration was determined using the prepared standard
curve and multi with dilution factor.
Determination of Calcium (Ca)
The calcium and Magnesium contents of the sample were determined as per procedure of Tandon
(1993). An aliquot of the sample solution containing upto 3mg calcium was pipetted out into a china dish
and diluted to 10ml. About 10 droops of each of potassium cyanide, hydroxylamine hydrochloride,
ml of calcon solution were added. Then, the contents were titrated against 0.01N EDTA until the colour
changed from wine red to blue using EBT indicator.
Estimation of Magnesium (Mg)
Magnesium content was calculated from the difference between the contents
Ca+ Mg and the calcium content.
Ca or (Ca + Mg) meq/gm = (ml of EDTA consumed X Normality of EDTA) X Volume made
Aliquot taken
For calculation of percentage of calcium and magnesium, the milliequalants of Ca or Mg are to be
multiplied by their respective equivalent weights (Meq X Eq. wt/mg). Then 10 to get Ca or Mg
percent per gm of sample divided the value.
Determination of Ca and Mg
An aliquot of sample solution containing upto 3.0mg of Ca and Mg was pipetted out into a
China dish and diluted to 10ml. to this 15ml of ammonium chloride, ammonium hydroxide buffer
solution, about 10 drops of each of potassium cyanide, hydroxylamine hydrochloride, potassium
hexacyofarrate and triethanolamine solution were added. After adding all these reagents, the solution
was warmed for 3 min., cooled and 10 drops of Erichrome Black-T (EBT) indicator solution was
added. The contents were titrated with EDTA.
Estimation of Iron and Zinc
Principle: The technique involves determination of concentration of a substance by the measurement
of absorption of the characteristic radiation by the atomic vapour of an element. When radiation
characteristic to a particular element passes through the atomic vapour of the same element,
absorption of radiation occurs in proportion to the concentration of the atoms in the light path.
Reagent: Triple acid: 9:2:1 concentrated nitric acid, concentrated sulphuric acid and concentrated
per chloric acid.
Procedure: 1. 1.0 ml of vermicompost was taken into micro kjeldahl flasks and added 12ml of triple
acid, digested the samples over heated sand bath, made up to 100 ml with distilled water. 2. The
contents were directly fed in to the atomic absorption spectrophotometer with the nm of 248.3,
213.9, 279.5 and 324.8; the corresponding iron, manganese, zinc and copper were respectively
IJSRR, 7(1) Jan. – March, 2018 Page 360
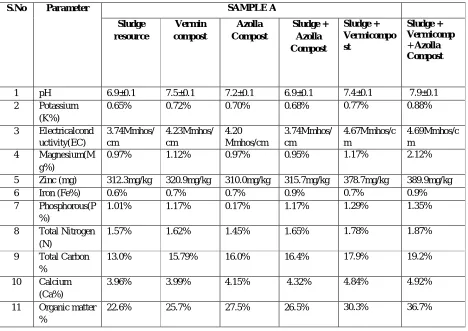
INFERENCE FOR THE COMPOST
Table No 3: “Physico -Chemical Parameters of Biocompost Prepared from wastewater sludge”
S.No Parameter SAMPLE A
Sludge resource Vermin compost Azolla Compost Sludge + Azolla Compost Sludge + Vermicompo st Sludge + Vermicomp
+ Azolla Compost
1 pH 6.9±0.1 7.5±0.1 7.2±0.1 6.9±0.1 7.4±0.1 7.9±0.1
2 Potassium
(K%)
0.65% 0.72% 0.70% 0.68% 0.77% 0.88%
3 Electricalcond
uctivity(EC) 3.74Mmhos/ cm 4.23Mmhos/ cm 4.20 Mmhos/cm 3.74Mmhos/ cm 4.67Mmhos/c m 4.69Mmhos/c m
4 Magnesium(M
g%)
0.97% 1.12% 0.97% 0.95% 1.17% 2.12%
5 Zinc (mg) 312.3mg/kg 320.9mg/kg 310.0mg/kg 315.7mg/kg 378.7mg/kg 389.9mg/kg
6 Iron (Fe%) 0.6% 0.7% 0.7% 0.9% 0.7% 0.9%
7 Phosphorous(P
%)
1.01% 1.17% 0.17% 1.17% 1.29% 1.35%
8 Total Nitrogen
(N)
1.57% 1.62% 1.45% 1.65% 1.78% 1.87%
9 Total Carbon
%
13.0% 15.79% 16.0% 16.4% 17.9% 19.2%
10 Calcium
(Ca%)
3.96% 3.99% 4.15% 4.32% 4.84% 4.92%
11 Organic matter %
22.6% 25.7% 27.5% 26.5% 30.3% 36.7%
From the table sludge compost shows desirable prop as that of conventional manure. The test
was further carried out by combing Sludge, Azzola and Vermicompost in the ratio of 1:1. We can
compare the results that are tabulated as when vermicompost is added along with the sludge the
result is quite desirable than vermicompost alone. There is minor variation when sludge in addition
to Azzola is compared to Azzola alone. By the combination of the three the results appear to be
desirable. This shows an advantage to the plants growth as well as in recovering resource from waste
water.
BIOSOLID MANURE
Evolution involves also a new generation of wastewater treatment plants, where energy,
organics, and other resources are recovered as valuable byproducts instead of being wastefully
dissipated or destroyed. This is being driven not only by a need for reduced cost and resource,
particularly energy consumption, but is also motivated by worldwide depletion of non-renewable
on terrestrial nitrogen cycles. Domestic wastewater by itself cannot completely fulfill fertilizer
requirements, as there is substantial dissipation to both domestic animal production (not normally
captured in urban treatment systems), as well as the environment. Globally, approximately 20%
of manufactured nitrogen and phosphorous is contained in domestic wastewater, of which the majority is potentially recoverable due to urban concentration. The situation is more attenuated for
energy. Bio solids, mainly composed by inert organics, non-recoverable nutrients and excess metals.
This is the byproduct from the “release” stage. It seems to be critical to achieve almost complete AD,
otherwise much of the benefits are lost in excess sludge production. However, Bio solids can be also
used as organic fertilizers if they fulfill the requirements.
Further detailed studies and researches with the sample may reveal the feasibility of Bio solids
recovery from waste water sample for manure and deeper knowledge on its characteristics.
CONCLUSION
This paper has focused on the comparative study of conventional manure and that obtained
from the waste water from Pudukottai. The drivers are clear, and are to translate technologies which
would normally remove contaminants into a liquid or waste concentrate stream (or reactively
dissipate them) into products that feed into the circular economy. This is not a massive shift from
current practices, but instead of focusing the process on removal, it focuses on recovery of the
manure for agricultural utility.
The idea of recovering manure based products from wastewater may once have seemed
fanciful, but it's a prize that many in the water quality community are working towards. It not only
helps to reduce the disposal of waste water but also increases the economy of the district and also the
desire to bring a major change in the community. Of the wide variety of innovative projects
underway not all will succeed, but those that do may just hold the key to plugging the funding gap
for India’s wastewater treatment plants.
ACKNOWLEDGEMENTS
The authors offer their deepest gratitude to the institution for its sincere support and
IJSRR, 7(1) Jan. – March, 2018 Page 362
REFERENCES
1. Igor Shiklomanov;Water in Crisis: A Guide to the World's Fresh Water Resources Oxford
University Press, New York, 1993.
2. Morgan.O; Infectious disease risks from dead bodies following natural disasters. Pan Am J
Public Health 1993;15(5): 307-312.
3. Andreas N. Angelakis ,and Shane A. Snyder; Wastewater Treatment and Reuse: Past,
Present, and Future,www.mdpi.com/journal/water ;9 September 2015, Water 2015; 7: 4887-4895; doi:10.3390/w7094887
4. Daniel Puyol, Damien J. Batstone, SergiAstals, Miriam Peces; Resource Recovery from
Wastewater by Biological Technologies: Opportunities, Challenges, and Prospects; Article in
Frontiers in Microbiology · December 2016 DOI: 10.3389/fmicb.2016;02: 106.
5. KatrinEitrem Holmgren, Hong Lili, Willy Verstraete, Peter Cornel; State of the art
compendium report on resource recovery from waste water; IWA Resource Recovery Cluster
6. M.B. Pescod; wastewater treatment and use in agriculture -FAO irrigation and drainage paper
47 ,Food and agriculture organization of the united Nations; M-56 ISBN 92-5-103135-5
7. Baruah, T.C., and Barthakur, H.P., “A textbook of soil analysis”, Viskas Publishing House,
New Delhi, India, 1997.
8. Gupta, P.K., “Soil, plant, water and fertilizer Analysis”, Shyam Printing Press, Agrobios,
India, 2004.
9. Foth, H.D., “Fundamentals of soil science’, 8th Ed., John Wiley and Sons, Inc., New York,
USA, 1990.
10.Walkley, A. And I. Black, An examination of the Degtjareff method for determining soil
organic matter and a proposed modification of the chromic acid titration method. Soil
Science;1934
11.Tendon, H. L. S; Methods of analysis of soils, plants, waters and fertilizers. Fert. Dev.
Consultation org. New Delhi: India; 1993.
12.Chandrabose, M. S., Natarajan, S., Selvakumari, G.; Methods of soil analysis, Book world
publications, New Delhi; 1988.
13.Andrea G. Capodaglio; Review Integrated, DecentralizedWastewater Managementfor
Resource Recovery in Rural and Peri-Urban Areas; MDPI; 15 June 2017; Resources 2017, 6,
22; doi:10.3390/resources6020022.
14.Fraunhofer-Gessellschaft, “Using Wastewater as a fertilizer.”Science Daily;