147
Study Of The Physico-Chemical Water Quality Of
The Company's Pumping Stations Chadian Water
And Suburbs Of Manual Drilling N'djamena
Mahamat Seid A.M, Maoudombaye Theophile, Ahmat Altidjani, Mahamat Nour Sakine, Ndoutamia A. G.Abstract: Water for consumption requires excellent physical, chemical and microbiological quality. This source of life is one of the most controlled food products. It must not only meet the quality requirements, but also must comply vis- à-vis a set of drinking water standards and must not contain any microorganism, no noise and no substance presents a potential danger to human health. This work was performed in the city of N'djamena and aims to assess the physico-chemical quality of the water pumping stations of the National Water Company in the city center and boreholes in human motor in neighborhoods peripheral devices. A total of 18 samples were collected, including 9 in the city center and 9 others in the suburbs. On each sample were determined physico-chemical parameters (potential of hydrogen (pH), temperature (T °), electrical conductivity, turbidity and calcium ions, magnesium, sulphates, fluorides, and nitrates). The results extend into the water pumping stations of ETS and manual drilling outlying districts respectively: temperature (28.0 to 36.1 ° C and 29.5 to 30.3 ° C); pH (6.5 to 8.5 and 6.3 to 7.6); electrical conductivity (201-671 ĩS / cm and 136-533 ĩS / cm); turbidity (NTU from 0.01 to 0.18 and 1.25 to 5 NTU); calcium (54 to 268 mg / L to 65-443 mg / L); magnesium (2.18 to 57 mg / L and 15 to 90 mg / L); sulfates (2 to 47 mg / L and 2 to 18mg / L); fluoride (0.0 to 0.61 mg / L and 0.12 to 0.98 mg / L) and nitrate (1.5 to 18, 2 mg / L and 0.1 to 0.6 mg / L). The results show that the contents of the parameters are consistent with the WHO standards for the quality of drinking water except calcium ions which their levels are high. Based on the parameters analyzed, the quality of water pumping stations of SNE and manual drilling is acceptable.
Index Terms: manual drilling, N'Djamena / Chad, physicochemical quality, pumping stations of ETS, water
————————————————————
1
INTRODUCTION
Water, source of life, is a very important and indispensable factor in the lives of people, animals and plants. Water can also be a source of disease due to contamination by household, industrial, agricultural, with excreta and other organic wastes (WHO, 2003). The use of water for food or hygiene requires excellent physical, chemical and microbiological quality (Doubi, 2013). According to the World Health Organization (WHO), 2.6 billion people worldwide lack access to safe drinking water and 1.8 million with 90% of children under five die each year especially in developing countries where hygiene and basic sanitation facilities are inadequate or lacking (Tony and Maude, 2005). The "water" diseases such as malaria, hepatitis, cholera, bilharzia, typhoid fever and diarrhea kill 30 000 people daily in the southern countries (UN, 2009). Chad has neither a sewage treatment plant or a household waste treatment plant and / or industrial. The some companies to industrial character in the country pour their waste directly both solid and liquid in nature without any treatment. A Ndjamena , there are cleaning and / or waste collection but their task is not limited only on tarred roads .
The public water supply system does not follow the rapid expansion of the city. In the suburbs, households use water from open wells or boreholes , manual for their different needs. To help control the quality of water intended for human consumption in the city of Ndjamena, this study focused on the physicochemical characteristics of water pumping stations of SNE and manual drilling outlying districts.
2
MATERIAL
AND
METHODS
2.1 Presentation of the study area
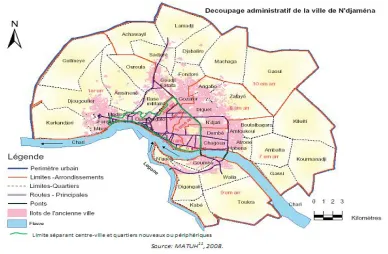
N'Djamena is the administrative capital and the largest city of the Republic of Chad . It lies at the confluence Chari and Logone rivers of and had 1,092,066 inhabitants and its area is 416,738834Km2 (RPGH2 , 2012). Administratively, it is divided into 10 urban communes, erected in district (Djim - Adjim , 2013). It is important, however, to distinguish the inner city center and those in the surrounding area. Neighborhoods downtown are within the 2nd, 3rd, 4th, 5th and 6th districts and part of the 1st district. The center has a drinking water system and electricity to nearly 100 percent, even if the power cuts are frequent (FAO, 2012). Recently, with the development works in the city, it also benefits largely from urban roads covered with asphalt. The suburbs are in the 7th, 8th, 9th, 10th districts and part of the 1st district . It is generally new neighborhoods that have grown haphazardly, without subdivision plan (FAO, 2012). In these neighborhoods, people buy their water from open wells or boreholes with
_________________________
Mahamat Seid A.M, Maoudombaye Theophile And Ndoutamia A.G. Are Currently Teaching At The Scientific And Technical Faculty Of The University Of Doba/Chad
148 Fig.1. administrative division of the city of N'Djamena
2.2 Sample
The study focused on water pumping stations of ETS in the city center and boreholes in human motor in the suburbs. A total of 18 samples were collected, including 9 in the pumping stations of the ETS and 9 in the manual drilling
individuals. Sampling was carried out using disposable plastic bottles. The bottle is led at the time of decision, when completed, it is punched , labeled, stored at 4 ° C in a cooler and transported to the laboratory.
Fig. 2. Location of drill Chadian Water Company
Fig.3. Characteristics of some drilling of STE
Drilling name twinned Marché à mil
Marché
central GD1 GD8 GD21 GD22 GD23 GD24
Depth (m) 61 361 53 70 61,7 52 60 68,5 65
Realization year 1975 1965 1966 1975 1975 1975 1987 1987 1991
Geographic location Avenue Pompidou Blabblin Ambassana Gendar-merie Klemat Farcha Moursal Goudji Djambal Bahar
2.3 Methods
The temperature and pH of the water were measured respectively in situ with a thermometer and a pH meter HANNA HI 98127. The electrical conductivity of our samples was determined by a mark Conductivity Muliti- parameter analyzing Consort 8663 C by immersing the electrodes directly in the sample. The turbidity was determined with a Turbi As 1500 IR by measuring an amount of 10 ml of sample and 10 ml of distilled water to read the white. The samples should be shaken vigorously before measurement. Because of the unique characteristics of suspended solids, such as straw, shape, refractive index, color, etc., comparison difficulties are obvious (Rodier 1996). The measurement of the hardness (TH) was determined by the method of Mhor, nitrates, chlorides,
calcium and magnesium by the method of molecular absorption spectrophotometry DRL / 2400. nitrate readings were made at the wavelength of 415 nm (Caron, raquet, 1910). Chlorides of our samples were determined by the method Mercuric thiocyanate method (J. E. O'Brien, 1962). Spectrometric assays chlorides are performed at the wavelength of 480 nm. Calcium and magnesium ions were determined by complexometric Colorimetric method (0 , 07 to 4,00mg / L Ca and Mg as CaCO3).
2.4 Results and discussion
The results of physicochemical analyzes are shown in fig. 3 and fig. 4.. WHO drinking water standards for water consumption were the basis for the interpretation of our results.
Fig. 4. Results of the physical parameters of the waters of the ETS and the suburbs drilling.
Sites T (°C) pH Conductivité (S/cm) Turbidité (NTU)
Downtown
Twinned (A) 29,1 6,92 125 0,11
Marché à mil (B) 36,1 6,75 671 0,15
Marché central © 29,3 7,3 367 0,12
GD1 29,8 6,88 287 0,15
GD24 28,0 7,06 216 0,13
GD22 28,4 7,9 201 0,12
GD23 28,6 7,2 262 0,18
GD21 29,7 6,8 225 0,01
GD8 28,4 7,1 302 0,15
Peripheral district
F1 30,3 7,8 376 2,27
F2 29,5 7,1 136 1,25
F3 30,0 7,6 389 3,12
F4 29,7 7,6 165 1,5
F5 30,3 6,3 212 5,0
F6 29,9 6,7 438 2,0
F7 30,0 7,2 201 1,9
F8 30,0 6,6 190 2,5
F9 30,3 7,0 533 5,0
149 2.5 Temperature
The water temperature is an environmental factor that causes significant ecological repercussions (Leynaud, 1968). It acts on the density, the viscosity, the solubility of gases in water, the dissociation of the salts, as well as chemical and biochemical reactions, the development and growth of organisms in the water and particularly the microorganisms (WHO , 1987). The ideal temperature is between 6 ° and 12 ° C (Degbey, 2011). WHO holds the value of 25 ° C as the maximum acceptable value. The recorded temperatures range from 28.0 to 36.1 ° C for water stations SNE and from 29.5 to 30.3 ° C for the suburbs drilling water. Generally, these temperature values are all high compared the maximum acceptable temperature of 25 ° C of WHO. These values are related to the ambient temperature of the city of Ndjamena generally high during the sampling. The temperature of 36.1 ° C recorded at the station market millet is linked to the well depth which is 361m. These temperatures are not very different values between 23.5 and 31.9 ° C reported by Mickael et al., (2010) in Cotonou, Benin. The temperatures of 27.3 ° C to 28 ° C and 27.1 ° C to 28.1 ° C were obtained respectively in November and in March, Abdoulaye et al., (2013), in water from the right bank of the Senegal River. The high temperature values are not harmful to human health but a problem of acceptability because fresh water is generally more palatable than warm water (Degbey, 2011).
Fig. 5. Temperature Dependence of water sources
2.6 pH
The acceptable pH range, from 6.5 to 8.5 for drinking water (Health and Welfare Canada, 1979a ) , was especially chosen because it minimizes corrosion and scaling given the effectiveness of disinfection with chlorine and trihalomethanes formation (Health and Welfare Canada , 1982). WHO also retains the interval from 6.5 to 8.5 as a quality standard for drinking water . PH values ranging from 6.8 to 7.9 for the ETS and 6.3 to 7.6 for the pumping stations of suburbs drilling. All these values are included in the WHO pH range except the value of 6.3 recorded in drilling level (F5) (Table II) which is slightly lower. The results corroborate with those of Michael et al. , (2010) and are superior to those of Lagnika et al. , (2014) which have respectively the average ratio of 6.53 (± 0.51) and 5.83 (± 0.6) .
Fig. 6. pH Dependence water sources
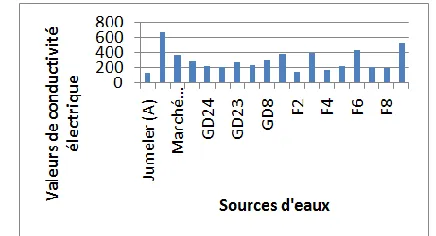
2.7 Electrical conductivity (EC)
Conductivity is not, in itself, a parameter having a health risk. However, high conductivity can change the taste of water and therefore encourage users to change their resource for drinking water, or may indicate that water will leave deposits, including limestone, and "froth" bit with soap / detergent (DINEPA-UNICEF, 2013). Conductivity contrasts measured on a medium used to highlight pollution, mixing zones or infiltration (GHAZALI D et al., 2013). It is also used to assess the amount of salt dissolved in water (Pescod, 1985; Rodier, 1984). More water is rich in minerals, the higher the conductivity is high. The conductivity of a natural water is between 50 and 1500 ĩS / cm (BIM, 2005). WHO holds a value ĩS 400 / cm as the standard. Of large conductivity differences were obtained both in drilling the ETS at the level of peripheral neighborhoods drilling water. These differences are respectively 201-671 ĩS / cm and 136-533 ĩS / cm. Most values are in line with WHO standards (400 ĩS / cm) unless the market station millet and drilling (F9) (Table II) which culminate with respectively 671 ĩS / cm and 533 ĩS / cm. These differences may be explained by the nature and different mineralogical composition of formations crossed. The geomorphological context, the depth of the captured levels and the geological nature of the soil formations are all factors that influence changes in conductivity (Boubacar, 2010). The values of 13.90 to 52.65 ĩS / cm have been reported by Ngaram in the waters of the Chari River in Chad. Kahoul and Thami, (2014) found moderately mineralized values consumption of the city of Annaba in Algeria. By cons , our values are very low to those reported by Belghiti et al. , 2013 in the groundwater of the Pliocene -Quaternary water table in the region of Meknes in Morocco, which ranged from 461-1587 ĩS / cm.
Fig. 7. electrical conductivity changes depending on water sources
0 2 4 6 8 10
Val
e
u
rs d
e
p
H
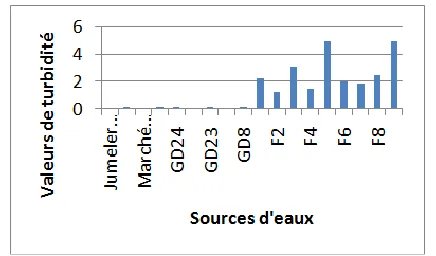
150 2.8 Turbidity
Turbidity is caused by materials such as clay, silt, fine organic and inorganic matter, plankton and other microscopic organisms suspended in the water. Suspended matter can protect pathogenic microorganisms against chemical disinfection or ultraviolet (UV) (Health Canada, 2003). The inconvenience caused by turbidity from users are relative because some people are used to consume water more or less trouble and do not appreciate the qualities of a very clear water. The turbidity of the water distributed must be less than or equal to 5 NTU at all times (Environnement Québec, 2004). At the pumping stations of the ETS, all values are less than the maximum acceptable value of the WHO, which is 5 NTU. These values s'tendent of from 0.01 to 0.18 NTU. By cons, in the suburbs, two new wells on or F5 and F9 (Table II) have values equal to the maximum acceptable limit of 5 NTU.
Fig. 8. Variations of turbidity depending on the source of water
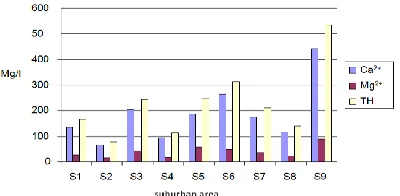
2.9 Calcium (Ca2 +)
Calcium is usually the dominant element of drinking water and its content essentially varies according to the nature of the crossed land (ground limestone or gypsum ) (Rodier et al. , 2009). Adverse effects that are especially organoleptic or aesthetic order resulting from the presence of calcium in drinking water may come from its contribution to the hardness (A.W.W.A 1990). Calcium is generally the dominant component of drinking water and its content varies substantially from one area to another depending on sampling issues and the nature of the land crossed (ground limestone or gypsum) (Rodier et al. 2009 ). This variation is very strong in both zones. For drilling water SNE calcium content, evolving from 54 mg / L (drilling: paired Pompidou avenue) to 268mg / L (GD8: Klemat district), the GD8 drilling is 100 m high wastewater from different parts of the city, by the effect of sewage infiltration groundwater is polluted. For waters of the suburban area, the calcium concentration in the water is very high compared to the urban area. In this area the calcium content ranges from 65 mg / L (S2 site Dembé district) to 443 mg / L (S9 district website Lamadji). This high calcium content Lamadji can mean that the table is shallower than that of the general water table, and its location (near the Chari River). Strong calcium content of GD8 can be caused by the influence of wastewater stationed 100 m of drilling GD8. These results are similar to those obtained by Kanika Fatimé O. G. (2000) for market well water has thousand of the city N'Djamena, or (50.08 mg / L). In general, the calcium concentration in the waters of the NIS is very strong compared to the waters
of the town of Kousseri (25.6mg / L) wells of Garoua district (15.2 mg / L) water SNEC the Garoua area, and (16.24mg / L) for the waters of the SNEC district for-for the town of Kousseri in (Cameroon) on the other bank of the Chari River. The drinking water of good quality contain 100 to 140 mg / L of calcium is 150 to 200 mg CaO or 250 to 350 mg CaCO3 (Rodier, 1996). As the calcium content is higher in most studied drilling, this can have health effects on consumers. Calcium has effects on blood pressure; it would exert a protective action on it (Mc Carron, 1982). Calcium acts on blood pressure by reducing the magnesium and the plasma phosphate. The increase in secretion of these last two elements and the reduction of phosphate induces a reduction in blood pressure (Lau et al, 1984).
Magnesium (Mg + 2)
The change in magnesium content as water sampling points a significant difference was obtained. For waters STEE magnesium content ranges from 2.18 mg / L (GD1 drilling Gendarmerie district) to 57 mg / L (GD8: Klemat district), which is higher than the standards recommended by WHO (50 mg / L), according Rodier (1996) as the maximum value for water intended for human consumption. These results are higher than those obtained by Fatimé O.G. Kanika (2000) (3,84-11mg / L) on some underground water sources of the city of Kousseri. For waters of pre-urban magnesium content changing of 15 mg / L (S2 site area Dembé), 90 mg / L (S9 site Lamadji), the magnesium content is higher than that of GD8 drilling. These results are higher than those obtained by (Fatimé O.G. Kanika, 2000) (3,84-11mg / L) on a few sources of groundwater pollution from the town of Kousseri. Magnesium is necessary to man for the metabolism of carbohydrates and fats, and as a catalyst in certain enzymatic reactions. The daily requirement is estimated from 2 to 5 mg / day for adults and less than 1.5 mg / day for children. From a concentration of 100 mg / L and for sensitive subjects, magnesium gives an unpleasant taste to the water (Rodier, 1996). Magnesium deficiency is rare because it is found in whole grains , dried fruits, chocolate and especially oléagineuxs (Apfelbaum et al , 1981).
2.10 Chloride (Cl)
151 very variable and mainly related to the nature of the terrain
traversed Kahoul and Thami, (2014). According to local standards of potability of water, chlorides must have a content of less than 500 mg / l in drinking water (N.A 1992). Analytical results of N'Djamena and its peripheral areas have revealed normal amounts of chlorides from 28.36 to 354.53 mg / l. It turns out some studies (Weinberg, 1986; Schultz, 1984) that even in the case of excessive amounts in drinking water, chlorides would have no adverse effects on consumer health because chloride concentrations in the body are regulated by a complex system involving both the nervous system and the hormonal system. Even after absorption of significant quantities of chlorides via food and water, the balance of the chloride is maintained, particularly by the excretion of excess chloride in the urine (Siggaard-Anderson, 1976; Tortora, 1984).
2.11 Total Hardness (Hydrometric Title) TH
The total hardness of a water is produced by calcium and magnesium salts contained therein. The hardness is measured by the total hardness in ° F (French degrees) ; F 1 corresponds to 10 mg of calcium carbonate in 1 liter of water (Belghiti et al. , 2013). WHO retains a range of from 100 to 500 mg / l as the criteria for potability of drinking water. The results concerning the hardness measurements of N'Djamena city water have shown that all values of this parameter conform to local standards (N.A, 1992) that require maximum concentration of 500mg / l. The water hardness variation depending on your point of water withdrawals for the waters of the SNE, shows that the content of (TH) ranges from 83 mg / L (drilling: twinned) to 525 mg / L (GD8: Klepmat district). This value exceeds the standard recommended by WHO. This water is classified as very hard water, for water intended for human consumption. This is explained by the fact that the GD8 drilling is 100 m high Wastewater from different parts of the city, and by the effect of infiltrating groundwater is polluted by the wastewater. This high hardness would have no impact on the health of consumers to the extent that a number of epidemiological studies (Neri et al, 1972. Anderson et al, 1975. Stitt et al, 1973. Hudson et al. 1973) conducted in Canada respectively, England, Australia and the United States have shown an inverse statistical correlation between the hardness of drinking water and some types of cardiovascular disease. For waters of the suburban area , the hardness is higher than those areas of the ETS and therefore the waters suburban areas are harder . Their TH content ranges from 80 mg / L (S2 site Dembé district ) to 533 mg / L (S9 Lamadji ) (Figure 2) which is the largest value (TH ) obtained throughout the study area , this content TH to originate from the soil rich in calcium and magnesium as indicated by the analyzes performed.
Fig. 9. Change in total hardness of water samples
2.12 Content of nitrate (NO3)
The presence of nitrates can result from excessive fertilizer application or leaching of wastewater or other organic waste to surface water and groundwater (WHO, 2004). Nitrate in drinking water is primarily due to human activities (Health Canada, 1992). The use of synthetic fertilizers and manure, crop-associated and intensive farming, promotes the appearance of nitrates in water (Levallois and Phaneuf, 1998). Deficient septic systems, as well as the decomposition of plant and animal material, can also be a source of nitrates in water (Levallois and Phaneuf, 1998). The risk of contamination is higher if the ground covering the water table is vulnerable and if the table is shallow (Degbey C., 2011). Agriculture is presented as the most important source of nitrate leached to groundwater and surface water. The best-documented impact of nitrates on human health is the risk of methemoglobin formation, thus causing the decrease in the oxygen available to the cells (Danielle et al,. 1998). The value of 50 mg / l is indicated by the WHO for drinking. The nitrate content varies point of water samples (Table 2). A significant difference was obtained between the different sampling points reflecting the influence of pollution sources (sewage, household waste). For waters sampled in areas of ETS, the nitrate content evolves from 1.5 mg / L (GD24 drilling located a few meters of the Chari River) to 18, 2 mg / L (GD1 drilling Gendarmerie district) (Table 2). These levels (NO3) are below the WHO standard (50 mg / L). These concentrations are similar to those obtained by (Kohamed, 2014) (1.93 and 17,6mg / L) but different largely from those obtained by Modal. Ahaz N. T. (2006) (0.2 -3.5 mg / L) for a few holes of ETS of N'Djamena. This could be due to the influence of pollution from urban sources (pollution by sewage, household waste, carried by water runoff). The water level of peri-urban areas, the nitrate content ranges from 0.1 mg / L (S8 site Waliya quarter) to 0.6 mg / L (S2 site Dembé district) (Table 2). This low nitrate content in our samples is very interesting nutritionally. The waters having high nitrate content used for the preparation of powdered milk bottles can appear in infants cyanosis related to methemoglobin formation (Rodier, 1978). WHO recommends for water intended for human consumption a limit value of 50 mg / l (NO3) and specifies that it must be also taken into account the concentration of nitrites such that the sum of the concentrations reports (nitrate and nitrite) relative to their respective guide values less than 1 (Rodier, 1996). The low nitrate content in our samples can be compensated by the consumption of nitrate-rich plants. The results of our study revealed that all levels of nitrate in water samples analyzed are in the standards to the extent the obtained values vary between 1.5 and 18.2 mg.These waters would therefore no impact on the health of infants less than 6 months because according Hirondel (2009), abnormal nitrate content (> 50 mg / l) in drinking water, once reduced to nitrites, may cause
3
CONCLUSION
152 temperature is acceptable. Scientifically, these waters meet
the more so as their hardness is relatively high standards but without risk to the health of the population, their levels of calcium and chloride are normal and above their nitrates which are known by their adverse effects health is very low compared to the maximum permissible value. However, it should be emphasized that the results show that in peripheral areas the water is hard. The highest levels of TH and calcium were obtained from the drilling Lamadji (533 mg / L) and (443 mg / L Ca + 2) in suburban areas. Market drilling water millet have a higher temperature (36,1 ° C) and conductivity (671 ĩS / cm). These values are slightly higher than recommended standards. Ultimately, the waters of the city of N'Djamena and its suburban areas can be considered good to eat if the processing operations are carried out. It would be advisable to regularly conduct such studies based on the compliance of physicochemical.
ACKNOWLEDGMENT
The work received financial support from the National Commission for the Training of Trainers (CONFOFOR ) and Technical Support National Center for Research (NARC ) . We wish to express our appreciation and gratitude to the promoters of the project and the Ministry of Higher Education and Scientific Research of Chad. The editorial team wishes to express its gratitude to all employees who agreed spontaneously to burden their workload to bring their knowledge and experience in scientific writing this article. They found the testimony of our gratitude.
REFERENCES
[1] Health Canada, 2003 “Questions and Answers on consumption of water treatment systems,”
accessed on:
www.hcsc.gc.ca/ehp/dhm/dpc/eau_qualité/faq_dtep.ht m, Accessed: May 2003.
[2] W.H.O., 1987. “Global pollution and results of heath related environmental monitoring. Global Environment Monitoring System,” WHO, UNEP.
[3] GHAZALI D., A. Zaid , 2013. “Study of the physico- chemical and bacteriological water quality of the source Ain - Salama Jerri (Region Meknes in Morocco).” Larhyss Journal, ISSN 1112-3680, No. 12, January 2013, pp. 25-36
[4] Belghiti M. L., A. Chahlaoui, Bengoumi D. and R. El Moustaine , 2013. “Study of the physico- chemical and bacteriological quality of groundwater in the Quaternary vPlio - ply in the region of Meknes.” Larhyss Journal , ISSN 1112-3680 , No. 14, June 2013 , pp.21-36
[5] Boubacar Hassane A., 2010.” superficial and deep aquifers and urban pollution in Africa: Case of the urban community of Niamey (NIGER)”, Thesis, Univ. Abdou Moumouni in Niamey (Niger), 198 p.
[6] Djim-Adjim T., 2013.” Study of the contribution of avian salmonella to human salmonellosis in Chad: case of the capital city, N'Djamena.” Thesis at the Institute of Science and Industry Life and Environment (AgroParisTech). 151 p.
[7] Environment Quebec, 2004. “Regulation respecting the quality of drinking water. Quebec Source of pride.” Edition 2004. 4457-04-02
[8] FAO, 2012.” Study on Urban and peri-urban forestry in Ndjamena, Chad. Role and place of the urban and suburban tree. Support for the formulation of a strategy and an action plan of urban and peri-urban forestry in N'Djamena, Republic of Chad.” Discussion Paper on urban forestry and peri-6. 95 pages. Rome.
[9] IBGE, 2005. “Quality Chemical and physicochemical surface water: general framework. Data from the IBGE: Water in Brussels in November 2005.”
[10] INSEED, estimation 2012. “Second General Census of Population and Housing in 2009 in Chad (RGPH2). “interim report, 219 p.
[11] Kahoul and Mr. Thami M., 2014. “Evaluation of the physicochemical quality of the city's water consumption Annaba (Algeria).” Larhyss Journal, ISSN 1112-3680, No. 19, September
[12] Lagnika M., I. Moudachirou , Jean- Pierre C. , and Valentin D. Nestor G., 2014. “Physico-chemical characteristics of water wells in the town of Pobé (Benin , West Africa ).” Journal of Biosciences Appelied 79: 6887-6897 . ISSN 1997-5902 .
[13] Leynaud G., 1968. “The thermal pollution, temperature influence on aquatic life .” B.t.i. Ministry of Agriculture , 224-881 .
[14] WHO, (2003). “Water for People, Water for Life ,” Paris , UNESCO - WWAP.
[15] J. Rodier, 1984. “The analysis of water, natural water, waste water, seawater” Edition Dunod Paris.
[16] PESCOD M. B., 1985. “Design, operation and maintenance of waste water stabilization ponds in treatment and use of sewage effluent for irrigation.” Ed Pescodand Arar, 93-114.
[17] Mickael S. Boniface Y., S. Honor, Roger G. and Henry S., 2010. “Impacts of waste from Cotonou slaughterhouse in the degradation of the water quality of the water table.” J. Soc. West Afr. Chim. (2010) 030, 79-91.
[18] Abdoulaye D., KhadijettouM. and Mohamed O., 2013. “Contribution to the study of the physical-chemical water quality of the water from the right bank of the Senegal River.” Larhyss Journal, ISSN 1112-3680, No. 12, January 2013, pp.71-83
[19] DINEPA, UNICEF, 2013. “National Directorate of Water Supply and Sanitation. technical specification. Water treatment at home.”
153 River as it passes through the city of N'djamena.”
doctoral thesis Ph.D. 164.
[21] Health and Social Welfare Canada. 1979a. “Quality Guidelines for Canadian Drinking Water” 1978. Supply and Services Canada, Hull
[22] Health and Social Welfare Canada . 1982. “Recommendations for the quality of drinking water in Canada” 1978. Supporting documents . Supply and Services Canada , Hull.