REGULATION OF NEURONAL GENE
EXPRESSION BY OCT 2
ZANDRA C. DEANS, B.Sc.
Thesis submitted for the degree of Ph D.
Medical Molecular Biology Unit,
Department of Molecular Pathology,
University College London Medical School,
University College London.
ProQuest Number: 10106510
All rights reserved
INFORMATION TO ALL USERS
The quality of this reproduction is dependent upon the quality of the copy submitted. In the unlikely event that the author did not send a complete manuscript and there are missing pages, these will be noted. Also, if material had to be removed,
a note will indicate the deletion.
uest.
ProQuest 10106510
Published by ProQuest LLC(2016). Copyright of the Dissertation is held by the Author. All rights reserved.
This work is protected against unauthorized copying under Title 17, United States Code. Microform Edition © ProQuest LLC.
ProQuest LLC
789 East Eisenhower Parkway P.O. Box 1346
To my family
Ill
ABSTRACT
Oct 2 is a POU-protein which is expressed in sensory neurons but whose cellular function has not yet been identified. In order to identify Oct 2 regulated neuronal genes, antisense Oct 2 sensory neuronal cell lines were created. Two antisense Oct 2 cell lines showed reduced levels of Oct 2 protein.
The tyrosine hydroxylase promoter has previously been shown to be regulated by Oct 2. Immunocytochemistry, immunoblotting and RT-PCR identified an upregulation in endogenous tyrosine hydroxylase mRNA and protein expression in the antisense Oct 2 cell lines when compared with the parental ND7 cell line. The synaptic vesicle proteins, SNAP-25 and synapsin I showed increased protein expression in these cell lines and Oct 2 mediated repression of the synapsin I gene promoter was demonstrated.
IV
CONTENTS
Page
List of Figures ix
List of Tables xii
Abbreviations xiii
List of Publications xv
Acknowledgements xvi
CHAPTER ONE - Introduction
1.1 Regulation of Gene Transcription 2
1.1.1 General Introduction 2
1.1.2 Basai Transcription 2
1.1.3 General Transcriptional Regulation 5 Transcriptional Activation 6 Transcriptional Repression 7 1.1.4 Cell Specific Gene Regulation 10
1.2 The POU-domain protein family 11
1.2.1 Introduction to the POU-domain family 11
1.2.2 The POU-domain 13
1.2.3 Mechanisms of DNA binding by POU-proteins 15 1.2.4 Regulation of DNA binding by Phosphorylation 18 1.2.5 Protein-protein interactions mediated by the POU-domain 19
1.3 Sensory neuronal cells 24
1.3.1 Introduction 24
1.3.2 Neuronal Development 25
1.3.3 Neuronal Differentiation 26 1.3.4 Sensory neuronal cell line, ND7 27
1.4 Brn 3 29
1.4.1 Introduction to Bm 3 transcription factors 29
1.4.2 B m 3a 30
Page
1.4.4 Bm 3c 34
1.5 Oct 2 35
1.5.1 Introduction to Oct 2 35
1.5.2 Oct 2 isoforms 35
1.5.3 Oct 2 in B-lymphocytes 40 1.5.4 Oct 2 and Herpes simplex virus latency 43 1.5.5 Oct 2 and Tyrosine Hydroxylase 46
1.6 Aims of Project 56
CHAPTER TWO - Methods and Materials
2.1 Laboratory Reagents 58
2.1.1 Chemicals 58
2.1.2 Enzymes 58
2.1.3 DNA 59
2.2 Bacterial Strains and Growth Conditions 63
2.2.1 Bacterial Strains 63
2.2.2 Propagation and storage of bacteria 63
2.2.3 E.coli Transformation 64
2.3 Tissue Culture 65
2.3.1 Mammalian cell lines 65
2.3.2 Growth conditions and storage of cell lines 66
2.3.3 DNA transfections 67
2.3.4 Plasmid uptake equalisation 69 2.3.5 Chloroamphenicol acetyl transferse (CAT) assay 70
2.3.6 Luciferase assay 71
2.4 DNA Isolation and Analysis 72
2.4.1 Small scale plasmid DNA extraction from E.coli 72 2.4.2 Large scale plasmid DNA extraction from E. coli 73
VI
Page
2.4.4 Restriction analysis of DNA 75 2.4.5 Agarose gel electrophoresis 75
2.4.6 Purification of DNA 76
2.4.7 Phosphatase treatment of plasmid DNA 77
2.4.8 Ligation of DNA 77
2.4.9 Polymerase chain reaction (PCR) 78
Oligonucleotides for PCR 78
PCR reaction 78
Purification of products obtained from PCR 80
2.4.10 Southern blotting 82
2.4.11 Radiolabelling of DNA 83
Random-prime labelling reaction 83
2.4.12 Hybridisation 84
Post-hybridisation washes 85
Stripping filters 85
2.5 RNA Isolation and Analysis 86
2.5.1 Preparation of RNAase free materials 86 2.5.2 RNA extraction from mammalian cell lines 86
2.5.3 Quantitation of RNA 87
2.5.4 Preparation of cDNA 87
2.5.5 Formaldehyde gel electrophoresis of RNA 88
2.5.6 Northern Blotting 89
2.6 Protein Isolation and Analysis 89
vil
Page
CHAPTER THREE - Construction of antisense Oct 2 neuronal cell
lines
3.1 Introduction 101
3.2 Cloning of the antisense Oct 2 construct 104
3.3 Oct 2 RNA and protein levels in antisense Oct 2 cell lines 107
3.3.1 Oct 2 protein levels 107
3.3.2 Oct 2 PCR strategy 109
3.3.3 Oct 2 RNA levels 111
3.4 Analysis of antisense Oct 2 cell lines 114
3.5 Discussion 114
CHAPTER FOUR - Screening of antisense Oct 2 cell lines to identify
potential Oct 2 regulated genes
4.1 Introduction 120
4.2 Antibody screening of antisense Oct 2 cell lines 121
4.2.1 Immunocytochemistry 121
4.2.2 Immunoblotting 126
4.3 Tyrosine Hydroxylase protein levels in antisense Oct 2 cell lines 126
4.4 Tyrosine Hydroxylase mRNA levels in antisense Oct 2 cell lines 131
4.5 Discussion 133
CHAPTER FIVE - Investigation into the role Oct 2 plays in the
regulation of synaptic vesicle proteins
5.1 Introduction 138
5.1.1 Synaptic vesicle transport 138 5.1.2 Gene regulation of SNAP-25 and other synaptic vesicle proteins 140
5.2 Results 142
V lll
Page
5.3 Investigation into the effect of Oct 2 on the SNAP-25 promoter 144
5.4 Investigation into Brn 3a and Brn 3b levels in the antisense Oct 2 146
cell lines
5.5 Determination of expression levels of proteins involved in the synaptic 148
vesicle pathway
5.6 Investigation into the effect of Oct 2 on the synapsin I promoter 151
5.7 Discussion 154
CHAPTER SIX - Investigation into the role Oct 2 plays in the
regulation of neuronal nitric oxide synthase
6.1 Introduction 160
6.2 Results 165
6.2.1 nNOS protein levels in antisense Oct 2 cell lines 165 6.2.2 nNOS mRNA levels in antisense Oct 2 cell lines 166
6.3 Investigation into the effect of Oct 2 on the nNOS promoter in
BHK cells
169
6.4 Investigation into the effect of Oct 2 on the nNOS promoter in
ND7 cells
173
6.5 Identification of Oct 2 functional region involved in nNOS gene
regulation
175
6.6 Discussion 181
CHAPTER SEVEN - Discussion 192
IX
LIST OF FIGURES
Page
CHAPTER ONE
Figure 1.1 Model for the assembly of the RNA polymerase II preinitiation complex
4
Figure 1.2 Transcriptional Repression 8 Figure 1.3 Schematic diagram of the POU-domain and regions of homology 14 Figure 1.4 Schematic diagram of the binding of Oct 1 to the histone H2B
gene octamer
17
Figure 1.5 Mechanisms of gene regulation by POU-protein interactions 20 Figure 1.6 Schematic diagram of Bm 3 a, Bm 3 b and Bm 3 c 31 Figure 1.7 Diagram of the exon stmctures of the Oct 2 isoforms 39 Figure 1.8 Schematic diagram of Oct 2 repression of the HSV IE gene
expression
44
Figure 1.9 The catecholamine synthesis pathway 47 Figure 1.10 Dopamine and noradrenaline pathways in the rat brain 49 Figure 1.11 Schematic diagram of the Rat TH gene promoter 51
CHAPTER THREE
Figure 3.1 The creation of the antisense Oct 2 vector 106 Figure 3.2 Oct 2 protein levels in 16e and 22f cell lines 108 Figure 3.3 Oct 2 protein levels in G418 positive cell lines 110 Figure 3.4 Investigation into Oct 2 optimised PCR conditions 112 Figure 3.5 Oct 2 mRNA levels in antisense Oct 2 cell lines 113 Figure 3.6 Growth curves of ND7 cell line and antisense Oct 2 cell lines 115 Figure 3.7 Neurite outgrowth in antisense Oct 2 cell lines 116
CHAPTER FOUR
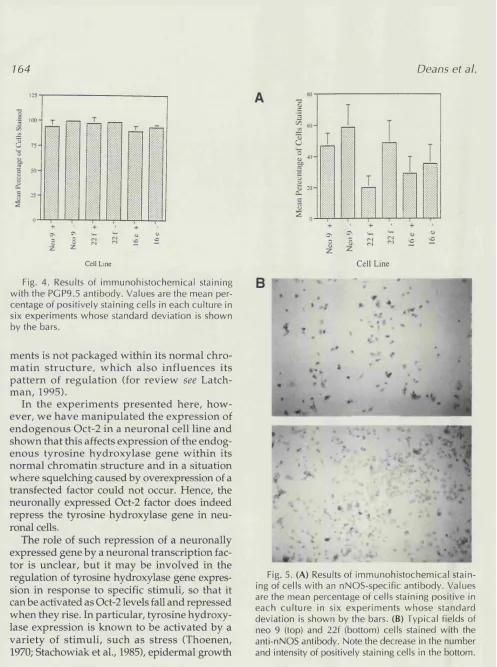
Figure 4.1 PGP9.5 immunostaining of the antisense Oct 2 cell lines 122 Figure 4.2 Mean percentage of cells immunostained by the anti-TH, 124
Page
Figure 4.3 Neuronal nitric oxide synthase immunostaining of the antisense 125 Oct 2 cell lines
Figure 4.4 Tyrosine hydroxylase immunostaining of the antisense Oct 2 127 cell lines
Figure 4.5 Mean percentage of cells stained by the anti-tyrosine hydroxylase 129 antibody
Figure 4.6 Tyrosine hydroxylase protein levels in antisense Oct 2 cell lines 130 Figure 4.7 Tyrosine hydroxylase mRNA levels in antisense Oct 2 cell lines 132
CHAPTER FIVE
Figure 5.1 Comparison of SNAP-25 protein levels in the antisense Oct 2 143 and parental cell lines
Figure 5.2 SNAP-25 mRNA levels in cell ines 16e, 22f and ND7 145 Figure 5.3 The effect of Oct 2 on the SNAP-25 promoter 147 Figure 5.4 Bm 3a and Bm 3b mRNA levels in the antisense Oct 2 cell lines 149 Figure 5.5 Synaptophysin and synaptotagmin I protein levels in the antisense 150
Oct 2 cell lines
Figure 5.6 Investigation into the synapsin I protein levels in the antisense 152 Oct 2 cell lines
Figure 5.7 The effect of Oct 2 on the synapsin I promoter 153
CHAPTER SIX
Figure 6.1 Westem blot analysis of nNOS protein levels in the antisense 167 Oct 2 cell lines
Figure 6.2 RT-PCR analysis of nNOS mRNA levels in the antisense Oct 2 168 cell lines
XI
Page
X ll
LIST OF TABLES
CHAPTER TWO
Page
Table 2.1 DNA plasmids 59
Table 2.2 Oligonucleotide sequences 62
Table 2.3 PCR conditions 81
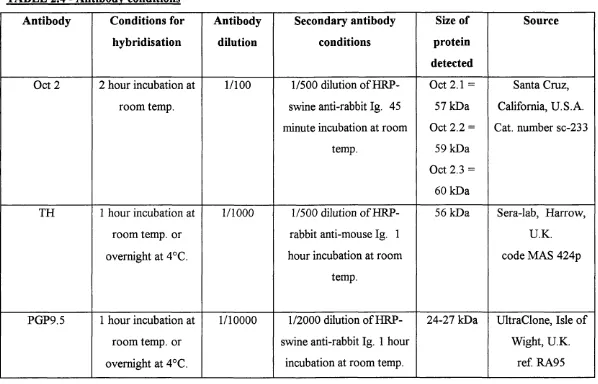
Table 2.4 Antibody conditions 95
CHAPTER SEVEN
Table 7.1 Summary table of the results obtained from immunocytochemistry 200 and immunoblotting of antisense Oct 2 cell lines and effect of
X lll
ABBREVIATIONS
A adenine
APS - ammonium persulphate
ATP - adenosine triphosphate
BHK cells - baby hamster kidney cells
C - cytosine
° c - degrees Celsius
cAMP - adenosine 3’,5’-cyclic monophosphate
CAT - chloroamphenicol acetyltransferase
cDNA - complementary deoxyribonucleic acid
CGRP - calcitonin gene-related peptide CMV - cytomegalovirus
dATP - 2’-deoxyribo-adenine triphosphate
dCTP - 2 ’ -deoxyribo-cytidine triphosphate
ddHzO - double distilled water
dGTP - 2’-deoxyribo-guanosine triphosphate
dTTP - 2 ’ -deoxyribo-thymidine triphosphate
DEPC - diethylpyrocarbonate
DNA - deoxyribonucleic acid E.coli - Esherichia coli
eNOS - endothelial nitric oxide synthase
G - guanine
GAP43 - growth associated protein 43
HRP - horseradish peroxidase
HSV - herpes simplex virus
IE - immediate early
Ig - immunoglobulin
iNOS - inducible nitric oxide synthase
kDa - kilodalton
M - molar
XIV
MMTV - mouse mammary tumor virus N-CAM - neuronal-cell adhesion molecule mRNA - messenger ribonucleic acid NGF - nerve growth factor
nNOS - neuronal nitric oxide synthase NO - nitric oxide
NT-3 - neurotrophic factor-3 NT-4 - neurotrophic factor-4 OCA-B - oct coactivator from B-cells OD - optical density
PCR - polymerase chain reaction PGP9.5 - protein gene product 9.5 POU - Pit-l/Oct/wMc
POUhd - POU-homeodomain
POUs - POU-specific domain
R - purine
RNA - ribonucleic acid
RT-PCR - reverse transcriptase-polymerase chain reaction SNAP 25 - synaptosomal-associated protein of 25 kDa T - thymidine
temp. - temperature
XV
LIST OF PUBLICATIONS
Deans,Z.C.. Dawson,S.J., Buttery,L., Polak,J.M.., Wallace,D. and Latchman,D.S. (1995) Direct evidence that the POU family transcription factor Oct 2 represses the cellular tyrosine hydroxylase gene in neuronal cells. Journal o f Molecular Neuroscience 6, p i59-167.
XVI
ACKNOWLEDGEMENTS
I would like to thank my supervisor. Professor David Latchman for his guidance and support throughout my time in his laboratory, and for all his help in the preparation of this manuscript. I would also like to thank Dr. Don Wallace for his encouragement and help with this project, especially during my time at Glaxo. Many thanks to Glaxo-Wellcome Research and Development Ltd. for the studentship which funded this work.
Special thanks to Dr. Sally Dawson for her endless help, moral support and scientific discussions over the last three years, and also many thanks to everyone in the laboratory especially, all members of the Oct 2 and Bm 3 transcription factor groups.
CHAPTER ONE
1.1 REGULATION OF GENE TRANSCRIPTION
1.1.1 General Introduction
In eukaryotes, cellular differentiation is mediated by specific patterns of gene expression. As the ability of individual cells to carry out their specific functions is crucial to the overall well being of the organism, then the control of gene expression must be tightly regulated. This can occur by many mechanisms, such as mRNA stability and post-translational modifications, but the primary level of control over gene expression occurs via the regulation of gene transcription within each cell type (for review see Latchman, 1995). Such regulation allows for many different types of cells to develop, each of which express only the proteins required for its own specific cell functions.
Each gene has a promoter region containing sequences which are bound by particular proteins known as transcription factors. Once DNA bound, these factors are able to interact either with other transcription factors, or with proteins involved in the basic transcription machinery and thereby influence the levels of gene expression. Transcription factors can act in response to external stimuli, such as heat shock, altered hormonal levels or [steroid induction. These stimuli act on the overall cell and via signal transduction pathways, induce transcription factor regulation of the gene promoter to alter the level of gene expression (for review see Hill and Treisman, 1995). By this method, transcription factors can tightly regulate gene expression in response to the needs of the cell.
The aim of this introduction is to discuss cell specific transcription factors which play an essential role in the regulation of gene expression, with particular reference to Oct 2, which is a member of the POU-domain transcription factor family.
1.1.2 Basal Transcription
RNAs are transcribed by RNA polymerase II (for review see Hernandez, 1993; Buratowski, 1994; Latchman, 1995). The action of this polymerase will be discussed.
Many genes contain a highly conserved sequence element known as a TATA box. This element is usually located 20-30 base pairs upstream of the transcriptional initiation site and has the consensus sequence 5’-TATAAA-3’ (Breathnach and Chambon, 1981). In order for a gene to be transcribed by RNA polymerase 11, a pre initiation complex comprising the polymerase and other associated proteins must be formed (see Figure 1.1). Initially, the TFIK) complex binds to the TATA box. Klages and Strubin (1995) demonstrated that this binding is the rate limiting step in transcription complex assembly in vivo. I FllD is not a single protein but is comprised of TBP (TATA binding protein) which actually binds the DNA sequence (Tanese et al., 1991; Hernandez, 1993), and coactivator proteins known as TAFs (TBP- associated factors) which are required for activation of transcription (Verrijzer et al.,
1995). DNA binding by TBP is sufficient for assembly of the RNA polymerase n complex leading to basal levels of transcription, but the TAF subunits of TFllD are required for higher, induced levels of gene transcription (Peterson et al., 1990; Pugh and Tijan, 1990; Smale etal., 1990; Verrijzer etal., 1995).
A number of genes do not contain a TATA box but transcription initiation still requires the recruitment of TBP to the DNA. This is thought to occur via protein- protein interactions between TBP and another transcription factor, which is DNA bound. From this position, TBP would be able to interact with the polymerase and other associated protein complexes to activate gene transcription (for review see Sawadogo and Sentenac, 1990; Pugh and Tjian, 1991; Buratowski and Sharp, 1992; Latchman, 1995).
In TATA containing promoters, regulation of gene transcription occurs by the sequential binding of several different protein complexes to the TATA box to initiate transcription. Following TFllD binding, TFllA is recruited to the DNA bound complex. The role of TFllA is not clear but it acts to enhance TBP binding affinity (Jacobson and Tjian, 1996) and it has been shown to interact with TBP through three lysine residues on the convex side of TBP (Buratowski and Zhou, 1992; Lee et al.,
FIGURE 1.1 - Model for the assembly of the RNA polymerase II preinitiation complex
The TFUD complex initially binds the DNA promoter region via the TBP protein interacting with the TATA box (A). The transcription factors TFIIA and TFUB then bind the protein complex (B), and then RNA polymerase II is recruited to the DNA (C). Other factors also join the preinitation complex (TFIIE, TFIIH, TFIIJ are shown). See text for more details of preinitiation complex formation.
TFIlD
TBP
INITIATION SITE
B
TFIID
TBP
TFIIA TFIIB
INITIATION SITE
TFIIE
TFIIH
Pol II
TFIID
TFIIJ
TFIIA TFIIB
enzymatic activity which may play a role in unwinding the DNA which is essential for the progress of transcription. A number of components of the general transcription machinery then bind the preinitation complex; TFIIE, TFIIH and TFIIJ, and directly interact with TBP (Choy and Green, 1993; Hernandez, 1993). The functions of these proteins are not fully understood but TFIIE acts as a DNA-dependent ATPase and may generate the energy required for transcription itself (Buratowski et al., 1988a). TFIIH also shows enzymatic activity and may help to initiate transcription (Drapkin et al., 1993; Drapkin and Reinberg, 1994).
Recent work has demonstrated that partially assembled RNA polymerase II complexes may exist within the cell (Kim et al., 1994; Koleske and Young, 1994; Ossipow et a l, 1995), and interact with TFIID and other components to form the complete preinitiation complex. Tliis would indicate that transcriptional activation was a two step process; initally the recruitment of TBP to the DNA, followed by the interaction with components of the preinitiation complex (Stargell amd Struhl, 1996).
The carboxy terminus of RNA polymerase II consists of a heptad repeat motif which interacts with TBP (Usheva et al., 1992). When this motif is phosphorylated, the interaction is abolished. This suggests that the enzyme is dissociated from the pre initiation complex by a phosphorylation mechanism and is then able to proceed along the DNA, transcribing the required primary transcript (for reviews see Corden and Ingles, 1992; Dahmus and Dynan, 1992; Drapkin et al., 1993; Drapkin and Reinberg,
1994).
The basal transcription machinery is active at a low level within all cell types. Specific gene transcription can be induced by increasing the rate at which the pre initiation complex is formed. This complex formation rate is determined by the interaction of many cw-acting sequences and trans-2iCX\n% factors. This is discussed in
Section 1.1.3.
1.1.3 General Transcriptional Regulation
with the RNA polymerase II itself (for reviews see Ptashne, 1986; Hernandez, 1993; Kingston and Green, 1994; Semenza, 1994; Tjian and Maniatis, 1994; Latchman,
1995).
Transcriptional Activation
Trans-2iC\mg factors have modular structures which allows for distinct
functional units within the protein. The majority of transcription factors have a DNA binding domain which recognises specific sequence elements. These elements can be situated directly adjacent to the transcriptional start site, as in the case of the TATA box, or they can be several hundred base pairs further upstream (known as enhancer sequences). It is fi'om this DNA bound position that further protein domains can interact with other cellular proteins to influence the rate of transcription initiation.
Before any /ra«5-acting factors can bind their specific recognition sequences, the DNA must be accessible to these binding proteins. DNA is arranged around core histone proteins to form a unit known as a nucleosome (for reviews see Komberg and Klug, 1981; Morse and Simpson, 1988). This packaged DNA is then folded again to form a solenoid of chromatin which results in condensing large stretches of DNA helix into tightly folded structures (for review see Felsenfeld and McGhee, 1986). Histone HI protein plays an important role in the formation of this solenoid structure and it has been observed that transcriptionally active DNA show depleted levels of this histone protein (Nacheva et al., 1989). The opening of the nucleosomal structure is an essential prerequisite for binding of factors which are concerned with transcriptional activation. The precise mechanism of the opening of such structures is unknown, although many factors may be involved; (1) the removal of a protein factor which maintains the chromatin structure, (2) the binding of proteins which prevent solenoid formation, (3) méthylation of bases which alter the binding of proteins and therefore allow the chromatin to be opened, and (4) modifications of the histone proteins which result in the breakdown of the chromatin strucutre (for review see Morse and Simpson, 1988; Felsenfeld, 1992; Hayes and WolfiFe, 1992; Croston and Kadonaga, 1993; WoLffe, 1994; Latchman, 1995).
associated with it or even with other transcription factors which in turn directly interact with the complex. The acidic domain of the Herpes simplex virus (HSV) protein, Vmw65, has been shown to interact with TBP (Stringer et a l, 1990). Single amino acid substitutions which inactivate Vmw65, abolished Vmw65-TBP interactions (Ingles et a l, 1991). Thus, it has been suggested that Vmw65 activates the assembly of the preinitiation complex by stabilising TBP binding to the TATA box (Tjian and Maniatis, 1994).
Vmw65 also interacts with another component of the preinitiation complex, TFIIB (Lin and Green, 1991). TFUB mutants, which retain basal function but cannot be activated above basal level, showed a lack of ability to interact with Vmw65 (Roberts et a l, 1993). These results imply that Vmw65 can also activate transcription by accelerating the recruitment of TFUB to the preinitiation complex (Roberts et a l,
1993).
The transcription factor, Spl, has been demonstrated to activate transcription by interacting with components of TFIID (Hoey et a l, 1993). The Spl glutamine-rich activation domains were found to selectively bind to a glutamine-rich domain of the TBP-associated factor, TAFII 110 (Hoey et a l, 1993; Gill et a l, 1994). TAFII 110 interacts with another TAF protein, TAFII 250 which can bind TBP (Takada et a l,
1992; Weinzierl et a l, 1993). Therefore, it appears that Spl activates gene transcription by interaction with TBP, via TAFII 110 and TAFII 250 (Hoey et a l,
1993; Weinzierl e / a/., 1993).
Transcription factors can activate gene expression by enhancing the formation of the preinitaition complex either by directly interacting with the proteins involved or by recruiting other factors which themselves activate the preinitation complex formation. The involvement of many proteins ensures that gene expression is tightly regulated.
Transcriptional Repression
FIGURE 1.2 - Transcriptional Repression
Four mechanisms of transcriptional repression are shown. (A) A repressor can compete with an activator for a DNA binding site and prevent gene activation. (B) An activator can be bound in solution thereby preventing gene expression. This is squelching. (C) The activity of an activator can be quenched by the binding of a repressor. (D) A repressor can directly bind a DNA binding site to inhibit gene expression.
%
Gene active Gene inactive
B
4-£©
Gene active Gene inactive
+
A Ï R
Gene active
Gene inactive
D
1
about the initiation of transcription. A negative acting factor binds the same DNA region and blocks the binding of the two transcriptional activators, so transcription of the gene is repressed (Goodboum et al., 1986; Zinn and Maniatis, 1986).
Transcription factors can also inhibit gene expression by binding to activating proteins and prevent their binding to the DNA. This repressor/activator complexing prevents the activator from binding it’s recognition site and the gene remains untranscribed. This phenomenon is known as squelching (see Figure 1.2B), and is the mechanism by which the inhibitory transcription factor, Id, prevents the activation of genes required for fibroblast differentiation (Benezra et a l, 1990). This is explained in more detail in Section 1.1.4.
A similar act of repression occurs when the activation domain of an activator protein is blocked by a negatively acting transcription factor. This effect is quenching and again prevents gene expression (see Figure 1.2C). The yeast GAL80 transcription factor prevents the activation of galactose metabolising genes mediated by GAL4 by quenching (Johnston et al., 1987). This example is discussed in more detail in Section
1.1.4.
Repressor proteins can also bind DNA sequences (silencer elements) and exert a direct effect on other proteins, such as those directly involved in the formation of the pre-initiation complex (see Figure 1.2D). An example of direct repression is the ability of Drosophila even-skipped protein to repress transcription from a promoter which lacks any DNA binding sites for any activating proteins (Han and Manley, 1993). Another example is repression of the HSV immediate early (IE) gene promoter by the POU-protein Oct 2 (Kemp et al., 1990; Lillycrop et al., 1991). The HSV IE gene promoter TAATGARAT binding motif was shown to confer gene repression in the sensory neuronal ND7 cell line (Kemp et al., 1990; Wheatley et a l, 1991). Further work determined that the Oct 2 transcription factor was able to repress HSV IE promoter activity by binding to this motif (Lillycrop et a l, 1991). Furthermore, ectopic expression of Oct 2 in permissive BHK cells inhibited HSV IE gene activity to prevent the viral lytic cycle, implying that Oct 2 directly represses HSV IE gene expression (Lillycrop e ta l, 1994a).
10
upon the concentration of this protein (Sauer and Jackie, 1991; 1993). When present at low levels, then Krüppel monomers act as transcriptional activators. This activation appears to be mediated via the Krüppel N-terminus (Sauer and Jackie, 1991; 1993). If the concentration of this protein is increased, then homeodimers are formed through sequences within the C-terminus region and gene transcription is repressed by the j&wppe/N-terminus (Sauer and Jackie, 1993). Therefore, transcription factors cannot only activate and repress specific promoters, but they themselves can alter their ability to regulate gene transcription in response to specific stimuli. In the case of Krüppel,
such stimuli would change the concentration of this transcription factor, to alter gene transcription levels.
1.1.4 Cell Specific Gene Regulation
An additional level of transcriptional regulation is seen at the cell specific level. Many proteins are expressed in certain cell types to bring about the required phenotype and function of that particular cell. The required gene expression pattern arises fi'om the interaction between transcription factors to bring about the expression or repression of specific genes at a precise moment in time. An example is the MyoDl transcription factor which is expressed in undifferentiated fibroblasts. MyoDl forms heterodimers with proteins E12 and/or E47 to activate genes which induce cell differentiation (Davis et al., 1987; Benezra et al., 1990). This activation can be inhibited by the formation of E12/E47 heterodimers with another transcription factor. Id. This prevents the formation of MyoD 1 -E12/E47 functionally active heterodimers, and therefore gene activation is not induced (Benezra et al., 1990). Fibroblast cell differentiation is therefore regulated by the level of expression of MyoDl and Id transcription factors, and an alteration in the expression of either transcription factor can determine whether the genes are activated or repressed. The mechanism by which Id represses MyoDl activity is an example of squelching (Section 1.1.3).
11
levels fall, the GAL80-GAL4 heterodimers dissociate and the GAL4 protein is free to activate the galactose metabolising genes (Lohr and Hopper, 1985; Johnston et al.,
1987). This shows that tight gene regulation can occur via protein-protein interactions and that these interactions are dependent upon which proteins are expressed in a specific cell at a certain period of time.
Gene promoters tend to contain binding sites for many transcription factors and regulation is brought about by the interaction of different transcription factors which are expressed in that cell. Therefore, a relatively small number of transcription factors can tightly regulate a wide range of genes by being expressed in a highly specific temporal and spatial manner.
1.2 THE POU-DOMAIN PROTEIN FAMILY
1.2.1 Introduction to the POU-domain family
Transcription factors are classed into families on the basis of sequence homology in regions of the proteins. The DNA binding domains are highly conserved and many families have been identified based on these conserved domains, e.g. Leucine zipper proteins. Zinc finger proteins, helix-tum-helix proteins (for reviews see Latchman, 1990a; Pabo and Sauer, 1992; Verrijzer and Van der Vliet, 1993; Latchman, 1995). The helix-tum-helix protein family DNA binding domain structure has been investigated and nuclear magnetic resonance work carried out with the bacteriophage ^-repressor protein (Pabo and Lewis, 1982). It has been shown that this domain comprises an a-helical region which lies across the major DNA groove, followed by a P-tum, then a second a-helix. This second a-helical region is known as the recognition helix and lies partly within the major groove to make sequence specific contact with the DNA (Steitz et al., 1982).
12
proteins were originally identified as being involved in the development of the fruit fly
Drosophila melanogaster (McGinnis et al., 1984; Scott and Weiner, 1984). More than 30 homeodomain genes have been isolated in Drosophila to date, and many other members expressed in a wide range of organisms such as a nematode worm to mammalian cells, have been identified (reviewed in Gehring, 1987; Scott and Weiner,
1989).
A subclass of homeodomain proteins are the POU-domain proteins. This family was named after the original members identified; (1) the pituitary specific protein g t 1. This protein activates the expression of the growth hormone and prolactin genes and is necessary for the development of lactotroph, somatotroph and thyrotroph cells of the anterior pituitary gland (Ingraham et al., 1988), (2) the ubiquitously expressed Oct 1 which is thought to play a role in the regulation of housekeeping genes (Sturm et al.,
1988), (3) Oct 2 which was originally identified in B-lymphocytes where it was shown to activate immunoglobulin gene expression (Clerc et al., 1988), and (4) the neuronal developmental regulatory protein unc-86 which is expressed in Caenorhabditis elegans (Finney et al., 1988). All members of this family encode a highly conserved POU-domain whose main role is specific DNA binding. This domain is comprised of a
13
1.2.2 The POU domain
The POU-protein family members all contain a POU-domain of 150-160 amino acids in size, comprising of a homeodomain-like motif and a separate POU-specific domain (see Figure 1.3A). These domains are joined by a non-conserved linker sequence. The individual regions of the POU-domain will now be discussed.
The POU-homeodomain (POUhd) is a 60 amino acid region which is related to
the classic homeodomain motif. The POUhd has a triple helix structure with a flexible
N-terminus. The second and third helices form the hehx-tum-helix motif that is associated with homeodomain proteins (see Figure 1.3A; Steitz et al., 1982). The third helix encodes a cluster of 3 amino acids which are highly conserved in all POU- proteins (Herr et a l, 1988). This group consists of tryptophan (W), phenylalanine (F) and cysteine (C) residues, with the tryptophan and phenylalanine being conserved among homeobox proteins but the cysteine being unique to the POU-protein family (Figure Î 1.3 A). This cysteine residue is in position 9 which has been identified as being important in sequence recognition in all classic homeodomain proteins (Treisman et a l,
1989; reviewed in Treisman et a l, 1992; Latchman, 1995). The mechanisms of DNA binding by the POU-domain will be discussed more fully in Section 1.2.3.
The POU specific domain is specific only to members of the POU-protein family (Figure 1.3 A). This domain is 74-82 amino acids in size and can be divided into two highly conserved regions; POUs-A and POUs-B (Herr et a l, 1988; reviewed in Verrijzer and Van der Vliet, 1993). Both of these regions contain a cluster of basic amino acid residues whereas the C and N termini of the overall POUs domain contains acidic amino acid residues (Cox et a l, 1993). This arrangement may be important in DNA binding. Nuclear magnetic resonance studies have determined a stable structure comprising of two long and two short a-helices (Dekker et a l, 1993) of which the third helix is important in DNA binding. The mechanisms of sequence recognition and DNA binding will be discussed in Section 1.2.3.
The POUs and POUhd domains are joined by a hypervariable region known as
FIGURE 1.3 - Schematic diagram of the POU-domain and regions of homology
(A) The POU-specific domain (shown in green) consists of four helices which make up regions POUs-A and POUs-B are shown. The cluster of basic amino acids (+++) and acidic amino acids (—) are indicated. The POU-homeodomain is shown in red and helix 3 is thought to be the recognition helix which makes contact with the
DNA. The non-conserved linker region is shown in yellow.
Adapted fi'om Wegner et al. (1993) and Verrijzer and Van der Vliet, (1993).
P O L - s p e c i f i c d o m a i n P O U h o m e o d o m a i n
P O U s -A P O U s-B
N - t e r m in a l
arm W F C r e g i o n
2
(K7~(V(
e
II 4
H ZD -Ti
0{2
3EE(f
B
POU-SPECIFIC DOMAIN
Pit-1 RRIK
Oct 1 RRIK
Oct 2 RRIK
Brn3 RRIK RRIK LGYTQTNVGE LGFTQGDVGL LGFTQGDVGL LGVTQADVGS LGVTQADVGK
ALAAVHGSEF ...SQTTICR AMGKLYGNDF ...SQTTISR AMGKLYGNDF ...SQTTISR ALANLKIPGV GSLSQTTICR ALAHLKMPGV GSLSQTTICR FENLQLSFKN FEALNLSFKN FEALQLSFKN FESLTLSHNN FESLTLSHNN ACKLKAILSK MCKLKPLLEK MCKLKPILEK MIALKPILQA MVALKPILHS WLEEAEQVGA WLNDAENLSS WLNDAETMSV WLEEABGPQR WLEKAEEAMK Pit-1 Oct 1 Oct 2
Brn 3
unc-86
POU-HOMEODOMAIN
15
position the POUs and POUhd domains around the DNA so as to aid in sequence specific binding (Herr and Cleary, 1995).
1.2.3 Mechanisms of DNA binding bv POU proteins
Research carried out to identify the consensus DNA binding sites of all POU- protein transcription factors has identified that they tend to be A/T rich and the consensus sequence is 8 nucleotides in length (reviewed in Verrijzer and Van der Vliet, 1993). Oct 1 and Oct 2 bind with high affinity to the sequence 5’ ATGCAAAT 3’, which is now known as the “octamer” (Verrijzer et a l, 1992). All other members of the POU family can also bind this octamer motif, but it is not known if this site is the optimum binding site for all of these proteins as binding to alternative sequences has been observed. It has been proposed that POU-proteins have different affinities for sequence variants and the precise binding site sequence can determine their function. This is seen with the binding of Oct 1 and Oct 2 to the Herpes Simplex virus immediate early ICP4 promoter sequence 5’ TAATGARAT 3’ (Baumruker et al., 1988). This binding is with low affinity but is enhanced by the presence of an octamer-like motif which overlaps the TAATGARAT sequence in other HSV immediate early promoters (Dent and Latchman, 1991).
Other examples of POU-protein binding to variations of the octamer motif, is the binding of Oct 2 to the immunoglobulin heavy chain gene promoter and the tyrosine hydroxylase gene promoter. These will be discussed in more detail in Sections
1.3.3 and 1.3.5, respectively.
16
Nuclear magnetic resonance studies have proposed that the binding of the
POUhd is within the major groove of the DNA (see Figure 1.4). The helix III (the recognition helix) [see Section 1.2.3] is involved in interaction with the DNA bases (Dekker et a l, 1993). The POUs domain was determined to be situated in the adjacent DNA major groove (see Figure 1.4), again with the recognition helix (see Section
1.2.3) positioned such as to facilitate DNA binding (Dekker et a l, 1993).
The observations that POUs and POUhd domains bind distinct DNA regions agree with work carried out to determine the specific binding sites of these domains. Verrijzer et a l (1992) carried out many DNA binding studies to reveal that the POUs
domain binds to the “left half’ of the octamer sequence, which has the consensus sequence, 5’ gAATAT^/jCA 3’. This binding is very specific, and confers the tight specificity of the POU domain DNA binding. However, the POUhd also binds a distinct sequence itself; the “right half’ of the octamer, which has the consensus sequence, 5’ RTAATNA 3’ (Verrijzer et a l, 1992). The binding of this sequence is not as strict as the POUs domain binding to the “left half’ of the octamer. This may give rise to the ability of the POU domain to bind other sequences, such as the HSV ICP4 TAATGARAT element as well as binding the consensus octamer (Baumruker et a l, 1988). Although there is no interaction between the POUs and POUhd domains in solution (Verrijzer et a l, 1992), chimeric studies with Oct 1 and Pit-1 domains show that the POUs domain must influence the binding of the POUhd to specific DNA
sequences (Aurora and Herr, 1992). This may result in the activation or repression of a gene carrying a degenerate octamer binding sequence. This influence of the POUs
domain over the POUhd DNA binding may also involve DNA bending. Verrijzer et a l
(1991) demonstrated that DNA bending occurred in the “left half’ of the octamer sequence by compression of the major groove, i.e. where the POUs domain is assumed to bind. The exact aim of this DNA structure bending is unknown, but it may facilitate protein-protein interactions with other DNA bound proteins. It has been proposed that this occurs when adjacent POU-proteins bind DNA for enhanced transcriptional activation. This has been observed with Pit-1 which forms dimers when DNA bound via the POUs domain (Ingraham et a l, 1988). Protein-protein interactions mediated by the POU-domain will be discussed in more detail in Section 1.2.5.
The spacing between the motifs which are bound by the POUs and POUhd
FIGURE 1.4 - Schematic diagram of the binding of Oct 1 to the Histone H2B
gene octamer.
The POUhd domain is shown in red and is situated in the DNA major groove
where it binds the 3’ AAAT sequence of the octamer. The POUs domain is shown in green and is situated in the major groove on the opposite side to the POUhd domain,
where it binds the 5’ ATGC DNA sequence. The flexible linker region is shown in yellow.
18
sequences which have 0, 2 or 3 nucloetides inserted in the middle of the recognised binding site (Li et al., 1993). Bm 3 however, will only bind to sequences which have 3 nucleotides inserted between the two core binding motifs (Li et al., 1993). It was proposed that this specification on core binding site spacing was due to three amino acids situated in the Bm 3 amino terminal basic region of the POUhd which interact with the minor DNA groove and may mediate the ability of the POUs domain to bind the major groove (Li et al., 1993). Interestingly, this would mean that specifc amino acid residues within the POU-domain would be able to influence the binding of other domains to specific DNA sequences.
1.2.4 Regulation of DNA binding by Phosphorylation
Transcription factor DNA binding can be regulated not only by sequence specific binding, but also by post-translational modifications, such as phosphoiylation of the transcription factor itself. Pit-1 POUhd has a threonine at position 7 which can be phosphorylated in vivo in response to an extracellular signal, e.g. phorbol esters or cAMP (KapilofiF et al., 1991). The phosphorylation of this residue can change the conformation of Pit-1 (Kapiloff et al., 1991). This change in Pit-1 stmcture has been shown to alter sequence specificity of Pit-1 DNA binding, as well as increase DNA bound Pit-1 dimérisation (KapilofiF et al., 1991). This could allow other specific Pit-1 fimctional domains to become accessible to other proteins, leading to protein-protein interactions which would recmit proteins to the DNA having an effect on transcriptional regulation.
Oct 1 contains a serine residue at the same position of the POUhd which is
phosphorylated when the cell enters the mitotic phase of the cell cycle and is dephosphorylated as the cell enters the Gi growth phase (Roberts et al., 1991; Segil et al., 1991a; 1991b). This period of the cell cycle when Oct 1 is phosphorylated is when transcription is halted, so it it might be expected that the phosphorylation of this serine residue inhibits DNA binding. Segil et al. (1991a; 1991b) showed that Oct 1 DNA binding is indeed obliterated by Oct 1 phosphorylation in vitro by protein kinase A which correlates with the cell cycle observations.
19
either in response to environmental signals (such as via cAMP) or at particular periods of the cell cycle.
1.2.5 Protein-protein interactions mediated bv the POU-domain
As well as DNA binding the POU-domain is thought to play a role in protein- protein interactions which influence transcriptional expression. Such interactions between transcription factors allow the regulation of many genes in a very sensitive and precise mechanism. Three examples of such interactions will be discussed.
The Drosophila developmental POU-protein, Cfl-a is involved in transcriptional regulation of the dopa decarboxylase (Dde) gene (Johnson and Hirsch, 1990). Treacy et al. (1991) identified the formation of heterodimers of Cfl-a with a second POU-protein, I-POU, in solution. The POUhd of I-POU is very homologous to the POU-proteins unc-86 and Bm 3, except for the omission of 2 basic amino acid residues in the N-terminus, which are highly conserved between other POU-proteins (Treacy et al., 1992). This altered N-terminus of the POUhd abolishes DNA binding (Treacy et al., 1992). However, the N-terminus and helices I and U of the I-POU homeodomain have been identified as being capable of high affinity binding to the Cfl- a protein (see Figure 1.5A), thereby preventing the Cfl-a protein from binding specific C75-elements situated in the Dde gene promoter (Treacy et al., 1991; 1992). This heterodimerisation therefore inhibits Cfl-a activation of Dde gene transcription.
This I-POU/ Cfl-a protein-protein interaction is highly specific. I-POU does not bind any other POU-proteins, not even Bm-2 which differs fi'om Cfl-a by only 3 amino acids within the POUhd (Treacy et a l, 1992). As I-POU is co-expressed with Cfl-a in certain neuronal subsets during Drosophila development (Treacy et al., 1991), this protein-protein interaction has been proposed to play a critical role in regulation of the Dde gene expression pattern.
FIGURE 1.5 - Mechanisms of gene regulation bv POU-protein interactions
(A) Schematic diagram of transcriptional regulation by I-POU and tl-POU. The I-POU primary transcript is alternatively spliced to give; I-POU protein (shown in green) which forms heterodimers with Cfl-a (shown in yellow), thereby preventing Cfl-a DNA binding. This results in the inhibition of gene activation by Cfl-a, and tl- POU (represented in blue), which binds DNA and can activate gene transcription. Adapted from Treacy et al. (1992).
(B) Oct 1 DNA binding sites and Oct lA^mw65 complex formation, (i) The cellular Oct 1 protein can bind the HSV EE TAATGARAT motif but does not activate gene transcription, (ii) The viral Vmw65 protein can form a complex with Oct 1 and when the complex is DNA bound, Vmw65 can activate gene transcription. See text for discussion (Section 1.2.5).
I-P O U gene
Transcription/RNA processing
■ :
i
tl-POU
(D N A binding product)
+
r
gene activation
C fl-a
1
I-POU
(Protein binding product)
1
rl
gene inhibition
B
(I)
C 3
Oct 1
(ii)
Oct I/Vmw65 complex
X
C ~> , |H
21
(Treacy et al., 1992). Once DNA bound, tl-POU can activate neuronal gene expression, thereby having the opposite effect from I-POU itself (see Figure 1.5 A).
From these studies, it has been observed that from one gene, two proteins are translated, one of which can activate and the other inhibit neuronal gene expression (see Figure 1.5A). As both proteins are expressed in equal amounts during Drosophila neuronal development (Treacy et a i, 1992), there is a fine balance between protein- protein interactions and DNA binding which leads to a complex and precise pattern of gene expression in different subsets of neurons.
When the Herpes simplex virus (HSV) type 1 infects a host, the viral immediate early (IE) genes are transcribed within a short time by the host’s RNA polymerase II (Costanzo et al., 1977). The initiation of this gene expression is brought about by the interaction of cell and virus trans-diCtmg factors (Gelman and Silverstein, 1987). The HSV structural virion protein, Vmw65 (also known as VP 16) is a major HSV late protein which enters the cell in the infecting virion and plays a key role in the initiation of IE gene transcription (Batterson and Roizman, 1983). However, this protein lacks any DNA binding domain and therefore has to form a protein complex with a host DNA binding protein, Oct 1 to bring about gene expression (see Figure 1.5B; Gerster and Roeder, 1988; O’Hare and Goding, 1988; O’Hare et al., 1988). Oct 1 is an ubiquitously expressed POU-protein which binds the consensus octamer sequence with high affinity (Fletcher et al., 1987). The DNA bound Oct 1 cannot activate the HSV IE genes (Tanaka et al., 1988), but when complexed with Vmw65 activation occurs (see Figure 1.5B). This is due to a strong acidic /ra«5-activation domain in the C- terminus of Vmw65 which is not involved in Oct 1 complexing, and therefore is able to activate transcription fi'om the DNA bound position (Sadowski et al., 1988; Triezenberg etal., 1988; Consens etal., 1989; Greaves and O’Hare, 1990).
22
1 can bind this site with higher affinity than the TAATGARAT alone or the octamer alone (Dent and Latchman, 1991) thereby enhancing gene expression. The bases, GARAT, around the octamer-like sequence (ATGCTAAT) are proposed to play an important role in recruiting or the functioning of Vmw65 as when mutated, Oct 1 can bind DNA but cannot interact with Vmw65. Normally, if the Oct 1 protein binds the TAATGARAT motif without Vmw65 interaction, then it is proposed that the GARAT sequence induces a conformational change in the POU- domain to inhibit Vmw65 interaction and the IE gene remains untranscribed (Walker et a l, 1994).
Other POU-proteins which recognise the octamer sequence can also bind the TAATGARAT sequence, as well as the octamer/TAATGARAT overlapping motif. Oct 2 binds both with high affinity, especially the overlapping sequence (Dent and Latchman, 1991). Unlike Oct 1, Oct 2 does not recruit Vmw65 to the DNA and therefore does not initiate HSV IE gene expression. The POUhd of Oct 1 and Oct 2 differ by seven amino acids. These amino acids are thought to be accessible for protein-protein interactions when the homeodomain is DNA bound (Lai et al., 1992). Vmw65 recognises two of these seven amino acid differences and it has been shown that the glutamine at position 22 of the first a-helix in Oct 1 POUhd is the key
determinant by which Vmw65 discriminates between Oct 1 and Oct 2 (Lai et al.,
1992). However, other residues which are identical between Oct 1 and Oct 2 are as important for Vmw65 interaction such as the glutamine at position 22 (Pomerantz et al., 1992). Although Oct 2 does not interact with Vmw65, it plays a role in HSV EE gene regulation by binding the TAATGARAT sequence and blocking the binding of the Oct 1/Vmw65 complex. Therefore gene transcription is prevented (Lillycrop et al., 1991). This will be discussed in more detail in Section 1.5.4.
The ability of transcription factors to bind numerous degenerate sequences whether directly or via protein-protein interactions allow many genes to be regulated in a specific manner by proteins expressed within that particular cell type.
The octamer binding factors, Oct 1 and Oct 2 (Sturm et al., 1988; Clerc et al.,
23
studies of Oct 2 indicated that this interaction occurs between the POUhd of Oct 2 and the highly conserved core domain of the TBP C-terminus and was shown by Zwilling
et al. (1994) to occur in vivo as well as in vitro. As the POU domain of Oct 1 is homologous to Oct 2, then as expected, the POUhd of Oct 1 also has the ability to
interact with TBP (Zwilling e ta l, 1994). Transient co-transfection studies of an Oct 2 expression vector into a plasmacytoma cell line with a plasmid containing 4 copies of the octamer motif upstream of the HSV thymidine kinase TATA box resulted in a high level of promoter activity. When a TBP expression vector was also co-transfected, a massive increase in promoter activity was observed (Zwilling et al., 1994), suggesting that Oct 2 and TBP do interact in vivo in a synergistic manner to activate gene transcription. Moreover, Amosti et al. (1993) characterised another interaction of Oct 2 with TFHD. Deletion of the N-terminus of Oct 2 which contains a glutamine-rich region, abolished the majority of gene activation. This suggests that the N-terminus of Oct 2 may be required for the formation of the preinitiation complex. However, Seipel
et al. (1992) showed that this N-terminus was only active when Oct 2 was bound to an octamer motif Avithin the gene promoter region. When bound at an enhancer octamer element, then other functional domains of the Oct 2 protein were active.
Further work with small nuclear RNA (snRNA) promoters has shown that Oct 1 and Oct 2 POU-domains are able to interact with the basal transcription protein,
SNAPc and induce binding of this protein to a specific DNA sequence and thereby bring about the transcription of RNA polymerases II and II snRNA genes (Mittal et al., 1996). This effect is not observed with Pit-1 indicating that the amino acids which are Oct 1 and Oct 2 specific may play a role in conferring such binding of the POU- protein with the SNAPc protein (Mittal et al., 1996).
24
et al., 1988). Hence, as Oct 2 regulates immunoglobulin gene expression in B- lymphocytes, then it is possible that Oct 2 plays a role in the regulation of neuronal gene expression in sensory neurons. Further work also led to the identification of the Bm 3 POU-protein in sensory neurons (He et al., 1989). Therefore, as sensory neurons express many POU-proteins then these cells have been used as a model to investigate the functional properties of POU-proteins.
1.3 Sensory N euronal C ells
1.3.1 Introduction
The nervous system is composed of a complex organisation of distinct populations of neurons, each of which have different properties and characteristics dependent upon their function. Most neurons are derived fi'om the same progenitor cell and depending upon specific factors encountered during development, follow a precise differentiation pathway. In vertebrates during embryogenesis, the nervous system is formed from a sheet of elongated neuroectodermal cells called the neural plate. This sheet folds to form the neural tube and the neural crest. From the neural tube develops the neurons, glia cells and spinal cord which make up the central nervous system (for reviews see Anderson, 1994; Bronner-Fraser, 1994; Ross, 1996). Neural crest cells migrate in specific patterns to develop the peripheral nervous system and sensory neurons are derived from such neural crest cells which have migrated by a ventral pathway (Le Douarin et al., \9%\).
The precise mechanisms which determine the fate of such neural crest cells remain unknown, although many factors which influence such a decision have been studied. Many proteins are expressed in the developing cell to bring about a specific pattern of cellular differentiation, and extracellular stimuli can affect the decision of the cell to differentiate into a particular neuron.
25
1.3.2 Neuronal Development
Neuronal cell survival and development is dependent upon neurotrophins which are produced by target cells (for review see Barbacid, 1995). These neurotrophins, including nerve growth factor (NGF), brain-derived neurotrophic factor (BDNF), neurotrophic factor-3 (NT-3), neurotrophic factor-4/5 (NT-4/5) and neurotrophic factor-6 (NT-6) promote the survival of certain neurons so they are matched to the specific target cells from which they are expressed. Studies of neurotrophin “knockout” mice have demonstrated that different neurotrophins are concerned with the survival of distinct neuronal cell populations (Crowley et al., 1994; Emfors et al.,
1994a; 1994b). Mice lacking NGF show loss of sensory and sympathetic neurons but have normal populations of basal forebrain cholinergic neurons implying that other neurotrophins do not compensate for the absence of NGF during the development of particular subsets of neurons (Crowley et al., 1994). Many nerve cells embark upon development and a proportion undergo apoptosis once their target cells have been reached. In the case of sensory neurons, more than half of the developing neurons apoptose (Barde, 1989; Hamburger, 1993). The production of neurotophins ensures that each target cell forms a synapse with an appropriately developed neuron and when this arrangement has been made then apoptosis is induced in the redundant neurons (for review see Heymach and Barres, 1995). It has been shovm that cultured sensory neuronal survival is enhanced by the presence of NGF and removal induces major cell death (Barde, 1989; Hamburger, 1993). The mechanisms of this effect are unknown although transcription factors have been identified which are regulated by NGF in PC12 cells (Milbrandt, 1987; Oppenheim, 1991). NGF has also been shown to upregulate the expression of the POU-protein Oct 2 in sensory neurons (Wood et al.,
1992; Kendall et al., 1995).
26
itself implying that the adult neuron is capable of self-survival (Emfors et al., 1990; Schecterson and Bothwell, 1992). Also glial cells which mainly develop after target innervation, may provide additional neuronal survival factors (Heumann et a l, 1987).
Neuronal development appears to involve many factors which interact to promote cell survival or cell death depending upon the requirements of the target cell. Many of these factors have been studied but the mechanisms of such cell-specific gene regulation remains unknown. The identification of the transcription factors responsible for these mechanisms will be important in the understanding of such precise, cell- specific gene regulation.
1.3,3 Neuronal Differentiation
Neuronal cells differentiate to enable the transport of nerve impulses to target cells. Neuronal differentiation involves the formation of neurites which must be able to retain a stable structure but also show mobility during growth to reach the target field. This stability and the formation of a growth cone is regulated by factors such as NGF. Studies which withdraw NGF from neuronal cultures show that neurite outgrowth cannot be maintained (for review see Anderson, 1993). Proteins which are involved in maintaining the neuronal cell structure will be discussed.
Neuronal differentiation occurs in two phases. The initial phase involves the formation of processes which elongate by using actin and myosin for growth cone locomotion, and microtubules and microtubule associated proteins (MAPs) which aid in the movement of proteins synthesised in the cell body to the developing axon terminus (for review see Mandelkow and Mandelkow, 1995). The second phase involves the increase in axonal diameter by rearrangement of microtubules and MAPs, and neurofilament accumulation to form the abundant cytoskeleton (for review see Cleveland, 1996). Differentiating neurones also contain structural proteins which maintain the cellular structure during development, e.g. vimentin, a-intemexin and keratins (for reviews see Fuchs and Weber, 1994; Klymkowsky, 1995).
27
expressed at high levels during neuronal development and following peripheral nerve injury (Strittmatter et a l, 1992). Protein levels decrease in mature neurons implying that GAP-43 is associated with neuronal differentiation (Strittmatter et al., 1990; Baetge and Hammang, 1991).
To reach the desired target field, which may be some distance from the neuronal cell body, the developing neurites cross many surfaces. To enable elongation over such distances, the neurites must anchor themselves by using cell adhesion molecules (CAM), such as neuronal-CAM (N-CAM). These molecules are present in the neuronal growth cone and interact with CAMs present in other axons and non neuronal cells which are in the pathway of the developing neuron. CAMs are proposed to also induce neurite outgrowth although the precise mechanisms are unknown. Several secondary messenger pathways involving; (1) calcium (Williams et at., 1994b) and (2) the FGF receptor (O’Brien, 1995; Williams et a l, 1995) have been established but the full picture is not yet clear.
Environmental factors also can influence the movement of these developing neurites, e.g. the presence of collapsin induces growth cone collapse (Luo et al., 1993) and netrins which attract neuronal outgrowth (Serafim et al., 1994).
In summary, the developing neuron expresses many different proteins which are required for neuritic outgrowth. Such expression is mediated by transcription factors which tightly regulate gene expression in response to environmental factors which influence the fate of the neuronal cell.
1.3.4 Sensory neuronal cell line. ND7
2 8
to Study sensory neuronal cell properties and characteristics especially during differentiation, the ND (Neuroblastoma + Dorsal root ganglia) cell lines were created. These immortalised rat-mouse hybrid cell lines were derived from neonatal rat dorsal root ganglia neurons which were fused with the mouse neuroblastma N18Tg2 cell line (subclone of C l300 cell line) [Wood et a l, 1990]. Several of these cell lines were isolated which exhibited sensory-neuron like properties which were not displayed by the neuroblastoma cell line. These included ND3, ND7 and ND23 which could be induced to differentiate and showed many features associated with sensory neurons: cell proliferation was halted, the cell bodies were flattened and processes were extended from the neuronal cell (Wood et al., 1990). Further studies were carried out to determine the extent of these characteristics. General neuronal cell markers were detected with antibodies raised against (1) PGP9.5 which is a marker for vertebrate neurons, nerve fibres and neuroendocrine cells (Thompson et al., 1983) and (2) neurofilament subunits (antibody R39) [Dahl and Bignami, 1977]. The ND cell lines expressed high levels of these markers whilst proliferating and during differentiation, as displayed by sensory neurons. Also, sensory neurons support HSV latent infections and it was observed that the cell lines ND3 and ND7 were able to be latently infected by HSV (Wheatley et al., 1990). Furthermore, the ND7 cell line has been shown to transcribe the latency associated transcripts (LATs) which are required to prevent HSV IE gene expression in sensory neurons (for review see Latchman, 1990b). These cell lines were also characterised by their ability to depolarize in response to bradykinin and capsaicin (Wood et al., 1990; Wheatley et al., 1992b). The ND7 cell line was found to closely resemble sensory neuronal cells and has been used in further studies.
29
processes not as much redistribution was evident as with NPY (Suburo et al., 1992). Proteins which are associated with secretory granuoles (chromagranins A and B) were not detected in the undifferentiated ND7 cell line. Upon differentiation, high levels of these proteins were seen at the ends of the growing processes (Suburo et al., 1992; Wheatley et al., 1992b). However, synaptophysin which is a marker of synaptic-like vesicles was detected within the Golgi body during proliferation. Interestingly, during differentiation although more protein was evident, the distribution of synaptophysin did not change. This protein was only transported to the axonal termini when the neurites were of considerable length (Suburo et a l, 1992; Wheatley et al., 1992b).
The ND7 cell line is a model for studying dorsal root ganglia sensory neuronal characteristics. Moreover, as observed in sensory neurons, this cell line expresses the POU-proteins, Oct 1 , Oct 2 and Bm 3 (Hatzopoulos et al., 1990; Wirth et al., 1991; Latchman et al., 1992; Lillycrop et al., 1992). Oct 1 has been demonstrated to regulate the expression of housekeeping genes (Sturm et al., 1988). However, the functions of Oct 2 and Bm 3 in sensory neuronal cells are not fully understood. Therefore the ND7 cell Une has allowed research to be carried out into the roles each of these proteins play in sensory neuronal gene regulation. The POU-protein transcription factors, Bm 3 and Oct 2 will be discussed.
1.4 B m 3
1.4.1 Introduction to Brn 3 transcription factors
The family of Bm 3 transcription factors are all POU-proteins and were originally identified as being expressed in distinct regions of the brain, both during embryonic development and in mature neurones (He et al., 1989; Lillycrop et al.,
1992; Ninkina et al., 1993). The three Bm 3 proteins; Bm 3a, Bm 3b and Bm 3c are encoded by separate genes (Xia et al., 1993; Theil et al., 1994) and show homology within the POU-domain to another POU-protein, unc-86, which is expressed in