2356
The Company Size As A Moderating Variable For
The Effect Of Investment Opportunity Set, Debt
Policy, Profitability, Dividend Policy And
Ownership Structure On The Value Of
Construction Companies Listed On The
Indonesia Stock Exchange
Siswati Andaswari, Djoko Setyadi, Ardi Paminto, Felisitas DefungAbstract: This study aims to prove and analyze the effect of investment opportunity set, debt policy, profitability, devidend policy, and ownership structure, with company size as a moderating variable, on firm value in construction companies listed on the Indonesia Stock Exchange (IDX) from 2011 to 2017. The population is 30 construction companies listed on the IDX in 2017, while 14 companies meet the requirements to be used as research samples. This is an explanatory research, which explains the causal relationship between independent variables and dependent variable strengthened by moderating variables, through hypotheses testing. The data analysis technique used in this study is WarpPLS. The results of this study showed that investment opportunity set has a positive significant effect on firm value, while dividend policy and company size has a negative significant effect on firm value. Whereas debt policy, profitability, and ownership structure have no significant effect on firm value. The smaller the score value of the company size, the greater the firm value. The company size is an absolute moderating variable.
Keyword: Company Size, Debt Policy, Dividend Policy, Firm Value, Investment Opportunity Set, Ownership Structure, Profitability.
————————————————————
1.
INTRODUCTION
The growth of the property business in Indonesia has an effect on increasing the performance of the property stock index on the Indonesia Stock Exchange (IDX). In 2015, the increase in profit of companies in the property sector listed on the IDX reached 57.5 percent, higher than the chemical industry, trade, and other investments. This is due to an increase in property prices in Indonesia, which averaged 11.5% per year. In 2016, the shares in property sector became the driver of the growth of the Composite Stock Price Index. This sector index was able to grow up to 29.02% since the beginning of the year.
Several studies analyzed the influence between investment opportunity set, debt policy, profitability, dividend policy, and ownership structure on firm value, moderated by company size, but the results still showed inconsistencies. Handriani & Irianti [16], Giriati [13], Rosdini [27], Rizqia et al. [26] stated that the investment opportunity set has a positive and significant effect on firm value. This means that to achieve company goals by maximizing the value of the company, managers make investment decisions to produce a positive net present value. But Suartawan et al. [32], Lestari [20], and Nugraha et al. [23] stated that investment opportunity set has a negative effect on firm value.
Siboni and Mohammad [29] found that debt policy has a
positive effect on firm value. The use of debt will provide benefits to the company in the form of tax savings. On the other hand, the use of debt will increase cost for the company, namely the cost of bankruptcy, if the company is unable to pay off its debt. However, Lestari [20], Assagaf and Yunus [7] stated that debt policy has a negative effect on firm value.
Diani [11] found that profitability has a positive effect on firm value. Companies that produce high profits are generally considered to have good prospects so investors are interested in buying their shares, so that the value of the company will increase. This is in accordance with Prasetio and Bambang [25], Rizqia et al. [26], Martazela and Fenny [21], Utami [33]. But this is not in accordance with the results of the study of Yakub et al. [34], Sabrin et al. [28], and Yuanita et al. [36].
Chowdhury et al. [10] stated that firm size has a significant positive effect on firm value, but Arko et al. [6], Anandasayanan and Velnampy [4] stated otherwise.
2.
LITERATURE
REVIEW
2.1 Investment Opportunity Set
Investment Opportunity Set is the value of investment opportunities and options for making investments in the future (Gaver & Gaver [12]). This is related to the company's growth opportunities in the future. The company is a combination of real assets (assets in place) and investment options in the future. Investment options in the future are then known as IOS or investment opportunity sets (Myers [22]). IOS can be demonstrated by the ability of higher companies to take the opportunity to gain profits.
————————————————
Siswati Andaswari is doctoratal student in management in Mulawarman Univeristy, Indonesia.
The value of investment opportunity set depends on future expenditures determined by management (future discretionary expenditure) which are investment choices that are expected to generate returns greater than the cost of capital and it can generate profits (Kallapur [18]). Generally, the Investment Opportunity Set describes the extent of opportunities or investment opportunities for a company, but it is highly dependent on the company's expenditure choices for future interests (Baresa et al. [8]). The Investment Opportunity Set is non-observable so a proxy must be chosen that can be linked to other variables in profitability (Abor & Bokpin [1]). Kallapur [18] argued that industrial factors, such as barriers to entry and product life cycle, are parts of the determining factors of IOS. These allows companies to invest so that it can increase the barriers to entry, capital substitution as labor which is a result of economies of scale (Chen et al. [9]).
2.2 Debt Policy
Debt policy is a corporate funding policy that comes from external sources (Ang [5]). Debt policy is related to capital structure because debt is part of determining the optimal capital structure. Companies are considered risky if they have a large portion of debt in the capital structure. But on the contrary, if the company uses a small or no debt, then the company is considered unable to utilize additional external capital that can improve the company's operations.
Debt policy describes the decisions taken by management in determining funding sources from third parties to finance the company's operational activities (Rizqia et al. [26]). Creditors and shareholders are interested in the company's ability to pay interest at maturity and to repay the principal amount at maturity.
2.3 Profitability
Profitability is the relationship between revenues and cost generated by using the firm’s asset-both current and fixed-in productive activities” (Gitman [14]). Profitability of a company can be measured by connecting profits obtained from the company's main activities with assets owned (operating assets) to generate corporate profits (Anandasayanan & Velnampy [4]). Without profit, it will be very difficult for companies to attract capital from outside (Rizqia et al. [26]). Creditors, company owners, and company management will try to increase profits because it determines the continuity and future of the company.
The profitability of a company will influence investors' decision on investments made. The ability of companies to generate profits will be able to attract investors to invest their funds in order to expand their business. Conversely, a low level of profitability will cause investors to withdraw their funds.
2.4 Dividend Policy
Dividend policy is part of the company's funding decision. The dividend pay out ratio determines the amount of profit that can be retained as a source of funding. The allocation of profit determination as retained earnings and dividend payments is the main aspect in dividend policy (Keown [19]).
Dividend is one of the objectives of investors to invest in shares. If the amount of dividends is not as expected, investors will tend not to buy a stock or sell the shares if they already have them. Dividend payout ratio is often associated
with signaling theory (Hameed [15], Arko et al. [6]). Each dividend policy can be an assessment matter by investors (parties who do not have complete information about the company) about the company's performance (Alekneviciene et al. [3]). The reduced dividend payout ratio can reflect diminishing corporate profits. This condition causes investor preferences for a stock will tend to decrease because investors have a very strong preference for dividends (Yarram & Dollery [35], John et al. [17]). Therefore the company will always try to maintain dividend payout ratio even though there is a decrease in the amount of profit earned.
2.5 Ownership Structure
Ownership structure is the number or proportion of company stock ownership, both by managerial companies and parties outside the company. The shareholding structure consists of institutional ownership, managerial ownership, public ownership, and family ownership. Managerial ownership will encourage management to increase company value (Soliha & Taswan [31]). Managerial interests will align the interests of management and shareholders so that they will benefit directly from the decisions taken, and bear the costs of making wrong decisions. Whereas institutional ownership will increase the proportion of supervision and control by outsiders to the company so that managers run the company better.
2.6 Company Size
Company size can be seen from the total assets owned by a company. The large size of the company reflects that the company is experiencing good growth, increasing the value of the company. Increased company value can be characterized by the company's total assets that have increased and are greater than the amount of the company's debt.
Pramana & Mustanda [24], Adi [2] found that company size has a positive effect on firm value. But Arko et al. [6], Anandasayanan and Velnampy [4] stated that company size has a negative and not significant effect on firm value.
2.7 Firm Value
The main objective of the company according to the theory of the firm is to maximize the value of the firm (Salvatore [29]). Maximizing firm value is very important for a company, because maximizing firm value also means maximizing shareholder prosperity which is the company's main goal. Whereas according to Keown [19], firm value is the market value of outstanding debt and equity of the company .
3. RESEARCH
METHODS
3.1 Population and Sample
The population of this research is all construction companies listed on the IDX, which are 30 companies. The sample of this study is a construction company listed on the Indonesia Stock Exchange in the period of 2011 to 2017 totaling 14 companies. Samples were obtained by purposive sampling method. 3.2 Data Analysis
2358 3.3 Research Model
The path diagram of the research model is shown in Figure 1.
Figure 1. Full Path Diagram of Research Model
Remarks:
CEP/MVA: Capital Expenditure to Market Value of Assets CEP/BVA: Capital Expenditure to Book Value of Assets CAP/BVA: Capital Addition to Book Value of Assets CAP/MVA: Capital Addition to Market Value of Assets DER: Debt to Equity
TIE: Time Interest Earned OPM: Operating Profit Margin ROE: Return on Total Equity ROI: Return on Investment DPS: Dividend Per Share DPR: Dividen Payout Ratio FO: Family Ownership MO: Management Ownership GO: Goverment Ownership PER: Price Earning Ratio PBV: Price Book Value
The measurement equation (outer model) and structural equation (inner model) are as follows:
1) Outer Model
a. Investment opportunity set (X1)
X1 = λ1CEP/MVA + λ2CEP/BVA + λ3CAP/BVA +
λ4CAP/MVA + δ1
b. Debt Policy (X2)
X2 = λ5DER + λ6TIE + δ2
c. Profitability (X3)
X3 = λ7OPM + λ8ROE + λ9ROI +δ3
d. Dividend Policy (X4)
X4 = λ10DPS + λ11DPR + δ4
e. Ownership Structure (X5)
X5 = λ12FO + λ13MO + λ14GO +δ5
f. Company Size (X6)
X6 = λ15LN Total Aset + λ16Log of Net Sales + δ6
g. Firm Value (Y)
Y = λ17PER + λ18PBV +ε1
2) Inner Model:
Y = γ0 + γ1X1 + γ2X2 + γ3X3 + γ4X4 + γ5X5 + γ6X6 + γ7X1*X6
+ γ8X2*X6 + γ9X3*X6 + γ10X4*X6 + γ11X5*X6 + ζ1
Whereas:
λ = indicator weight
γ = coefficient of influence of exogenous variables on endogenous variables.
δ = measurement error on the manifest variable for exogenous latent variables
ε = measurement error on the manifest variable for endogenous latent variables
ζ = model error
4. RESEARCH
FINDINGS
4.1 Model Fit and Qualitiy Indices
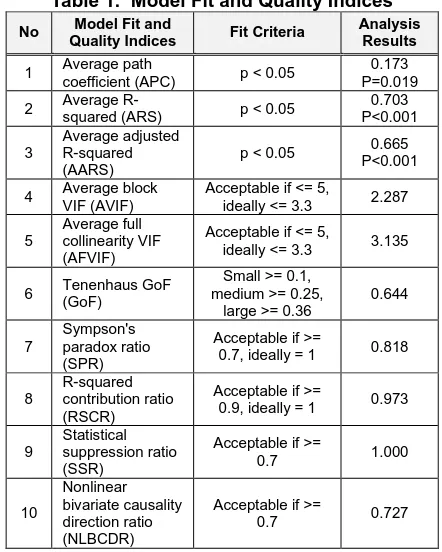
The feasibility of the model can be seen from the Model fit and quality indices of the WarpPLS model as shown in Table 1.
Table 1. Model Fit and Quality Indices
No Model Fit and
Quality Indices Fit Criteria
Analysis Results
1 Average path
coefficient (APC) p < 0.05
0.173 P=0.019
2 Average
R-squared (ARS) p < 0.05
0.703 P<0.001
3
Average adjusted R-squared (AARS)
p < 0.05 0.665 P<0.001
4 Average block VIF (AVIF)
Acceptable if <= 5,
ideally <= 3.3 2.287
5
Average full collinearity VIF (AFVIF)
Acceptable if <= 5,
ideally <= 3.3 3.135
6 Tenenhaus GoF (GoF)
Small >= 0.1, medium >= 0.25,
large >= 0.36
0.644
7
Sympson's paradox ratio (SPR)
Acceptable if >=
0.7, ideally = 1 0.818
8
R-squared contribution ratio (RSCR)
Acceptable if >=
0.9, ideally = 1 0.973
9
Statistical suppression ratio (SSR)
Acceptable if >=
0.7 1.000
10
Nonlinear bivariate causality direction ratio (NLBCDR)
Acceptable if >=
0.7 0.727
Table 1 shows that the model fulfills all models fit and quality indices, so that the structural model of the analysis results is feasible for further interpretation. The structural model with R2 = 0.703 shows that the model can explain the phenomenon under study by 70.3%, where the remaining 29.7% is explained by other variables that are not included in the model and errors.
4.2 Outer Model
1) Investment Opportunity Set (IOS) Variable
Table 2. Indicator Weights of Investment Opportunity Set No Indicator Weights p-value Remarks
1 CEP/MVA 0.437 <0.001 Significant
2 CEP/BVA 0.224 0.010 Significant
3 CAP/BVA 0.524 <0.001 Significant
4 CAP/MVA 0.415 <0.001 Significant
Source: processed research data, 2019
Table 2 shows that all indicators are significant as a measure of the Investment Opportunity Set (IOS) variable, with CAP/BVA as the most dominant indicator.
2) Debt Policy Variable
Indicator weights for each indicator of the debt policy variable can be seen in Table 3.
Table 3. Indicator Weights of Debt Policy No Indicator Weights p-value Remarks
1 DER 0.754 <0.001 Significant
2 TIE 0.754 <0.001 Significant
Source: processed research data, 2019
Based on Table 3, it can be seen that all indicators are significant as a measure of the debt policy variable.
3) Profitability Variable
Indicator weights for each indicator of the profitability variable can be seen in Table 4.
Table 4. Indicator Weights of Profitability No Indicator Weights p-value Remarks
1 OPM 0.157 0.050 Significant
2 ROE 0.488 <0.001 Significant
3 ROI 0.496 <0.001 Significant Source: processed research data, 2019
Table 4 shows that all indicators are significant as a measure of profitability variables, where the ROI indicator is the most powerful indicator.
4) Dividend Policy Variable
Indicator weights for each indicator of the dividend policy variable can be seen in Table 5.
Based on Table 5, all indicators are significant as a measure of dividend policy variable.
Table 5. Indicator Weights of Dividend Policy No Indicator Weights p-value Remarks
1 DPS 0.650 <0.001 Significant
2 DPR 0.650 <0.001 Significant
Source: processed research data, 2019
5) Ownership Structure Variable
Indicator weights for each indicator of the ownership structure variable can be seen in Table 6.
Table 6. Indicator Weights of Ownership Structure No Indicator Weights p-value Remarks
1 FO 0.171 0.039 Significant
2 MO 0.473 <0.001 Significant
3 GO -0.480 <0.001 Significant Source: processed research data, 2019
Table 6 shows that all indicators are significant as a measure of ownership structure variable, where GO is the most powerful indicator. The negative sign indicates that the ownership structure will be less good if the ownership portion of GO is getting bigger.
6) Company Size Variable
Indicator weights for each indicator of the company size variable can be seen in Table 4.
Table 7. Indicator Weights of Company Size No Indicator Weights p-value Remarks
1 Ln Total Assets 0.509 <0.001 Significant
2 Log of Net Sales 0.509 <0.001 Significant
Source: processed research data, 2019
Based on Table 7, all indicators are significant as a measure of company size variable.
7) Firm Value Variable
Indicator weights for each indicator of the firm value variable can be seen in Table 8.
Table 8. Indicator Weights of Firm Value No Indicator Weights p-value Remarks
1 PER 0.608 <0.001 Significant
2 PBV 0.608 <0.001 Significant
Source: processed research data, 2019
Table 8 shows that all indicators are significant as a measure of firm value variable.
4.3 Inner Model
The structural model presents relationships between research variables and path coefficients. Larger path coefficient indicates that the degree of influence is stronger than other variables. The results of the SEM analysis with the WarPLS approach are presented in Table 9 and Table 10.
Table 9: Analysis Results of Direct Effect
No Relationship Coefficient
P-value Remarks
1
Investment
opportunity set (X1)
Firm Value (Y)
0.254 0,004 Significant
2 Debt Policy (X2)
Firm Value (Y) 0.023 0,409
Not significant
3 Profitability (X3)
Firm Value (Y) 0.101 0,153
Not significant
4 Dividend Policy (X4)
Firm Value (Y) -0.189 0,026 Significant
5 Ownership Structure (X5) Firm Value (Y)
2360 No Relationship Coefficient
P-value Remarks
6 Company Size (X6)
Firm Value (Y) -0.232 0,008 Significant
Source: processed research data, 2019
Table 10. Testing for Moderating Variables
No Relationship Coeff P-value Remarks Modera-tion
1
Investment opportunity set (X1)
x Company Size (X6) Firm Value
(Y)
-0,358 <0,001 Significant Quasi Moderator
2
Debt Policy (X2) x
Firm Size (X6)
Firm Value (Y)
0,063 0,265 Not Significant
Not a moderator
3
Profitability (X3) x
Company Size (X6) Firm Value (Y)
-0,210 0,015 Significant Quasi Moderator
4
Dividend Policy (X4) x Company
Size (X6) Firm
Value (Y)
0,270 0,002 Significant Quasi Moderator
5
Ownership Structure (X5) x
Company Size (X6) Firm Value (Y)
-0.146 0.068 Significant Quasi Moderator
Source: processed research data, 2019
The results of the analysis are also outlined in the form of a chart as shown in Figure 2.
Figure 2. Structural Model of Analysis Results
5. DISCUSSION
Based on the results of the analysis, the results of hypotheses testing are obtained as follows:
1) Investment opportunity set (X1) has a significant influence
on firm value (Y). The test result shows the path coefficient = 0.254 and p-value = 0.004. The higher the investment opportunity set, the higher the value of the company. 2) Debt policy (X2) does not have a significant effect on firm
value (Y). The test result shows a path coefficient = 0.023 and p-value = 0.409.
3) Profitability (X3) does not have a significant effect on firm
value (Y). The test result shows the path coefficient = 0.101 and p-value = 0.153.
4) Dividend policy (X4) has a significant negative effect on firm
value (Y). From the test result, the path coefficient is -0.189 and p-value = 0.026. The higher the score of dividend policy will lower the firm value.
5) Ownership structure (X5) does not have a significant effect
on firm value (Y). From the test result, the path coefficient is 0.058 and p-value = 0.281.
6) Company size (X6) has a significant negative effect on firm
value (Y). From the test result, the path coefficient is -0.232 and p-value = 0.008. The smaller the score value of the company size, the greater the firm value.
7) Company size is a moderating variable that weakens the influence of the Investment Opportunity Set on firm value. The analysis result shows path coefficients = -0.358 and p-value <0.001. The path coefficient of the influence of company size (X6) on firm value (Y) is -0.232 and p-value =
0.008, then company size is a quasi moderation variable. The larger size of the company can reduce the positive influence of the Investment Opportunity Set on firm value. 8) Company size is not a moderating variable for the influence
of debt policy on firm value. The analysis results show path coefficient 0.063 and p-value = 0.265.
9) Company size is a moderating variable for the influence of profitability on firm value. The results of the analysis show path coefficients = -0.210 and p-value = 0.015. The path coefficient of the influence of profitability (X3) on Firm Value
(Y) is 0.101 and p-value = 0.153, then company size is an absolute moderating variable. The greater the size of the company, the effect of profitability on the firm value will be weakened.
10)Company size is a moderating variable that weakens the influence of dividend policy on firm value. The analysis result shows path coefficient = 0.270 and p-value = 0.002. The path coefficient of the influence of company size (X6)
on firm value (Y) is -0.232 and p-value = 0.008, then the company size is a quasi moderation variable. The larger size of the company can reduce the negative influence of dividend policy on the firm value.
11)Company size is a moderating variable of the influence of ownership structure on firm value. The analysis result shows path coefficient = -0.146 and p-value = 0.064. The path coefficient of the influence of ownership structure (X5)
on firm value (Y) is 0.058 and p-value = 0.281, then company size is an absolute moderating variable. The larger the size of the company, the influence of the ownership structure on the value of the company is getting weaker.
7 CONSLUSION
AND
RECOMMENDATION
R
EFERENCES[1] Abor, Joshua and Godfred A. Bokpin, “Investment Opportunities, Corporate Finance, and Dividend Payout Policy”, Studies in Economics and Finance, Vol. 27, No. 3. 2012.
[2] Adi, Putra, I Gede. “ The Effect of Internal and External Factors on the Value of a Firm through its Investment Opportunities on the Stock Exchange of the South East Asian Countries”, International Business Management, Vol. 10, No. 4. 2016.
[3] Alekneviciene, Vilija, Povilas Domeika, and Dalia Jatkunaite. “The Development of Company Dividend Policy in Respect of Profit Distribution Priorities”, Economics of Engineering Decisions, Vol. 1, No. 5. 2016. [4] Anandasayanan S. and Velnampy T., ”Dividend Policy
and Corporate Profitability Econometric Analysis of Listed Manufacturing Firms in Sri Lanka”, International Journal of Commerce and Management Research, Vol. 2, No. 1. 2016.
[5] Ang, Robert,. The Intelligent Guide to Indonesian Capital Market, Edisi Pertama. Jakarta: Mediasoft Indonesia. 2007.
[6] Arko, Anastacia C., Joshua Abor, Charles K. D., Adjasi, and Mohammed Amidu, “What Influence Dividend Decisions of Firms in Sub-Saharan African?”, Journal of Accounting in Emerging Economies, Vol. 4, No. 1. 2014. [7] Assagaf, Aminullah and Eddy Yunus, “Effect of
Investment Opportunity Set (IOS), Level of Leverage and Return to Return Stock Market Company in Indonesia Stock Exchange”, IJABER, Vol. 14, No. 3. 2016.
[8] Baresa, Suzana, Sinisa Bogdan, and Zoran Ivanovic, “Capital Investments and Financial Profitability”, UTMS Journal of Economics, Vol. 7, No. 1. 2015.
[9] Chen, Sheng-Syan, Chung Tsai-Yen and Ly-Inn Chung, “Investment Opportunities, Free Cash Flow and Stock Valuation Effects of Corporate Investment: The Case of Taiwanese Investments in China”, Review of Quantitative Finance and Accounting, Vol. 16, No. 4. 2013.
[10]Chowdhury, Tanbir Ahmed, and Jannatunnesa, “Stock Market Investors’ Guide to Corporate Dividend Policy: Evidence from Pharmaceuticals and Chemicals Industries in Bangladesh”, Asian Journal of Finance & Accounting, Vol. 9, No. 1. 2017.
[11]Diani, Amelia Fitri, “Pengaruh Kebijakan Dividen, Kebijakan Hutang dan Profitabilitas terhadap Nilai Perusahaan (Studi Kasus pada Perusahaan Consumer Goods yang Terdaftar di Bursa Efek Indonesia Periode Tahun 2012-2015)”, Jurnal Ekonomi, Vol. 1, No. 1. 2016. [12]Gaver, JJ. and Keneth M Gaver, “Additional Evidence on
The Association between The Investment Opportunity Set and Corporate Financing, Dividend and Compensation Policies”, Journal of Accounting and Economics, Vol. 1, No. 1. 2013.
[13]Giriati. “Free Cash Flow, Dividend Policy, Investment Opportunity Set, Opportunitic Behavior and Firm’s Value”, Procedia-Social and Behavioral Sciences, Vol. 219. 2016 [14]Gitman, Lawrence J. “Principles of Managerial Finance
(Twelfth Edition)”, Pearson International Edition-Addison Wesley. 2013.
[15]Hameed, Abdul. “A Financial and Quantitative Relationship of Debt, Dividend and Insider Ownership”. Journal of Business Strategies, Vol. 7, No. 1. 2013.
[16]Handriani, Eka and Tjiptowati Endang Irianti, “Investment Opportunity Set (IOS) Berbasis Pertumbuhan Perusahaan dan Kaitannya dengan Upaya Peningkatan Nilai Perusahaan”, Jurnal Ekonomi dan Bisnis, Vol. XVIII, No. 1. 2015
[17]John, Baruet Kimitei, Caroline Ayuma Okelo, David Chesang, “An Evaluation on the Role of Signalling Effect to Dividends on Future Profits of Companies Listed at the Nairobi Securities Exchange, Kenya”, International Journal of Innovative Research & Development, Vol. 6, Issue 3. 2017.
[18]Kallapur, Sanjay. “The Investment Opportunity Set: Determinants, Consequences and Measurement”, Managerial Finance, Vol. 27, No. 3. 2013.
[19]Keown, Arthur J. Martin, “Financial Management, Principles and Applications. Tenth Edition, New Jersey: Pearson Education. 2014.
[20]Lestari, Hafifah Puji. “Pengaruh Investment Opportunity Set (IOS), Leverage, dan Dividend Yield terhadap Nilai Perusahaan (Pada Perusahaan Sektor Industri Makanan dan Minuman yang listed di BursaEfek Indonesia)”, Jurnal Ekonomi dan Keuangan, Vol. 2, No. 2. 2014.
[21]Martazela, Ayu and Fenny Marietza, “Effect of Profitability and Investment Opportunity Set of Cash Dividend Policy with the Liquidity and Leverage (Studies in Non Financial Companies that Listed on Indonesia Stock Exchange Periode 2005-2009)”, Research Journal of Finance and Accounting, Vol. 13, No. 3. 2013.
[22]Myers, S., “Determinants of Corporate Borrowing”, Journal Financial Economics, Vol. 5, No. 1. 2014.
[23]Nugraha, Jaka, Suhadak, Kusdi Rahardjo and Rern-Jay Hung. “The Influence of Investment Opportunity Set and Dividend Policy on Corporate Value: Evidence from Indonesia Stock Exchange”, Research Journal of Finance and Accounting, Vol. 3, No. 2. 2012.
[24]Pramana, I. dan I. K. Mustanda. “Pengaruh Profitabilitas dan Size terhadap Nilai Perusahaan dengan CSR sebagai Variabel Pemoderasi”, E-Jurnal Manajemen Universitas Udayana, Vol. 5, No. 1. 2016.
[25]Prasetio, Djoko Adi and Bambang Suryono, “Pengaruh Profitabilitas, Free Cash Flow, Investment Opportunity Set terhadap Dividend Payout Ratio”, Jurnal Ilmu dan Riset Akuntansi, Vol. 5, No. 1. 2016.
[26]Rizqia, Dwita Ayu, Siti Aisjah and Sumiati. “Effect of Managerial Ownership, Financial Leverage, Profitability, Firm Size, and Investment Opportunity on Dividend Policy and Firm Value”, Research Journalof Finance and Accounting, Vol. 4, No. 11. 2013.
[27]Rosdini, Dini. “The Influence of Investment Opportunity Set and Corporate Governance to Earnings Quality and Firm Value”, Journal of Economic, Vol.2, No.2. 2013. [28]Sabrin, Buyung Sarita, Dedy Takdir S., and Sujono, “The
Effect of Profitability on Firm Value in Manufacturing
Company at Indonesia Stock Exchange”, The
International Journal of Engineering and Science (IJES), Vol. 5, Issue 10. 2016.
[29]Salvatore, Dominic. Managerial Economic, Fifth Edition. Singapore: Thomson Learning. 2015.
2362 [31]Soliha, Euis and Taswan, ”Pengaruh Kebijakan Hutang
terhadap Nilai Perusahaan serta Beberapa Faktor yang Mempengaruhinya”, Jurnal Bisnis dan Ekonomi, Vol. 9. 2013.
[32]Suartawan, Putu Adi, dan Gerianta Wirawan Yasa. “Pengaruh Investment Opportunity Set dan Free Cash Flow pada Kebijakan Dividen dan Nilai Perusahaan”, Jurnal Ilmiah Akuntansi dan Bisnis, Vol. 11, No. 2. 2016. [33]Utami, Wikan Budi, “The Effectness Of Investment
Opportunity, Financing Company, Profitability, Cash, and Market to Book Value to Dividend Payment Policy”, International Journal Of Scientific Research and Education, Vol. 3, No. 5. 2015.
[34]Yakub, Suardi, Suharsil, and Jufri Halim, “Pengaruh Profitabilitas dan Invesment Opportunity Set terhadap Deviden Tunai Perusahaan Go Publik Sektor Perbankan Bursa Efek Indonesia”, Jurnal Saintikom, Vol. 13, No. 1. 2014.
[35]Yarram, Subba Reddy and Dollery, Brian. “Corporate Governance and Financial Policies Influence of Board Characteristics on the Dividend Policy of Australian Firms”, Managerial Finance, Vol. 41, No.3. 2014.