Blackboard And VMI:
Where We Are Now
H. Francis Bush, Virginia Military Institute
ABSTRACT
Classroom management systems, such as Blackboard, provide both students and faculty software to enhance the education experiences, but at the same time require the faculty to learn the new procedures and to transfer all digital class material to the new platform. Surveys assessed the experiences and preferences of both faculty members and students concerning the use of a classroom management system, Blackboard®. The findings indicate the existence of differences based on discipline and the exercising of authority.
INTRODUCTION
urrently, Blackboard is the class management system at the Virginia Military Institute (VMI). Along with faculty members’ web pages and dedicated server, the T: drive, Blackboard provides resources for digital teaching aids. In the spring semester of 2006, the Undergraduate Advisory Committee (UAC) for the Department of Economics and Business requested that faculty increase their use of Blackboard during the spring semester of 2006. Further, faculty members express an interest in the Blackboard’s ability to mange their courses. In response to the UAC request, the Economics and Business Department agreed that all members would utilize Blackboard. However, before that agreement was reached, lively discussion revealed several concerns from the faculty. The purpose of this research is to explore these concerns.
The Economics and Business Department discussed the UAC request at a departmental meeting. Various concerns were expressed. (1) Significant amount of time had been devoted previously to developing web pages for each course. Further, the web page was part of the VMI faculty expectations. (2) No student had expressed individually to an adviser or instructor the student’s preference for having access to course material on Blackboard. (3) The grade book was inefficient; excel was more manageable. The Department, however, felt that a positive response to the first UAC request would be appropriate. Consequently, the department agreed to use Blackboard at a minimum to post basic course material such as syllabi and course guides as well as a link to the individual faculty web page or course page when deemed appropriate.
This paper analyzes the data in terms of student and faculty attitudes and needs. Further, a comparison will be made between the attitudes represented by majors from the Economics and Business department and other students.
METHODOLOGY
Data on the use of Blackboard were gathered from four different constituents: (1) Faculty, (2) Graduating Seniors, (3) Summer School students, and (4) Summer Transition Program (STP) students. STP students are entering students who attend summer school before matriculating at VMI. Survey instruments were designed and distributed to each group. The specifics of the survey obtained data on the following themes. Faculty members were surveyed based on their use of Blackboard and their preferences for features based on their use. Graduating seniors and summer school students were surveyed on their use of Blackboard, their preferences and concerns. STP students were surveyed on their experience with Blackboard at VMI and elsewhere. The instruments are available in the appendix.
RESULTS
As often is the case with survey data, not all surveys were completed or included inappropriate responses. Consequently, inappropriate responses were classified as other and omitted portions were not included in calculating percentages. When measuring experience, subjects were allowed to select an unlimited number of features. Percentages were calculated by dividing the total number reporting using an individual feature by the total number of respondents who completed the section. When measuring preference, subjects were asked to rank up to three features. Similarly, percentages were calculated by dividing the total number reporting using a feature at any of the three levels of preference by the total number of respondents who reported at least one preference. Hence, the percentages relating to experience and preferences will sum to amounts greater than 100 percent.
Faculty
The faculty survey, with a cover letter, was distributed to each faculty participant’s individual campus mail box. In addition, an e-mail provided an opportunity for faculty who were away from campus to participate. A total of 61 (32 percent) surveys were returned. Faculty members were identified by division and experience. VMI has four divisions: Liberal Arts (history, English/fine arts, economics/business, and international studies), Engineering (civil/environmental engineering, mechanical engineering, and electrical/computer engineering), Science (biology, chemistry, mathematics/computer science, and physics), and Leadership (psychology, ROTC, and physical education). A summary of the distribution is presented in Table 1. The distribution of the number of surveys that were returned indicates that more Liberal Arts faculty returned the survey, which is consistent with the distribution of faculty within VMI. However, the distribution of percentages also reveals a substantially stronger experience with Blackboard among the faculty members of the Liberal Arts division. Faculty members who left their division blank or marked engineering appear to be split, while faculty members marking Leadership or Science tended not to use Blackboard.
Table 1
Faculty Affiliation and Experience Percentages (The number of responses are in parenthesis.)
Regularly Rarely Other
Blank 5% (3) 5% (3) 7% (4)
Engineering 3% (2) 3% (2) 0% (0)
Liberal Arts 25% (15) 11% (7) 5% (3)
Leadership 3% (2) 10% (6) 3% (3)
Science 3% (2) 10% (6) 7% (4)
Regularly Use Blackboard
Faculty members were asked to rank the frequency of their use of Blackboard as “regular,” “rarely and “unfamiliar or other.” For those who identified their use as “regular,” the survey measured experience by asking faculty members to report which features they use. (For specific features, see the appendix.) Respondents could select as many or as few (including none) features as they liked. Respondents reported their preferences by ranking up to their top three. Preferences were counted equally when computing the percentages.
Table 2
Experience and Preference Percentages of Faculty “Regularly” using Blackboard
Feature Experience Preference
Grades 92% (22) 71% (17)
Documents 92% (22) 79% (19)
Announcements 83% (20) 4% (1)
E-mail 79% (19) 50% (12)
Links 63% (15) 13% (3)
Drop-ox 38% (9) 13% (3)
Tasks 38% (9) 17% (4)
Discussion Board 25% (6) 13% (3)
Other 29% (7)
Finally, the survey asked faculty to respond to possible institutional policies concerning Blackboard. The survey was based on the experience of the Economics and Business Department. Only ten of the 24 faculty members who use Blackboard regularly agreed that “it is better for students to have all Internet materials available through Blackboard.” Further, only eight of the 24 agreed that it is sufficient to have all Internet materials linked through Blackboard. This lack of support for an institutional policy reflects both academic freedom and collegial respect for one another’s teaching preference.
Rarely Use Blackboard
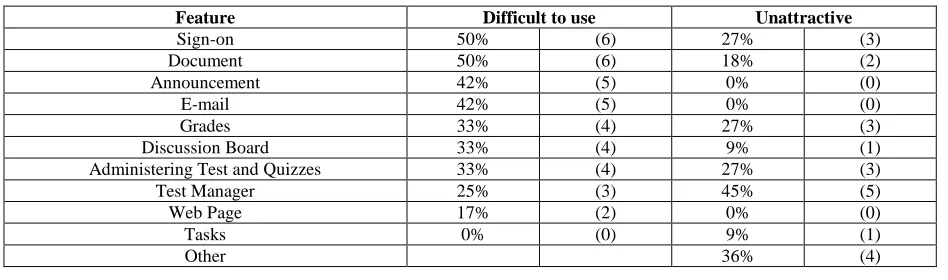
The survey for those faculty members who reported using Blackboard “rarely” was structured to measure concerns of these faculty members. Consequently, after identifying themselves as infrequent or reluctant users of Blackboard, they responded to questions about the “user-unfriendliness” or “less attractive” nature of the features. Responses in this category reported experience as features which were difficult to use and preferences indicated which features were least attractive. The percentages were measured in a similar manner are presented in Table 3. The results, first and foremost, suggest that splitting the “Test Manager” feature from administering tests and quizzes might have been interpreted differently by this group. Combined, these features dominate the concerns about using Blackboard. Between the concept of using on-line testing and the mechanics of Blackboard, testing is a strongly negative aspect of Blackboard. The second concern is the separate sign-on procedure. Finally, there appears to be some annoyance with posting documents and announcements, and sending e-mails. I would suggest that this occurs from duplication of using web pages, the T: drive, a local server dedicated to teaching materials, and personal distribution lists on Outlook.
In response to possible institutional policies concerning Blackboard, only six of the 24 faculty members who rarely used Blackboard agreed that “it is better for students to have all Internet materials available through Blackboard.” Further, only three of the 24 agreed that it is sufficient to have all Internet materials linked through Blackboard. This group expressed even less support for institutional policy.
Table 3
Difficulty to use and Unattractive Percentages of Faculty “Rarely” using Blackboard
Feature Difficult to use Unattractive
Sign-on 50% (6) 27% (3)
Document 50% (6) 18% (2)
Announcement 42% (5) 0% (0)
E-mail 42% (5) 0% (0)
Grades 33% (4) 27% (3)
Discussion Board 33% (4) 9% (1) Administering Test and Quizzes 33% (4) 27% (3)
Test Manager 25% (3) 45% (5)
Web Page 17% (2) 0% (0)
Tasks 0% (0) 9% (1)
Unfamiliar or Other
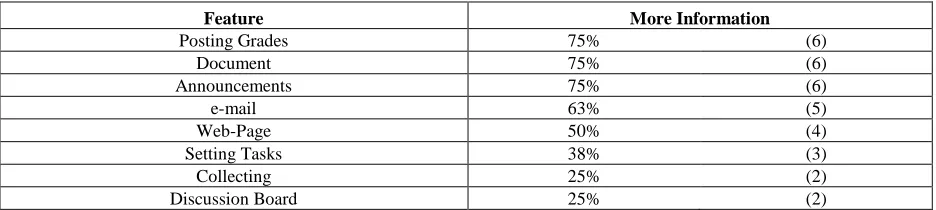
The last option for a faculty member was “unfamiliar with Blackboard” or “other” for those not covered above. Only 13 of the 61 members selected this option. Similar to those who used Blackboard “regularly,” faculty participants were asked to express which features would be useful and which were their preference. The results are presented in Table 4. This group of faculty gave preference to sending group e-mails and posting documents and announcements. Setting tasks and using the discussion board or the digital drop received the least support. This group was also asked to report on the desire for information or training on features. The metric was similar to the experience metric used above. Eight of the subjects indicated at least one feature. The percentage was calculated based on the total times a features was selected divided by eight. The results are presented in Table 5.
Table 4
Perceived Usefulness and Preference Percentages of Faculty “Unfamiliar” with Blackboard or other
Table 5
Features Desiring More Information Percentages of Faculty Members “Unfamiliar” with Blackboard or other
Feature More Information
Posting Grades 75% (6)
Document 75% (6)
Announcements 75% (6)
e-mail 63% (5)
Web-Page 50% (4)
Setting Tasks 38% (3)
Collecting 25% (2)
Discussion Board 25% (2)
Not surprisingly, only one member completed the survey with regards to possible institutional policies concerning Blackboard. The response indicated that it would suffice to have links to web pages on Blackboard. Having separated the faculty by experience and preference for Blackboard, the surveys were adjusted to reflect each subject’s situation. However, a comparison of the different results indicates that posting grades and documents is a concern of those who rarely use Blackboard and a key feature of those who regularly use Blackboard. Further, those who rarely use Blackboard are annoyed by the separate sign-on procedure and on-line testing.
Students
To assess the students’ attitudes concerning Blackboard, the survey was distributed at two points in time. VMI’s unique co-curricular program provides variations on surveying students. All students live in a single building, Barracks. Further, students have set formations were attendance is mandatory. Finally, students, however, generally anticipate rewards for participation. This environment supported the survey process with the exception of graduating seniors.
Feature Perceived Usefulness Preference
E-mail 83% (10) 56% (5)
Document 83% (10) 78% (7)
Announcement 75% (9) 67% (6)
Links 50% (6) 33% (3)
Grades 42% (5) 11% (1)
Tasks 25% (3) 0% (0)
Discussion Board 25% (3) 11% (1)
To include graduating seniors at the end of the year, the students were first asked to participate by the class president. The author then distributed the surveys personally to each room on the day that seniors returned for graduation practice. Second, surveys were distributed to students during the summer session. This distribution process consisted primarily of my approaching students during the lunch period on a single day. Also, students received surveys in class from some instructors and electronically via e-mail. A total of 196 students completed a survey (approximately 15 percent of the student body). A distribution of the students by major and graduating year is presented in Table 6. With the exception of seniors and juniors, there does not appear to be any disproportionate response from economics/business majors. The number of responses is also proportionate to class size.
Similar to the faculty assessment, the students’ experiences with Blackboard were measured. On average, students reported taking 2.3 courses in the past year in which the instructor used Blackboard. Using similar metrics to those applied to the faulty members’ responses, students’ experience and preferences for the various features were measured. One hundred fifty-three students list at least one feature and 149 students listed at least one preference. The results are reported in Table 7. Similar to the responses of faculty who “regularly” use Blackboard, posting documents and grades are the most highly valued features of Blackboard, which is in conflict with faculty who “rarely” use Blackboard.
Table 6
Distribution of Student Subjects based on Major and Graduating Year
Graduating Class
Major
2007
(and before) 2008 2009 2010 No Year Total
Biology 4 5 2 5 16
Civil Engineering 5 5 6 5 0 21
Chemistry 0 1 3 2 0 6
Economics and Business 10 16 8 7 2 43 Electrical Engineering 0 0 0 3 0 3
English 2 0 2 2 0 6
History 6 10 5 4 1 26
International Studies 4 4 6 8 0 22
Mathematics 0 1 0 0 0 1
Modern Languages and Cultures 1 0 0 0 0 1 Mechanical Engineering 2 1 13 9 1 26
Psychology 2 3 0 7 1 13
Physics 2 0 0 2 4
No Major 2 5 1 8
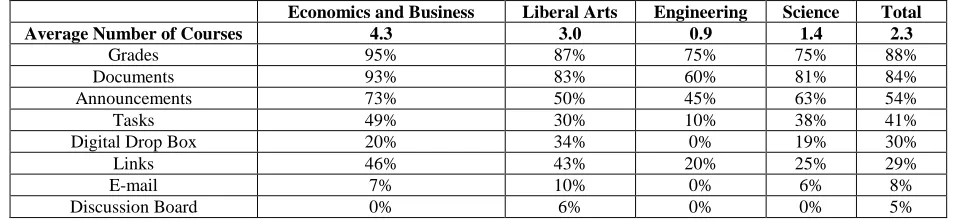
Further analysis examined the difference between disciplines. Responses were separated by academic divisions with psychology being included with the liberal arts majors because several majors are small and highly affected by a single member’s responses. Economics and business majors were included with liberal arts and also segregated because of the department’s new policy this past year. The results are presented in Table 8.
Table 7
Perceived Usefulness and Preference Percentages of Students
Feature Useful Preference
Grades 88% (134) 82% (122)
Documents 84% (129) 77% (115)
Announcements 54% (83) 41% (61)
Tasks 41% (63) 26% (38)
Digital Drop Box 30% (46) 11% (16)
Links 29% (45) 12% (18)
E-mail 8% (12) 3% (4)
Discussion Board 5% (7) 9% (14)
Other 13% (20)
Table 8
Perceived Usefulness Percentages of Students by division and economics and business
Economics and Business Liberal Arts Engineering Science Total
Average Number of Courses 4.3 3.0 0.9 1.4 2.3
Grades 95% 87% 75% 75% 88%
Documents 93% 83% 60% 81% 84%
Announcements 73% 50% 45% 63% 54%
Tasks 49% 30% 10% 38% 41%
Digital Drop Box 20% 34% 0% 19% 30%
Links 46% 43% 20% 25% 29%
E-mail 7% 10% 0% 6% 8%
Discussion Board 0% 6% 0% 0% 5%
This is the only area where visible differences were reported. Clearly, economics and business majors have noticed the change in the impact of the change in the department’s policy. Not a single student indicated a decline in the use. On the other hand, 26 percent of the engineering majors indicated a decline as did seven percent of the science majors. At first glance, there appears to be a conflict between students’ perception and faculty perception in engineering and science. Although engineering faculty self reported an even split between using Blackboard regularly and rarely, the students experienced fewer courses on Blackboard. This could be possibly be explained by the number of courses outside of engineering that are in the science division. Further, the science students might experience more courses on Blackboard because they take more courses outside of their division from the liberal arts division.
Table 9
Perceived Usefulness Percentages of Students by division and economics and business
Economics and Business Liberal Arts Engineering Science
Increase 75% 35% 7% 28%
Remain the Same 25% 57% 67% 72%
Decrease 0% 7% 26% 0%
STP Students
students completed the survey. Students were advised of the survey by e-mail the day before. Twenty-three students reported having used Blackboard this past summer and 163 had not. Prior to coming to VMI, 55 students reported being exposed to Blackboard at a previous institution while 108 reported that they had not been exposed.
STP students were broken into two groups, those who had been exposed to Blackboard either at VMI or prior to coming to VMI and those who had not been exposed. A comparison of the experience of those who had exposure to Blackboard to the perceived usefulness of Blackboard features of those who had not been exposed is reported in Table 10. Although the relative rankings appear to be similar, the enthusiasm is noticeably higher for STP students than for students who had attended VMI prior to summer 2007.
Table 10
Experienced versus Perceived Usefulness Percentages of STP Students
Feature Experience Desired
Grades 84% (57) 97% (105)
Announcements 72% (49) 88% (95)
Documents 74% (50) 81% (87)
Tasks 54% (37) 58% (63)
Links 44% (30) 64% (69)
E-mail 43% (29) 56% (61)
Drop Box 49% (33) 46% (50)
D-Board 37% (25) 49% (53)
CONCLUSIONS
This study reveals four key points and asks one question. First, the dominant features that appeal to faculty members, students and STP students are the ability to access grades and to post information pertaining to the course. Second, features related to communication tend to be seen as less valuable. Third, trends relating to using Blackboard vary by division. Specifically, faculty members from the Liberal Arts division were more likely to use Blackboard. Fourth, the Department of Economics and Business’ policy has clearly made a difference in students’ experience.
APPENDIX SURVEY INSTRUMENTS
B
LACKBOARDU
SES
URVEYDivision (circle one):
Engineering (Civil and Environmental Engineering, Electrical and Computer Engineering, Mechanical Engineering)
Leadership (Air Force ROTC, Army ROTC, Navy ROTC, Physical Education)
Liberal Arts (Economics and Business, English and Fine Arts, History, International Studies, Modern Language and Cultures, Psychology and Philosophy)
Science (Biology, Chemistry, Mathematics and Computer Science, Physics and Astronomy)
Describe your experience with Blackboard (circle one):
Use Blackboard regularly Complete section one only (this page). Rarely or never use Blackboard Complete section two only (page 2). Unfamiliar with Blackboard Complete section three only (page 3).
Other Complete section three only (page 3).
Section One (Use Blackboard regularly) Which features of Blackboard do you find useful? Please check all that apply.
Posting grades on assignments _____ Sending group e-Mails _____ Collecting assignments through the (Posting) Course Documents _____
Digital Drop Box _____ (Posting) Announcements _____
Setting Tasks _____ (Providing) links to web pages _____
Using Discussion Board _____
Which of the features are the most important three features for you? (1 – most important) Please include features that are not listed above if appropriate.
1. _____________________________ 2. _____________________________ 3. _____________________________
Blackboard Policies (circle one):
I believe it is better for students to have all Internet materials available through Blackboard. Agree Disagree Undecided or Unsure
I believe it is better for students to have all internet materials available through individual instructor’s web-pages. Agree Disagree Undecided or Unsure
I believe it is sufficient to have linked to Blackboard.
Agree Disagree Undecided or Unsure
Section Two
(Rarely or never use Blackboard)
Which features of Blackboard do you find to be “user-unfriendly?” Please check all that apply.
Independent sign-on procedures _____ Sending group e-Mails _____
Grade Book _____ Using Discussion Board _____
(Posting) Course Documents _____ Setting Tasks _____
(Posting) Announcements _____ (Providing) links to web pages _____ (Using) Test Manager _____ (Administering) tests and quizzes _____
Which of the features are the least attractive for you? (1 – least attractive) Please include features that are not listed above if appropriate.
1. _____________________________
2. _____________________________
3. _____________________________
Blackboard Policies (circle one):
I believe it is better for students to have all Internet materials available through Blackboard. Agree Disagree Undecided or Unsure
I believe it is better for students to have all internet materials available through individual instructor’s web-pages. Agree Disagree Undecided or Unsure
I believe it is sufficient to have linked to Blackboard.
Agree Disagree Undecided or Unsure
Please add any other comment relating to using Blackboard that you would like us to know.
Section Three
(Unfamiliar with Blackboard or Other)
Which features of Blackboard do you believe would be useful for your students? Please check all that apply. Posting grades on assignments _____ Sending group e-Mails _____ Collecting assignments through the (Posting) Course Documents _____
Digital Drop Box _____ (Posting) Announcements _____
Setting Tasks _____ (Providing) links to web pages _____
Using Discussion Board _____
Which of the features are the most important three features for you? (1 – most important) Please include features that are not listed above if appropriate.
1. _____________________________
2. _____________________________
3. _____________________________
For which features of Blackboard would you like more information or training? Please check all that apply. Posting grades on assignments _____ Sending group e-Mails _____ Collecting assignments through the (Posting) Course Documents _____
Digital Drop Box _____ (Posting) Announcements _____
Setting Tasks _____ (Providing) links to web pages _____
Using Discussion Board _____ Other ______________________________ Blackboard Policies (circle one):
I believe it is better for students to have all Internet materials available through Blackboard. Agree Disagree Undecided or Unsure
I believe it is better for students to have all internet materials available through individual instructor’s web-pages. Agree Disagree Undecided or Unsure
I believe it is sufficient to have linked to Blackboard.
Agree Disagree Undecided or Unsure
B
LACKBOARDU
SES
URVEYBackground:
GC Class (circle one) 2007 or earlier 2008 2009 2010
Major (circle one) BI CH CE CS EC EE EN HI IS MA ME MC PY PS
Experience:
During the past year (2006-2007), approximately how many courses in which you were enrolled used Blackboard? _____
Which features of Blackboard do you find useful? Please check all that apply.
View Grades _____ Send e-Mail _____
Digital Drop Box _____ (To obtain) Course Documents _____
Tasks _____ (To read) Announcements _____
Discussion Board _____ Links to web pages _____
Which of the features are the most important three features for you? (1 – most important) 4. _____________________________
5. _____________________________
6. _____________________________
Your use of Blackboard has (circle one) increased, decreased or remained the same during your studentship.
Were you exposed to Blackboard or a similar for class management prior to coming to VMI? Yes or No (circle one)
Blackboard Policies:
(If you are graduating this semester, please consider what you would have liked to have been established as policies.) 1. Would you prefer to have all of your courses on Blackboard or on individual instructors’ web pages? 2. Is it sufficient to have individual instructors web-pages linked to Blackboard?
B
LACKBOARDU
SES
URVEYBackground:
(Circle one) Use Blackboard during STP Did not use Blackboard during STP
Were you exposed to Blackboard or WEB-CT prior to coming to VMI? (circle one) Yes or No
IF YOU USED Blackboard during STP:
Which features of Blackboard do you find useful? Please check all that apply.
View Grades _____
Send e-Mail _____
Digital Drop Box _____
(To obtain) Course Documents _____
Tasks _____
(To read) Announcements _____
Discussion Board _____
Links to web pages _____
Which of the features are the most important three features for you? (1 – most important)
7. _____________________________ 8. _____________________________ 9. _____________________________
Please add any other comment relating to using Blackboard that you would like us to know.
IF YOU DID NOT USED Blackboard:
Which features of Blackboard do you find useful? Please check all that apply.
View Grades _____
Send e-Mail _____
Digital Drop Box _____
(To obtain) Course Documents _____
Tasks _____
(To read) Announcements _____
Discussion Board _____
Links to web pages _____
Which of the features do you think would be most important to you?