APPLIED COMPUTING, MATHEMATICS
AND STATISTICS GROUP
Division of Applied Management and Computing
Determination of Fat Content in
Retail Ready Meat Samples using
Image Analysis
Chandraratne, M.R., Samarasinghe, S., Kulasiri, D.,
Isherwood, P., Bekhit, A.E.D. and Bickerstaffe, R.
Research Report 05/2003
August 2003
R
ESEARCH
E
R
PORT
L I N C O L N
U N I V E R S I T Y
T e W h a r e Wān a k a O A o r a k i
Applied Computing, Mathematics and Statistics
The Applied Computing, Mathematics and Statistics Group (ACMS) comprises staff of the Applied Management and Computing Division at Lincoln University whose research and teaching interests are in computing and quantitative disciplines. Previously this group was the academic section of the Centre for Computing and Biometrics at Lincoln University.
The group teaches subjects leading to a Bachelor of Applied Computing degree and a computing major in the Bachelor of Commerce and Management. ln addition, it contributes computing, statistics and
mathematics subjects to a wide range of other Lincoln University degrees. In particular students can take a computing and mathematics major in the BSc.
The ACMS group is strongly involved in postgraduate teaching leading to honours, masters and PhD degrees. Research interests are in modelling and simulation, applied statistics, end user computing, computer assisted learning, aspects of computer networking, geometric modelling and visualisation.
Research Reports
Every paper appearing in this series has undergone editorial review within the ACMS group. The editorial panel is selected by an editor who is appointed by the Chair of the Applied Management and Computing Division Research Committee.
The views expressed in this paper are not necessarily the same as those held by members of the editorial panel. The accuracy of the information presented in this paper is the sole responsibility of the authors.
This series is a continuation of the series "Centre for Computing and Biometrics Research Report" ISSN 1173-8405.
Copyright
Copyright remains with the authors. Unless otherwise stated permission to copy for research or teaching purposes is granted on the condition that the authors and the series are given due acknowledgement. Reproduction in any form for purposes other than research or teaching is forbidden unless prior written permission has been obtained from the authors.
Correspondence
This paper represents work to date and may not necessarily form the basis for the authors' final conclusions relating to this topic. It is likely, however, that the paper will appear in some form in a journal or in conference proceedings in the near future. The authors would be pleased to receive correspondence in connection with any of the issues raised in this paper. Please contact the authors either by email or by writing to the address below.
Any correspondence concerning the series should be sent to:
The Editor
Applied Computing, Mathematics and Statistics Group Applied Management and Computing Division
PO Box 84 Lincoln University Canterbury NEW ZEALAND
DETERMINATION OF FAT CONTENT IN RETAIL READY MEAT SAM:PLES
USING IMAGE ANALYSIS
Chandraratne, M. R. I; Samarasinghe, S. 2; Kulasiri. D. 2; Isherwood, P. I; Bekhit, A. E. D.I
and Bickerstaffe, R. 1
lMolecular Biotechnology Group, Animal and Food sciences Division,
2Centre for Advanced Computational Solutions (C-fACS), Lincoln University, Canterbury, New Zealand
Background
As a result of constantly growing consumer expectations for meat quality, the meat
industry is placing more and more emphasis on quality assurance issues. Fat content in
meat influences some important meat quality parameters and meat marketability. Visible
fat includes marbling (intramuscular) and intermuscular fat. Chemical analysis is currently
used to determine the fat percentage in meat. However, this is a tedious, expensive and
time-consuming method. Some measurements, like the number, size distribution and
spatial distribution of marbling, are totally impossible by chemical analysis. For the meat
industry, it is very useful to have an accurate, reliable, cost effective, fast and
non-destructive technique to determine the fat content.
Computer vision has enormous potential for evaluating meat quality because image
processing and analysis techniques can quantitatively and consistently characterize
complex geometric, colour and textural properties. Early studies have shown that image
analysis technology has great potential to improve the human based meat quality operation
(Cross et aI., 1983; Wassenberg et aI., 1986). In the last two decades, image analysis
technology has been developed in several countries and tested for beef, lamb and pork
quality evaluation purposes. These include the quantification of intramuscular fat content
in the beef rib eye (Chen et aI., 1989), evaluation of marbling percentage and colour scores
in beef (Gerrard eta!., 1996; Schutte et aI., 1998) and prediction of marbling (Ballerini and
Bocchi, 2001; Kuchida et aI., 1998; 2000).
Texture analysis approaches have also been used in the prediction of fat content
using image analysis techniques (Ballerini and Bocchi, 2001). In addition to visible light
images, the other types of images, such as ultrasound (Kim et aI., 1998) and nuclear
magnetic resonance images (Ballerini et aI., 2002) have been tested in quantification of
Objectives
The objectives of the present study were: ' a) to apply image processing techniques to
quantify fat content of beef and lamb steaks; b) to develop a relationship between the
chemical fat content and the fat content measured by image analysis.
Methods
Sample collection: Beef porterhouse steaks (n
=
32) and lamb leg steaks (n=
17) fromNew Zealand supermarkets were selected for this analysis. After image acquisition, the
samples were stored at -20°C for subsequent chemical fat analysis.
Chemical fat analysis: Frozen meat samples (as purchased) were weighed, freeze-dried
and re-weighed to obtain the moisture content. Moisture free samples were crushed using
Retsch Ultra Centrifugal Mill ZM 100 (Retsch GmbH & Co., Germany) and passed
through a 2mm sieve. The crude fat was determined gravimetrically according to Soxhlet
method using Soxtec System (model 1043 Tecator, Sweden) following the manual
instructions and the values were expressed on wet tissue base.
Image capture: The imaging system consisted of a digital camera, lighting system,
personal computer and image processing and analysis software (Chandraratne et aI., 2002).
The samples were all bloomed for 30 min. and surface moisture removed with a paper
towel prior to image capture. For imaging, meat samples were placed flat on a non-glare
black surface and illuminated with standard lighting. Both sides of the meat samples were
imaged, as the amount of visible fat was different on top and bottom surfaces. The still
colour images were later transferred to the PC for storage and analysis.
Image processing and analysis: Image processing and analysis was accomplished using
Image-Pro Plus (Media Cybernetics, USA). We have developed semi automatic image
processing and analysis algorithms to determine the fat content from meat images, initially
calculating the lean area and then total area, using Image-Pro Basic programming
language. Background segmentation was performed on the original images to give a
uniform white background. Thresholding was done through trial and error by observing
and selecting the best value, in the three-dimensional colour space (RGB). Initial values
calculated as the fat area ratio using the formula, % fat content
=
(total area - lean area) x100 / total area.
Data analysis: Statistical analysis was performed with SPSS (release 10.0.5, SPSS Inc.).
The SPSS curve estimation procedure was used to develop the best-fit models.
Results and Discussion
We analysed 32 images of beef and 17 images of lamb. The results of chemical and image
analyses based fat measurements are shown in Table 1.
Table 1. Fat content from chemical and image analyses
Min Max
Chemical fat content 2.4
Fat content from images 5.9
25.9
42.6
Percentage of chemical fat (C) can be expressed as
c
= V jat P jat = V jat VjatP jat + VZmPZm + E V jat + VZmP + EjMean±SD
l3.6±4.7
26.7 ± 6.9
CV
34.8
26.0
(1)
where Vjat and Vim are volume of fat and volume of lean, respectively
P jat and PZm are density of fat and lean meat, respectively
E is the weight of constituents other than fat and lean
P = Plm/ Plat
Ej = E/ Plat
Percentage of fat from images (I) can be expressed as
where Ajat and Aim are fat and lean area from images, respectively
Ar is the residual area (other than fat and lean) from images
The equation 2 can be modified as
(2)
(3)
The equations 1 and 3 are comparable except the term VR in the numerator of the equation
3. The denominator of the equation 3 has VR and tla/tlm in places of E1 and p in the
equation 1, respectively. The value of p is always greater than 1. As a result of VR in the
numerator of the equation 3, the value C (chemical fat content) is always less than I (fat
content from images). This is in agreement with the results shown in Table 1. The
difference in the values of C and I will mainly depend on the component VR and the
minimization of VR will help the value of I approach that of C.
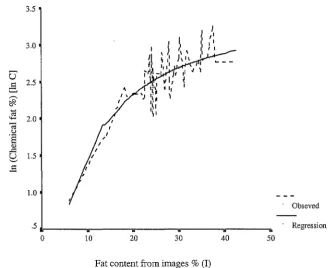
We used SPSS curve estimation module to determine whether the relationship
between fat measurements using chemical and image analyses was best described by a
linear or non-linear regression. The curve estimation module specifies 11 different types
of curves. Statistically the regression was best fit by a non-linear regression. Figure 1
shows the relationship between fat measurements using chemical and image analyses. The
equation obtained for the prediction of crude fat percentage from image analysis
measurements was In(C)
=
e1.2755-(8.62911l) (R2=
0.81). The prediction equation for beef samples was In(C)=
eI.2984-(8.74421I) (R2=
0.84) and for lamb samples wasIn(C)
=
eI. 2647-(9.23751l) (R2=
0.72).Our analysis was based on retail ready meat samples and the equations are for
predicting total fat content (marbling, intermuscular fat and subcutaneous fat). Most of the
reported works were for the prediction of marbling in experimentally prepared meat
samples. Kuchida et al. (1998,2000) reported linear equations for predicting crude fat
content of beef from fat area ratio calculated using image analysis (R2 of 0.91 and 0.96,
respectively). Ballerini and Bocchi (2001) reported a good correlation (0.977) between
chemical fat analysis and fat content calculated using image and fractal texture analyses.
However, image segmentation alone produced lower correlation (0.788). Both these
studies analysed carefully prepared samples in contrast to meat samples from supermarkets
used in our study.
Image analysis is a powerful technique to quantify the fat content in meat.
However, the fat content values calculated by image analysis are quite different from the
chemical fat content. This is probably due to; 1) image analysis takes 2 dimensional image
meat samples is assumed, but practically samples can get stretched unless they are
carefully handled, 3) the image only reflect the meat surface and the distribution of fat
across the thickness of the meat sample may be different from what we see on the surface
and 4) in some cases, segmentation cannot distinguish fat and connective tissue.
Conclusion
The experimental results showed that the prediction of crude fat content from image data
was non-linear. The coefficient of determination of prediction was 0.81. However, the
analysis was based on area measurements only. It is expected that the results can be
further improved by using different feature extraction techniques like texture analysis.
References
Ballerini, L., and Bocchi, L. (2001). 2nd International Symposium on Image and Signal Processing and Analysis (ISPA 2001), Pula, Croatia, 19 - 21 June 2001.
Ballerini, L., Hogberg, A, Borgefors, G., Bylund, A. c., Lindgard, A, Lundstroam, K., Rakotonirainy, O. and Soussi, B. (2002). IEEE transactions on Nuclear Science, 49 (1), 195 - 199.
Chandraratne, M.R., Kulasiri, D., Samarasinghe, S., Frampton, C. and Bickerstaffe, R. (2002). 48th ICoMST,
Rome, Italy, 25-30 August 2002, pp 756 - 757.
Chen, Y. R., McDonald, T. P. and Crouse, J. D. (1989). ASAE Paper No. 893009, ASAE, St. Joseph,
Michigan, U.S.A
Cross, H. R., Gilliland, D. A, Durland, P. R. and Seideman, S. (1983). Journal of Animal Science, 57(4),908
- 917.
Gerrard, D. E., Gao, X., & Tan, J. (1996). Journal Food. Science, 61, 145 - 148.
Kim, N. D., Amin, V., Wilson, D., Rouse, G. and Udpa, S. (1998). Ultrasonic Imaging, 20,191 - 205.
Kuchida, K., Konishi, K., Suzuki, M. and Miyoshi, S. (1998). Animal Science and Technology, 69 (6), 585
-588.
Kuchida, K., Konk, S., Konishi, K., Van Vleck, L. D., Suzuki, M. and Miyoshi, S. (2000). Journal of Animal Science, 78, 799 - 803.
Schutte, B. R., Biju, N., Kranzler, G. A and Dolezel, H. G. (1998). Research Report P 965, Oklahoma
Agricultural Experimental Station.
3.5
3.0
u
e,
2.51.0
Obseved
.5~---v---__ ----~ __ ----~r---' Regression
o 10 20 30 40 50
Fat content from images % (I)