Regional Variation in Rates of Low Birth Weight
Lindsay A. Thompson, MD, MS*‡; David C. Goodman, MD, MS*‡; Chiang-Hua Chang, MS‡; and The´re`se A. Stukel, PhD‡§
ABSTRACT. Objective. Low birth weight (LBW;<2500 g) is the result of complex and poorly understood interac-tions between the biological determinants of the mother and the fetus, the parent’s socioeconomic status, and med-ical care. After controlling for these established risk factors, the extent of regional variation in LBW rates remains un-known. This study measures regional variation in LBW rates and identifies regions of neonatal health services with significantly high or low adjusted rates.
Methods. Linking the United States 1998 singleton birth cohort (Nⴝ3.8 million) with county and health care characteristics, we conducted a small area analysis of LBW across 246 regions of neonatal health services. We measured observed rates and then used a multivariable, hierarchical model to estimate adjusted LBW rates by regions. We then stratified these rates by race for the 208 regions with adequate sample size.
Results. Observed LBW rates varied across regions from 3.8 to 10.6 per 100 live births (interquartile range: 5.0 – 6.8 [25th–75th percentile]; median: 5.9). After control-ling for known maternal and area risk factors, 67 (27.0%) regions had rates significantly below and 98 (39.8%) re-gions had rates significantly higher than the national rate of 6.0 per 100 live births. Although black mothers were more likely to give birth to an LBW newborn, regional adjusted rates still varied>3-fold within both black and nonblack subgroups.
Conclusions. After controlling for known maternal and area risk factors, LBW rates markedly varied across US regions of neonatal health services for both black and nonblack mothers. Additional analyses of these re-gions may provide opportunities for regional account-ability in pregnancy outcomes, LBW research, and tar-geted improvement interventions, especially in high-risk populations. Pediatrics 2005;116:1114–1121; infant low birth weight, small area analysis, health services research.
ABBREVIATIONS. LBW, low birth weight; NICR, Neonatal Inten-sive Care Region; NSA, Neonatal IntenInten-sive Care Region.
D
espite improvements in perinatal outcomes over the past decades, low birth weight (LBW), defined as a birth weight ⬍2500 g, remains a major problem in the United States. LBW is the most prevalent and dominant risk factor for infant mortality and childhood developmental disorders, making it an important target for improvement efforts. Research has shown that LBW results from interactions between the biological determinants of the mother and the fetus; the parent’s social milieu; and the effectiveness of medical care during the periconceptual, prenatal, and perinatal periods, but these interactions are complex and poorly understood. Furthermore, public health initiatives aimed at reducing LBW rates have been largely unsuc-cessful, and national rates have actually increased over the past decade, despite the goal of the Healthy People 2010 of 5.0 per 100 live births, a 30% reduction.1–6Although LBW is a national problem, its burden falls unevenly across communities and their perina-tal populations.7–15For example, black infants have LBW rates twice that of nonblack infants, and this persistent difference is believed to be 1 factor that is fundamental to longstanding racial disparities in child health.2,16 Much less is known about the con-tribution of place, such as the region of maternal residence and health care delivery, to newborn out-comes. Research on regional rates of LBW serves 3 purposes. First, it describes the extent of variation in rates of LBW. Second, research can identify regions that have significantly high or low adjusted LBW rates. Regions with adjusted rates lower than ob-served are performing better than expected and may serve as benchmarks for others to emulate. Regions that do relatively poorly would be places to direct additional research and prevention efforts. Finally, research on area variation in LBW rates can examine the interaction between individual characteristics, such as race, and community and health system fac-tors.
Although the identification of high-risk popula-tions has always been central to LBW prevention, there have been few studies of regional variation in LBW rates using the US birth cohort,17–21 and none that has used regions that reflect neonatal health care delivery. In this study, we link the US singleton cohort to constructed areas of neonatal health care to measure the extent of regional variation in LBW rates.22 We compute regional observed rates, and, using a multivariable, hierarchical model, we esti-mate regional adjusted rates. Any remaining varia-tion in adjusted rates cannot be explained by mea-surable individual and community variables. To From the *Department of Pediatrics, ‡Center for the Evaluative Clinical
Sciences and Department of Community and Family Medicine, Dartmouth Medical School, Hanover, New Hampshire; and §Institute for Clinical uative Sciences, and Department of Health Policy, Management and Eval-uation, Faculty of Medicine, University of Toronto, Toronto, Ontario, Can-ada.
Accepted for publication Feb 4, 2005. doi:10.1542/peds.2004-1627 No conflict of interest declared.
Address correspondence to Lindsay A. Thompson, MD, MS, 622 West 168th St, VC4-402D, Columbia University College of Physicians and Surgeons, New York, NY 10032. E-mail: lt2132@columbia.edu
clarify further the contribution of region of maternal residence, we stratify the analyses by maternal race to compare the relative influence of these factors.
METHODS Study Population
We studied the 1998 US birth cohort (N⫽3 945 192 live births) as recorded in the Linked Birth/Death data set from the National Center for Health Statistics.23We excluded infants who were born to foreign residents who gave birth in the United States (n⫽3639), those with unknown birth weights (n⫽2020), those who were
⬍500 g (n⫽6349), and those for whom maternal age was un-known (n⫽158). We also excluded infants from multiple births (n⫽116 491) to reduce confounding influences such as treatments for infertility. The total study population was 3 816 535 births.
Overview of Units of Analysis and Observation This study describes variation at a regional level while control-ling for individual and subregional characteristics in the statistical models. The unit of analysis was the maternal–newborn dyad, and the exposure of interest was the region of neonatal services, called the Neonatal Intensive Care Region (NICR). This is referred to as multilevel modeling.24,25By including individual and region-level variables, these models enable (1) interpretation of patient- and region-level factors, (2) optimal control for confounding at all levels, and (3) inference to the individual patient. The lowest level of geography was the county, the geographic identifier present on each maternal–newborn record. The next level was Newborn Ser-vice Areas (NSAs;N⫽1601), which are county aggregates, and the highest level was NICRs (N⫽246), which are NSA aggregates. Area characteristics were measured at the county level, with the exception of the supply of obstetricians, which was measured at the level of the NSA. Observed and adjusted LBW rates were summarized and presented by NICRs.
Definition of Regions of Neonatal Health Services Using traditional methods of small area analysis, we used the NSA (n⫽1601) and NICRs (n⫽246) as units of observation for measuring neonatal health services and the occurrence of LBW. (The definitional methods are described in detail elsewhere.26,27) NSAs and NICRs, aggregates of contiguous counties, delineate relatively discrete areas of perinatal care and neonatal health care resources. These service areas are large enough to make stable comparisons but small enough for planning, and they do exhibit large variations in outcomes. NSAs are county groupings whose expectant mothers gave birth primarily in hospitals within that area. NICRs are NSA groupings whose very low birth weight infants (⬍1500 g) received most of their health care from NICUs within that area. For this analysis, the NICRs had a wide range in number of births (minimum: 1322; median: 10 149; maximum: 154 201) and LBW births (minimum: 54; median: 591; maximum: 8038), as well as in the number of LBW births to black mothers (minimum: 0; median: 129; maximum: 3573).
Individual Characteristics
Models included individual characteristics that were shown in previous research to influence LBW. Variables from Vital Statistics included maternal age (⬍20 years, 20 –34, andⱖ35), race (black, white, or other), Hispanic ethnicity (yes, no, or unknown), com-pleted high school (yes, no, or unknown), marital status (married or single), live birth order (first born, subsequent, or unknown), weight gain (ⱕ21 pounds,⬎21, or unknown), maternal birth place (foreign, United States, or unknown), tobacco and alcohol use (yes, no, or unknown), and timing of prenatal care (first trimester, later/none, or unknown). We defined maternal medical risk fac-tors as being 1 or more of the following: cardiac disease, acute or chronic lung disease, diabetes, hydramnios or oligohydramnios, hemoglobinopathy, chronic or pregnancy-associated hyperten-sion, previous preterm delivery, renal disease, Rh sensitization, or “other medical risk factors.”4,26,28–33Use of assisted reproductive technology is not recorded on vital records, making it unavailable for this study.34 However, we excluded infants from multiple births, significantly reducing the contribution of assisted repro-ductive technology in our study population.
Regional Characteristics
County-level characteristics reflect community risks and have been shown in previous studies to be associated with LBW.5,7,8,10–15,35 We used county median household income from the 2000 decen-nial Census and metropolitan statistical area designation as a proxy for county urban or rural status.36We generated contextual variables from Vital Statistics for the county-specific percentage of teenaged and smoking mothers.23Finally, we used county eleva-tion data from the Area Resource File,37categorized asⱕ3000 ft, 3001 to 6500 ft, and⬎6500 ft, except for counties in Alaska and Hawaii and cities within Virginia. For Virginian cities, we as-signed the value of the contiguous county. For Alaska and Hawaii, we used county airport elevation.38
Greater physician supply and access may influence birth weight.39We developed regional physician supply measures from the 1996 American Medical Association and the American Osteo-pathic Association Masterfiles, which represent a census of US physicians irrespective of association membership.40We defined adult primary care physician supply at the county level as the sum of internists and family practitioners divided by the total popula-tion. Rates of obstetricians per women aged 15 to 44 were calcu-lated at the NSA level. We also included for each county the presence or absence of a maternal–fetal specialist.40
Statistical Analyses
We calculated overall crude rates by regions of neonatal health services (NICRs) with the number of LBW births as the numerator and the number of live births as the denominator. We also strat-ified by black and nonblack mothers, excluding regions with imprecise rates as a result of small numbers of black births (⬍100 births to black mothers;N⫽38 regions).
To calculate regional adjusted rates, we used multivariable logistic regression analyses with individual birth as the unit of analysis.24,25,41We first developed a model that included relevant individual- and area-level predictors (odds ratios and confidence intervals are presented in the Appendix Table). Seven variables of theoretical interest were excluded from this model because they were either collinear with median household income (county rates of child poverty, unemployment rates) or not influential in both bivariate and multivariable models (number of hospitals with obstetric services, neonatologists per birth, pediatricians per child 0 –17 years, and the presence of a Title X or a fertility clinic). We adjusted for the effect of nesting of LBW infants within counties in this initial model by using overdispersed binary logistic models, clustered by county.24 The net effect of the clustering was to increase the width of the confidence intervals by⬃2.1%. We used these variables to develop a second model to compute adjusted NICR rates by including indicator variables for each of the 246 NICRs and excluding the intercept term; all covariates were cen-tered around the study population means so that the adjusted LBW rates would reflect an average member of the study popu-lation. For transforming the NICR-specific regression coefficients to the original scale, they were exponentiated and then calibrated so as to have the same overall mean as the crude NICR rates. We considered NICRs to have significantly higher or lower rates than the national mean when the 95% confidence interval for the ad-justed rate did not include the national singleton rate of 6.0 per 100 live births. Analyses were performed using SAS version 8.2 (Cary, NC).42This study was granted exempt status from the Dartmouth College institutional review board.
RESULTS
Associations of LBW With Individual and Regional Characteristics
surprising, LBW was frequent in premature newborns (⬍37 weeks’ gestation, 36.7 per 100 live births).
In addition to individual characteristics, regional
characteristics were associated with variations in LBW rates (Table 2). Mothers who resided in coun-ties with lower median household income (7.4 per 100 live births) or more teenaged mothers (7.6) were more likely to deliver an LBW infant. LBW was also more common in counties with higher elevation (7.7). LBW rates also differed by health service char-acteristics of the regions. Areas with more providers had consistently higher observed rates of LBW.
Regional Variation in Observed LBW Rates
LBW rates varied markedly across regions. Overall, crude LBW rates ranged from 3.8 to 10.6 per 100 live births (interquartile range: 5.0–6.8 [25th–75th percen-tile]; median: 5.9; Fig 1). Regional LBW rates were higher for black mothers (range: 7.1–16.8 per 100 live births;n ⫽208 NICRs with at least 100 black births), than nonblack mothers (range: 3.7–7.2 per 100 live births;n ⫽208 NICRs). For these unadjusted rates, in no instance was the black rate lower than the nonblack rate within the same region (n⫽208 NICRs).
The Healthy People 2010 goal is 5.0 per 100 live births, but this includes multiple as well as singleton pregnancies. Still, 75% of the regions had LBW rates that exceeded this goal, and no region met the goal for black mothers.
Regional Variation in Adjusted LBW Rates
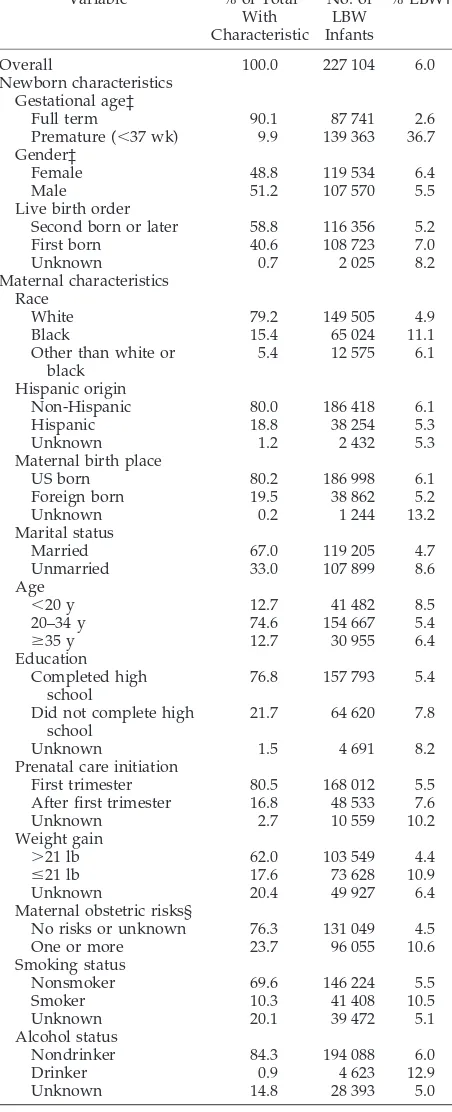
After controlling for known individual and re-gional characteristics using a multilevel model, LBW TABLE 1. Characteristics of the 1998 Singleton Birth Cohort
(n⫽3 816 535) and Their Mothers and Observed Rates of LBW*
Variable % of Total
With Characteristic No. of LBW Infants % LBW†
Overall 100.0 227 104 6.0
Newborn characteristics Gestational age‡
Full term 90.1 87 741 2.6
Premature (⬍37 wk) 9.9 139 363 36.7 Gender‡
Female 48.8 119 534 6.4
Male 51.2 107 570 5.5
Live birth order
Second born or later 58.8 116 356 5.2
First born 40.6 108 723 7.0
Unknown 0.7 2 025 8.2
Maternal characteristics Race
White 79.2 149 505 4.9
Black 15.4 65 024 11.1
Other than white or black
5.4 12 575 6.1
Hispanic origin
Non-Hispanic 80.0 186 418 6.1
Hispanic 18.8 38 254 5.3
Unknown 1.2 2 432 5.3
Maternal birth place
US born 80.2 186 998 6.1
Foreign born 19.5 38 862 5.2
Unknown 0.2 1 244 13.2
Marital status
Married 67.0 119 205 4.7
Unmarried 33.0 107 899 8.6
Age
⬍20 y 12.7 41 482 8.5
20–34 y 74.6 154 667 5.4
ⱖ35 y 12.7 30 955 6.4
Education Completed high
school
76.8 157 793 5.4
Did not complete high school
21.7 64 620 7.8
Unknown 1.5 4 691 8.2
Prenatal care initiation
First trimester 80.5 168 012 5.5
After first trimester 16.8 48 533 7.6
Unknown 2.7 10 559 10.2
Weight gain
⬎21 lb 62.0 103 549 4.4
ⱕ21 lb 17.6 73 628 10.9
Unknown 20.4 49 927 6.4
Maternal obstetric risks§
No risks or unknown 76.3 131 049 4.5
One or more 23.7 96 055 10.6
Smoking status
Nonsmoker 69.6 146 224 5.5
Smoker 10.3 41 408 10.5
Unknown 20.1 39 472 5.1
Alcohol status
Nondrinker 84.3 194 088 6.0
Drinker 0.9 4 623 12.9
Unknown 14.8 28 393 5.0
* Excludes infants born⬍500 g. † All standard errors are⬍0.35%.
‡ Variable not included in overall low birth weight model. § Includes 1 or more of the following maternal obstetric risks: cardiac disease, acute or chronic lung disease, diabetes, hydramnios or oli-gohydramnios, hemoglobinopathy, chronic or pregnancy-associated hypertension, previous preterm delivery, renal disease, Rh sensitiza-tion, or other medical risk factors.
TABLE 2. Regional Characteristics and Observed Rates of LBW for the 1998 Singleton Birth Cohort (n⫽3 816 535)*
Regional Characteristics (3139 Counties Except Where Noted)
% LBW (SE)
Area characteristics
Median household income
Lowest 25% (⬍$29 627)† 7.4 (0.05)
Highest 25% (⬎$39 396) 5.6 (0.01)
Percent teenaged mothers‡
Lowest 25% (⬍10.7%) 5.1 (0.02)
Highest 25% (⬎18.8%) 7.6 (0.05)
Percent smoking mothers‡
Lowest 25% (⬍9.8%) 5.8 (0.02)
Highest 25% (⬎22.0%) 5.9 (0.04)
Metropolitan statistical area
Presence 5.9 (0.01)
Absence 6.1 (0.03)
County elevation
⬍3000 ft 5.9 (0.01)
3000–6500 ft 6.1 (0.05)
⬎6500 ft 7.7 (0.25)
Health service characteristics Primary care providers§
Lowest 25% (⬍2.8 per 10 000 residents) 5.9 (0.04) Highest 25% (⬎5.4 per 10 000 residents) 6.1 (0.02) Obstetricians for women aged 15–44㛳
Lowest 25% (⬍1.4 per 10 000 women) 5.6 (0.07) Highest 25% (⬎4.8 per 10 000 women) 6.1 (0.02) Maternal–fetal specialist
Presence 6.1 (0.02)
Absence 5.8 (0.02)
* Excludes infants born⬍500 g.
† Lowest and highest 25% refers to counties or NSAs.
‡ Generated as contextual variables from Vital Statistics individual information.
§ Primary care providers defined as family practitioners plus in-ternal medicine specialists
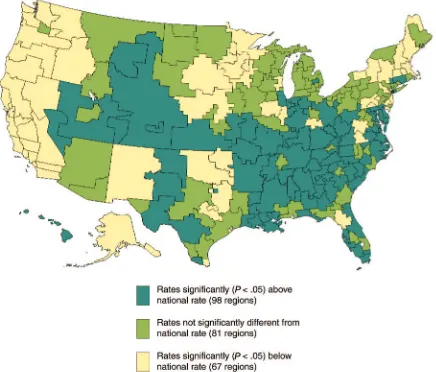
rates still varied widely across regions (Fig 2). Ad-justed regional rates revealed a ⬎3-fold difference, ranging from 3.4 to 11.1 per 100 live births (inter-quartile range: 5.3– 6.9 [25th–75th percentile]; me-dian: 6.2). The adjusted rates were significantly be-low the national rate in 67 (27.0%) regions and significantly higher in 98 (39.8%) regions. Many of the 67 regions with adjusted rates lower than the
national rate were concentrated in the Pacific and Northeast regions. Conversely, most of the south-eastern, south-central, and western areas had ad-justed rates higher than the national rate.
Stratification by Race
Regional variation in LBW persisted even after strat-ification by maternal race. Adjusted LBW rates for non-black mothers varied from 2.9 to 9.5 per 100 live births (interquartile range: 4.5–5.8 [25th–75th percen-tile]; median: 5.2), and rates for black mothers varied from 5.6 to 21.7 (interquartile range: 9.3–12.3 [25th–75th percentile]; median: 10.7). These adjusted rates corre-lated across regions (Pearson correlation⫽0.69;R2⫽ 0.47; P ⬍ .001). Regions that had low LBW rates for black infants, for example, were likely to have low LBW rates for nonblack infants. The Colorado Springs, CO, NICR had exceptionally high adjusted rates for both groups. In the NICR that included Sacramento, CA, the adjusted rates for both black and nonblack infants were comparably low (6.2 and 2.9, respectively). A notable exception was the NICR that included El Paso, TX, where adjusted rates were disproportionately high for black in relation to nonblack infants (20.7 vs 4.6). In only 1 instance (the Evansville, IN, NICR) was the adjusted LBW rate for nonblack infants greater than Fig 1. Singleton LBW rates across neonatal regions. Each circle
represents 1 region (246 regions for total births; 208 regions for births stratified by race). Healthy People 2010 goal of 5.0 is rep-resented by the horizontal line (this goal includes multiple and singleton births).
the adjusted black LBW rate, although the difference was small (6.9 vs 7.0).
DISCUSSION
This study found that LBW rates varied 3-fold across US regions of neonatal health care and that this variation could not be explained by known in-dividual and community risk factors. These regional differences in LBW cannot be explained by differing racial composition of the areas, as the models con-trolled for race, in addition to many other character-istics. Moreover, marked variation persisted in mod-els that were stratified by race. Although individual and regional characteristics remain important influ-ences of LBW, this study demonstrates that a signif-icant extent of LBW risk remains unexplained and is linked to place of maternal residence and perinatal health care delivery.
There are 2 possible explanations for the regional variation in the adjusted rates found in this study. The first is that our models incompletely controlled for the underlying biological and social risks of LBW within regions. For example, populations may have different rates of maternal nutrition, periodontal dis-ease, or bacterial vaginosis, perhaps contributing to differences in regional rates.5,43,44 As long as the biological and social causes of LBW remain quately understood, they will, of course, be inade-quately measured.29 For these to explain the varia-tion that we found, the risk factors that were omitted from the models would need to be strong predictors of LBW and be uncorrelated with the included vari-ables. Although possible, this seems unlikely. Nev-ertheless, the identification of additional risk factors would be an important advancement in perinatology and would create new opportunities for improve-ment in newborn outcomes.
A second possible explanation of the variation in adjusted rates is that a region’s social and medical systems respond differently to the biological and social risk of its population. For example, more ef-fective social welfare or health programs in some regions may lead to healthier women of childbearing years, even in regions with elevated individual risk.3 Differential access to contraception may lead to vari-ations in the occurrence of unintended pregnancies, a factor that is known to be associated with LBW and other poor birth outcomes.45Furthermore, the orga-nization and the delivery of health services, includ-ing perinatal transport or the interaction of primary, secondary, and tertiary care for mothers and their newborns, may play important roles in regional rates of LBW. Some regions of the country with higher adjusted LBW rates, such as the Southeast, are also known to have higher rates of adult conditions, in-cluding stroke and kidney disease, warranting addi-tional investigation.46 It is interesting that there are many regions in close proximity, even within states, that have low rates of LBW adjacent to regions with high LBW rates. These area pairs may be particularly useful for community studies of the health care pro-vided to women of childbearing age.
The disparities in regional rates between black and nonblack infants are considerable and reflect
consis-tent, unexplained elevated health risks for black in-fants. Racial disparities in perinatal health outcomes are well documented, although the relative contribu-tions of biological, socioeconomic, and health care factors remain unknown.4,47–49Irrespective of biolog-ical and social risk, several studies reveal health care utilization differentials between black and nonblack individuals.12,16,30,50,51 In addition to these dispari-ties, this study shows that there are large variations of LBW rates within racial groups across these neo-natal health care regions, suggesting that region of residence and perinatal care are as important as race, even if the mechanism is poorly understood.
The method that we use for studying regions provides an additional mechanism for national ac-countability in newborn outcomes, an unmet goal in perinatal policy.52 The 1976 document “Toward Im-proving the Outcome of Pregnancy” provided a con-ceptual framework to improve neonatal outcomes by endorsing the present hospital-based regionalized system of care. A second committee in 1993 (Toward Improving the Outcome of Pregnancy II) expanded their recommendations to emphasize the significance of preconception and perinatal care and accountabil-ity of outcomes.53,54 To date, no national process of measurement that provides regional, population-based, risk-adjusted perinatal outcomes has been im-plemented. Recent studies have used hospitals as the unit of analysis to document variation in neonatal mortality rates.55–58 Although these studies provide valuable hospital-specific outcomes, they lack, by design, a population-based analysis of the region where the prenatal and perinatal care is delivered. Other studies have compared LBW rates across in-stitutions, counties, states, and specific regions, but they have not controlled for many known risk fac-tors, and all but 1 lack a national perspective to appreciate fully the range of variation.2,17–21,56,59,60 Furthermore, whereas health policy decisions in the United States are often made at the state or national level, health service delivery is more local. The 246 health regions that were used in this study are suf-ficiently large to allow for stable comparisons of LBW rates, unlike most counties, yet are still small enough to reveal important variations and thus can be useful in regional profiling and in planning re-gional perinatal improvement efforts.61
is arbitrary and advocate for population-specific birth weight standards.62–64Although this is likely to be a more precise measurement to compare different groups across populations, our analyses are primar-ily concerned with regional performance within pop-ulations.
This study demonstrates that although the risks of LBW remain incompletely understood, the region of maternal residence and perinatal care are strongly associated with LBW rates. This method of estimat-ing adjusted area rates of LBW offers a tool for
ini-tiating national accountability of LBW rates at the level of health services delivery. Identifying health service regions and communities with high or low LBW rates provides a new direction for future re-search on unknown and unmeasured risk and assists targeted efforts of interventions in a field in which progress has been elusive. Until efforts are made to understand and intervene in the causes of regional variation in rates of LBW, there is little chance that the United States will achieve the LBW goals of 5.0 per 100 live births of Healthy People 2010.
Appendix. Unadjusted and Adjusted Odds Ratios (95% CI) of Individual, Community, and Health Care Variables of LBW Rates for the 1998 US Singleton Birth Cohort (n⫽3 816 535)
Independent Variable Unadjusted
Odds Ratio
Adjusted Odds Ratio*
Newborn characteristics
Live birth order (referent⫽subsequent births)
First born 1.38 (1.37–1.39) 1.59 (1.56–1.62)
Unknown 1.62 (1.55–1.70) 1.42 (1.30–1.55)
Maternal characteristics Race (referent⫽white)
Black 2.39 (2.36–2.41) 1.97 (1.92–2.02)
Other than white or black 1.24 (1.22–1.26) 1.33 (1.27–1.38) Hispanic origin (referent⫽non-Hispanic)
Hispanic 0.86 (0.85–0.87) 1.05 (1.01–1.08)
Unknown 0.86 (0.83–0.90) 0.90 (0.85–0.95)
Maternal birth place (referent⫽US birth)
Foreign 0.84 (0.84–0.85) 0.92 (0.89–0.94)
Unknown 2.33 (2.19–2.47) 1.50 (1.37–1.63)
Unmarried (referent⫽married) 1.92 (1.90–1.93) 1.24 (1.23–1.26) Age (referent⫽20–34 y)
⬍20 y 1.62 (1.61–1.64) 1.00 (0.98–1.02)
ⱖ35 y 1.19 (1.17–1.20) 1.31 (1.28–1.34)
Education (referent⫽completed high school)
Did not complete high school 1.48 (1.47–1.50) 1.16 (1.14–1.18)
Unknown 1.56 (1.51–1.61) 1.11 (1.06–1.16)
Prenatal care initiation (referent⫽first trimester)
After first trimester 1.41 (1.40–1.43) 1.03 (1.01–1.05)
Unknown 1.96 (1.92–2.00) 1.52 (1.45–1.58)
Weight gain (referent⫽ ⬎21 lb)
ⱕ21 lb 2.68 (2.65–2.71) 2.54 (2.51–2.57)
Unknown 1.50 (1.48–1.52) 2.09 (1.99–2.19)
One or more maternal risks† (referent⫽no risk or unknown)
2.52 (2.50–2.55) 2.34 (2.27–2.41)
Smoking status (referent⫽nonsmoker)
Smoker 2.01 (1.99–2.03) 1.89 (1.86–1.92)
Unknown 0.93 (0.92–0.94) 1.00 (0.92–1.08)
Alcohol drinker (referent⫽nondrinker)
Drinker 2.31 (2.24–2.39) 1.30 (1.24–1.36)
Unknown 0.82 (0.81–0.84) 0.74 (0.68–0.81)
Regional characteristics‡
Median household income 0.89 (0.88–0.89) 0.98 (0.96–1.00)
Percentage of
Teenage mothers 1.37 (1.36–1.38) 1.11 (1.07–1.15)
Smoking mothers 1.06 (1.05–1.06) 0.97 (0.95–0.99)
Rate of primary care providers§ 1.13 (1.11–1.16) 0.89 (0.83–0.95)
Rate of obstetricians 1.19 (1.17–1.21) 1.14 (1.08–1.20)
Maternal–fetal specialist (referent⫽absence) 1.05 (1.04–1.06) 0.98 (0.94–1.01) Metropolitan statistical area (referent⫽
nonmetropolitan)
0.97 (0.96–0.98) 1.02 (0.99–1.05)
Elevation (referent⫽3000 ft)
3001–6500 ft 1.02 (1.00–1.04) 1.14 (1.06–1.22)
⬎6500 ft 1.32 (1.23–1.41) 1.40 (1.15–1.70)
CI indicates confidence interval.
* Adjusted rates include all variables in table and are clustered around county of maternal residence. † Includes 1 or more of the following maternal obstetric risks: cardiac disease, acute or chronic lung disease, diabetes, hydramnios or oligohydramnios, hemoglobinopathy, chronic or pregnancy-associ-ated hypertension, previous preterm delivery, renal disease, Rh sensitization, or other medical risk factors.
‡ Regions are counties (n⫽3139) except for NSA (n⫽1601) used in the measurement of obstetricians and pediatricians.
ACKNOWLEDGMENTS
This article was funded by the Tiffany Blake Fellowship from the Hitchcock Foundation (Dr Thompson) and the Robert Wood Johnson Foundation.
We are deeply grateful for the thoughtful insights of George A. Little, MD, on review of this article, as well as for the broader views given by Lorraine Klerman, PhD.
REFERENCES
1. Keppel KG, Pearcy JN, Wagener DK.Trends in Racial and Ethnic-Specific Rates for the Health Status Indicators: United States, 1990 –1998. Hyatts-ville, MD: National Center for Health Statistics; 2002
2. Hoyert DL, Freedman MA, Strobino DM, Guyer B. Annual summary of vital statistics.Pediatrics.2001;108:1241–1255
3. Hughes D, Simpson L. The role of social change in preventing low birth weight.Future Child.1995;5:87–102
4. Dubay L, Joyce T, Kaestner R, Kenney GM. Changes in prenatal care timing and low birth weight by race and socioeconomic status: impli-cations for the Medicaid expansions for pregnant women.Health Serv Res.2001;36:373–398
5. Arias E, MacDorman MF, Strobino DM, Guyer B. Annual summary of vital statistics—2002.Pediatrics.2003;112:1215–1230
6. US Department of Health and Human Services: Healthy People 2010. US Department of Health and Human Services. Available at: www.healthypeople.gov/document/html/objectives/16 –10.htm. Ac-cessed February 3, 2005
7. Unger C, Wesler JK, McCullough RE, Keefer S, Moore LG. Altitude, low birth weight, and infant mortality in Colorado. JAMA. 1988;259: 3427–3432
8. Basso O, Olsen J, Johansen AM, Christensen K. Change in social status and risk of low birth weight in Denmark: population based cohort study.BMJ.1997;315:1498 –1502
9. Crosse EA, Alder RJ, Ostbye T, Campbell MK. Small area variation in low birthweight: looking beyond socioeconomic predictors.Can J Public Health.1997;88:57– 61
10. Larson EH, Hart LG, Rosenblatt RA. Is non-metropolitan residence a risk factor for poor birth outcome in the U.S.?Soc Sci Med.1997;45: 171–188
11. O’Campo P, Xue X, Wang MC, Caughly MO. Neighborhood risk factors for low birthweight in Baltimore: a multilevel analysis.Am J Public Health.1997;87:1113–1118
12. Gorman B. Racial and ethnic variation in low birth weight in the United States: individual and contextual determinants.Health Place. 1999;5: 195–207
13. Luginaah IN, Lee KS, Abernathy TJ, Sheehan D, Webster G. Trends and variations in perinatal mortality and low birthweight: the contribution of socio-economic factors.Can J Public Health.1999;90:377–381 14. Pearl M, Braveman P, Abrams B. The relationship of neighborhood
socioeconomic characteristics to birthweight among 5 ethnic groups in California.Am J Public Health.2001;91:1808 –1814
15. Jaffee KD, Perloff JD. An ecological analysis of racial differences in low birthweight: implications for maternal and child health social work. Health Soc Work.2003;28:9 –22
16. Collins JW Jr, David RJ, Handler A, Wall S, Andes S. Very low birth-weight in African American infants: the role of maternal exposure to interpersonal racial discrimination. Am J Public Health. 2004;94: 2132–2138
17. Grossman M, Jacobowitz S. Variations in infant mortality rates among counties of the Unites States: the roles of public policies and programs. Demography.1981;18:695–713
18. Grossman M, Joyce, TJ.Unobservables, Pregnancy Resolutions and Birth-weight Production Functions in New York City(Working Paper No. 2746). Cambridge, MA: National Bureau of Economic Research; 1988 19. Corman H, Grossman M.Determinants of Neonatal Mortality Rates in the
US: A Reduced form Model(Working Paper No. 1287). Cambridge, MA: National Bureau of Economic Research; 1984
20. Corman H, Joyce TJ, Grossman M.Birth Outcome Production Functions in the US. Cambridge, MA: National Bureau of Economic Research; 1985 21. Joyce T.Impact of Augmented Prenatal Care on Birth Outcomes of Medicaid
Recipients in New York City(Working Paper No. 6029). Cambridge, MA: National Bureau of Economic Research; 1997
22. Goodman DC, Fisher ES, Little GA, Stukel TA, Chang CH, Schoendorf KS. The relation between the availability of neonatal intensive care and neonatal mortality.N Engl J Med.2002;346:1538 –1544
23. National Center of Health Statistics.Linked Birth/Death Data Set. Atlanta, GA: Centers for Disease Control and Prevention; 1998
24. McCullagh P, Nelder JA.Generalized Linear Models.2nd ed. New York, NY: Chapman and Hall; 1989
25. Diez-Roux A. Multilevel analysis in public health research.Annu Rev Public Health.2000;21:171–192
26. Goodman DC, Fisher ES, Little GA, Stukel TA, Chang CH. The uneven landscape of newborn intensive care services: variation in the neona-tology workforce.Effect Clin Pract.2001;4:143–148
27. Wennberg J, Gittelsohn A. Small area variations in health care delivery. Science.1973;182:1102–1108
28. McCormick MC. The contribution of low birth weight to infant mortal-ity and childhood morbidmortal-ity.N Engl J Med.1985;312:82–90
29. Paneth NS. The problem of low birth weight.Future Child.1995;5:19 –34 30. Hessol NA, Fuentes-Afflick E, Bacchetti P. Risk of low birth weight infants among black and white parents.Obstet Gynecol.1998;92:814 – 822 31. Fang J, Madhavan S, Alderman MH. Low birth weight: race and ma-ternal nativity—impact of community income.Pediatrics.1999;103(1). Available at: www.pediatrics.aappublications.org/cgi/content/full/ 103/1/e5
32. Goodman DC, Fisher ES, Little GA, Stukel TA, Chang CH. Are neonatal intensive care resources located according to need? Regional variation in neonatologists, beds, and low birth weight newborns. Pediatrics. 2001;108:426 – 431
33. McCormick MC, Siegel JE. Recent evidence on the effectiveness of prenatal care.Ambul Pediatr.2001;1:321–325
34. Schieve LA, Meikle SF, Ferre C, Peterson HB, Jeng G, Wilcox LS. Low and very low birth weight in infants conceived with use of assisted reproductive technology.N Engl J Med.2002;346:731–737
35. Roberts EM. Neighborhood social environments and the distribution of low birthweight in Chicago.Am J Public Health.1997;87:597– 603 36. Office of Management and Budget. Definition of Metropolitan Service
Areas. Available at: www.whitehouse.gov/omb/bulletins/b99-04.html. Accessed January 31, 2005
37. Department of Health and Human Services, Health Resources and Services Administration.Area Resource File (ARF). Rockville, MD: Bu-reau of Health Professions; 2002
38. AirNav LLC. Available at: airnav.com/airports/. Accessed January 31, 2005
39. Shi L, Macinko J, Starfield B, et al. Primary care, infant mortality, and low birth weight in the states of the USA.J Epidemiol Community Health. 2004;58:374 –380
40. Randolph SB, Pasko T.Physician Characteristics and Distribution in the US. Chicago, IL: American Medical Association; 1997
41. Austin PC, Goel V, van Walraven C. An introduction to multilevel regression models.Can J Public Health.2001;92:150 –154
42. SAS/STAT Software.Changes and Enhancements for Release 6.12. Cary, NC: SAS Publishing; 1996
43. Lopez NJ, Smith PC, Gutierrez J. Higher risk of preterm birth and low birth weight in women with periodontal disease.J Dent Res.2002;81: 58 – 63
44. Hillier SL, Nugent RP, Eschenbach DA, et al. Association between bacterial vaginosis and preterm delivery of a low-birth-weight infant. The Vaginal Infections and Prematurity Study Group.N Engl J Med. 1995;333:1737–1742
45. Eggleston E, Tsui AO, Kotelchuck M. Unintended pregnancy and low birthweight in Ecuador.Am J Public Health.2001;91:808 – 810 46. Howard G, Howard VJ, Katholi C, Oli MK, Huston S. Decline in US
stroke mortality: an analysis of temporal patterns by sex, race, and geographic region.Stroke.2001;32:2213–2220
47. Carmichael SL, Iyasu S. Changes in the black-white infant mortality gap from 1983 to 1991 in the United States.Am J Prev Med.1998;3:220 –227 48. Din-Dzietham R, Hertz-Picciotto I. Infant mortality differences between whites and African Americans: the effect of maternal education.Am J Public Health.1998;88:651– 656
49. Branum AM, Schoendorf KC. Changing patterns of low birthweight and preterm birth in the United States, 1981–98.Paediatr Perinatal Epi-demiol.2002;1:8 –15
50. McGrady GA, Sung JF, Rowley DL, Hogue CJ. Preterm delivery and low birth weight among first-born infants of black and white college graduates.Am J Epidemiol.1992;136:266 –276
52. American Academy of Pediatrics.Guidelines for Perinatal Care. 5th ed. Elk Grove Village, IL: American Academy of Pediatrics and the Amer-ican College of Obstetricians and Gynecologists; 2002
53. Committee on Perinatal Health. Toward Improving the Outcome of Pregnancy: Recommendations for the Regional Development of Maternal and Perinatal Health Services. White Plains, NY: March of Dimes Birth Defects Foundation; 1976
54. Commitee on Perinatal Health. Toward Improving the Outcome of Pregnancy: The 90s and Beyond. White Plains, NY: March of Dimes Birth Defects Foundation; 1993
55. Horbar JD, Badger GJ, Lewit EM, Rogowski J, Shiono PH. Hospital and patient characteristics associated with variation in 28-day mortality rates for very low birth weight infants. Vermont Oxford Network. Pediatrics.1997;99:149 –156
56. Gould J. Vital Records for Quality Improvement. Pediatrics. 1999; 103(suppl):278 –290
57. Horbar JD, Badger GJ, Carpenter JH, et al. Trends in mortality and morbidity for very low birth weight infants, 1991–1999.Pediatrics.2002; 110:143–151
58. Sankaran K, Chien LY, Walker R, Seshia M, Ohlsson A, Lee SK; the Canadian Neonatal Network. Variations in mortality rates among Ca-nadian neonatal intensive care units.CMAJ.2002;166:173–178 59. Kieffer EC, Alexander GR, Lewis ND, Mor J. Geographic patterns of low
birth weight in Hawaii.Soc Sci Med.1993;36:557–564
60. Lund R, Modvig J, Hilden J, Rosdahl N, Kure L, Schmidt K. Risk of low birthweight in social districts of Copenhagen.Scand J Public Health. 1999;27:89 –93
61. Marshall MN, Shekelle PG, Leatherman S, Brook RH. The public release of performance data: what do we expect to gain? A review of the evidence.JAMA.2000;283:1866 –1874
62. Wilcox A. On the importance—and the unimportance— of birthweight. Int J Epidemiol.2001;30:1233–1241
63. Wilcox A, Skjaerven R, Buekens P, Kiely J. Birth weight and perinatal mortality. A comparison of the United States and Norway.JAMA. 1995;273:709 –711
64. Wilcox A, Russell I. Why small black infants have a lower mortality rate than small white infants: the case for population-specific standards for birth weight.J Pediatr.1990;116:7–10
WAKE UP! IT’S TIME!
“American taxpayers have heard a fair amount about the fact that their children lag behind the children of Britain, France, Germany and Japan. But American students are also bested by nations like Poland, Ireland and the Czech Republic. Worst of all, they fall further and further behind their peers abroad the longer they stay in school. The United States can still prosper in a world where its labor costs are higher than the competition’s, but it cannot do that if the cheaper workers abroad are also better educated. Business leaders who have firsthand experience with this problem warn that this country could become a third-rate economic power unless it radically remakes its schools. But the education community is in deep denial. American educators typically respond with yawns, and a series of myths. The most common is that Europeans educate only the elite, while this nation educates everybody. That hasn’t been true since the early 20th century. Comparisons show that the rest of the developed world does a better job educating students of all economic backgrounds. A second myth—that America’s white elite children compare favorably with those abroad—is also false. In the most recent international data comparing students in the top 5 percent in terms of achievement, the United States ranks 23rd out of 29. The third and most common myth—that the nations who do better than us are ‘homogenous’ societies—is also not true. Immi-gration has transformed much of Europe, as it has the United States.”
New York Times.September 6, 2005
DOI: 10.1542/peds.2004-1627
2005;116;1114
Pediatrics
Lindsay A. Thompson, David C. Goodman, Chiang-Hua Chang and Thérèse A. Stukel
Regional Variation in Rates of Low Birth Weight
Services
Updated Information &
http://pediatrics.aappublications.org/content/116/5/1114
including high resolution figures, can be found at:
References
http://pediatrics.aappublications.org/content/116/5/1114#BIBL
This article cites 47 articles, 10 of which you can access for free at:
Subspecialty Collections
sub
http://www.aappublications.org/cgi/collection/fetus:newborn_infant_
Fetus/Newborn Infant
sub
http://www.aappublications.org/cgi/collection/environmental_health_
Environmental Health
following collection(s):
This article, along with others on similar topics, appears in the
Permissions & Licensing
http://www.aappublications.org/site/misc/Permissions.xhtml
in its entirety can be found online at:
Information about reproducing this article in parts (figures, tables) or
Reprints
http://www.aappublications.org/site/misc/reprints.xhtml
DOI: 10.1542/peds.2004-1627
2005;116;1114
Pediatrics
Lindsay A. Thompson, David C. Goodman, Chiang-Hua Chang and Thérèse A. Stukel
Regional Variation in Rates of Low Birth Weight
http://pediatrics.aappublications.org/content/116/5/1114
located on the World Wide Web at:
The online version of this article, along with updated information and services, is
by the American Academy of Pediatrics. All rights reserved. Print ISSN: 1073-0397.