ARTICLE
Trends in the Diagnosis of Overweight and Obesity in
Children and Adolescents: 1999 –2007
Lacey Benson, BAa, Heather J. Baer, ScDb,c,d, David C. Kaelber, MD, PhD, MPHa,e
aSchool of Medicine, Case Western Reserve University, Cleveland, Ohio;bDivision of General Medicine and Primary Care, Brigham and Women’s Hospital, Boston,
Massachusetts;cHarvard Medical School, Boston, Massachusetts;dHarvard School of Public Health, Boston, Massachusetts;eDepartments of Internal Medicine, Pediatrics,
and Information Services, MetroHealth System, Cleveland, Ohio
The authors have indicated they have no financial relationships relevant to this article to disclose.
What’s Known on This Subject
Overweight/obesity affects approximately one third of American children. Previous studies have suggested that pediatric overweight/obesity is underdiagnosed and that guidelines for treatment and evaluation often are not followed. It is unclear how recent increases in publicity have affected diagnosis.
What This Study Adds
The percentage of overweight/obese pediatric patients diagnosed within each year increased over the study period until 2005. Our results suggest that the trend of increas-ing diagnosis has plateaued or even decreased in recent years. Most strikincreas-ingly, through-out the study period, the diagnosis of overweight remained below 10%.
ABSTRACT
OBJECTIVE.Pediatric overweight and obesity are increasingly prevalent problems and have received much attention in recent years, but it is unclear whether this publicity has affected diagnosis by clinicians. We undertook the current study to assess trends in diagnosis rates of overweight and obesity in children.
PATIENTS AND METHODS.We analyzed electronic medical record data from 60 711 patients aged 2 through 18 years with at least 1 well-child visit between June 1999 and October 2007 in a large academic medical system in northeast Ohio. Diagnosis of weight problems among children classified as overweight and obese was assessed by usingInternational Classification of Diseases, Ninth Revisioncodes. Logistic regression was used to examine the impact of patient characteristics on diagnosis and to investigate trends over the study period.
RESULTS.On retrospective review of BMI measurements recorded for patients during the study period, 19% of the children were overweight, 23% were obese, and 8% (33% of the obese patients) were severely obese; among these, 10% of overweight patients, 54% of obese patients, and 76% of severely obese patients had their conditions diagnosed. BMI, age, and number of overweight visits were positively associated with diagnosis. Female patients were more likely to have been diagnosed than male patients. Black and Hispanic patients were more likely to have been diagnosed than white patients. There was a statistically significant trend toward
increasing diagnosis during the study period, although the percentage of patients diagnosed per year seemed to plateau or decrease after 2005.
CONCLUSIONS.Although clear BMI definitions of pediatric weight problems exist, a large percentage of overweight and obese patients remain undiagnosed. Diagnosis increased during the study period but remained low among over-weight children, for whom early intervention may be more effective. Identification of overover-weight and obese patients is the first step in addressing this growing epidemic.Pediatrics2009;123:e153–e158
O
VERWEIGHT AND OBESITYare common health problems, affecting 34% of American children.1The prevalence ofobesity in children aged 6 to 19 tripled from 1980 to 2002.1In 2003–2004, 35% of black, 37% of Mexican
American, and 34% of white youths had a BMI ofⱖ85th percentile.1The relative weight of overweight children also
is rising, indicating increasing severity of overweight and obesity.2 This epidemic affects even the youngest age
groups, with an increasing percentage of children under the age of 4 having abnormal BMIs.3As overweight and
obesity increase, the prevalence of costly and harmful comorbid conditions will likely continue to increase. Elevated pediatric BMI is associated with numerous sequelae including high blood pressure,4–6atherosclerosis,7left ventricular
hypertrophy,8,9sleep apnea,10asthma,11polycystic ovarian syndrome,12type 2 diabetes,13gastroesophogeal reflux,14
constipation,15and orthopedic complications.16All-cause and cardiovascular mortality in adults have been associated
with higher childhood BMI.17
Previous studies have suggested that pediatric overweight and obesity are underdiagnosed and that guidelines for treatment and laboratory evaluation often are not followed.18–22Diagnosis of obesity is the first step toward treatment,
www.pediatrics.org/cgi/doi/10.1542/ peds.2008-1408
doi:10.1542/peds.2008-1408
Key Words
diagnosis, obesity, weight management, weight status, electronic medical records
Abbreviations
WCV—well-child visit EMR— electronic medical record ICD-9 —International Classification of Diseases, Ninth Revision
and lifestyle modifications for weight problems may have a greater likelihood of success in patients whose problems are addressed early in the disease process.23
Whereas many providers may visually assess the weight of a child, it is essential to document the diagnosis and to address these medical issues with the family, because parents often are unaware of their child’s condition.24
The last several years have witnessed increasing pub-licity about weight problems, although it is unclear how this focus has affected diagnosis of these conditions by clinicians. We aimed to determine the frequency of di-agnosis of pediatric weight problems between 1999 and 2007 and to examine temporal trends and patient factors associated with correct diagnosis.
METHODS
Study Design
This was a retrospective cohort study of patients aged 2 through 18 with at least 1 well-child visit (WCV) including a recorded height and weight between June 1999 and October 2007 within the MetroHealth System, a large ter-tiary academic health care system in northeast Ohio (N⫽
60 920 patients). Identification of WCVs was based on the American Medical Association’s Current Procedural Termi-nology Evaluation and Management codes.
Data Collection
The MetroHealth System has used the EpicCare (Epic Sys-tems Corporation, Madison, WI) electronic medical record (EMR) in outpatient clinics since 1999. Paper charts are not maintained. We used information gathered at visits includ-ing patients’ age, race/ethnicity, gender, weight, height, and family history of obesity or related conditions includ-ing diabetes, lipid disorder, hypertension, coronary artery disease, heart disease, and stroke. Height and weight mea-surements were taken by nurses or medically trained as-sistants by using standardized clinical procedures and med-ical scales/standiometers. These individuals did not receive specialized training for the collection of data for this study above that provided by their professional licensure and hospital orientation. These height and weight measure-ment methods conform to the normal standard of care for clinical pediatric practices.
Recorded heightsⱕ30.5 orⱖ213.4 cm or heights that decreased byⱖ5% from previous visits were considered to be entered erroneously. Similarly, weights ⱕ1.5 or
ⱖ300 kg or weights that increased by ⱖ50% from the previous year orⱖ100% from 2 years previously were not included. Similar criteria have been used previously25and
eliminated⬍1% of visits from our initial cohort.
Age- and gender-specific percentiles for BMI were determined by using the most recent growth charts from the Centers for Disease Control and Prevention.26
Over-weight was defined as a BMI of ⱖ85th percentile but
⬍95th percentile, and obesity was defined as a BMI of
ⱖ95th percentile or 30 kg/m2. Severe obesity was con-sidered as a subset of obese patients and was defined as a BMI at ⱖ99th percentile, consistent with established guidelines.27
To determine the frequency of diagnosis, we obtained
International Classification of Diseases, Ninth Revision
(ICD-9) codes entered for past medical history, visit di-agnoses, and problem lists for all patient visits, including non-WCVs. ICD-9 codes included were obesity, not oth-erwise specified (278.00), morbid obesity (278.01), dys-metabolic syndrome (277.7), overweight (278.02), and weight gain, abnormal (783.1). To assess whether pro-viders noted weight problems without entering ICD-9 codes, a manual review of the EMR was conducted for a random sample of 1% of the patients identified as un-diagnosed using ICD-9 codes. In this review, the pro-vider was considered to have made a “diagnosis” if the assessment/plan mentioned weight, diet change, or ex-ercise; if a referral for a nutritionist or pediatric obesity specialist was present; or if orders for laboratory testing for glucose levels, liver function tests, or lipid panels were ordered with no other identifiable reason.
Statistical Analysis
For the analysis, children were classified as overweight if they had at least 1 overweight visit during the study period (BMI ofⱖ85th percentile but⬍95th percentile) but no visits qualifying as obese. Children were classified as obese if they had at least 1 obese visit (BMI ofⱖ95th percentile orⱖ30 kg/m2), and children were classified as severely obese if they had at least 1 severely obese visit (BMI of ⱖ99th percentile). Children classified as se-verely obese were considered as a subset of the obese population; they were included in the obese category but also analyzed as a separate group, because severe obesity is a recently suggested weight classification.27
We first examined characteristics of the total study population and of patients in specific BMI categories. We then calculated the percentage of patients in each of the 3 BMI categories (overweight, obese, and severely obese as outlined above) who were diagnosed during the en-tire study period. A patient was considered to have re-ceived a diagnosis if relevant ICD-9 codes were entered at any point during the study period, regardless of the number of visits in which the weight problem was undi-agnosed. Logistic regression was used to compute odds ratios and 95% confidence intervals (CIs) for associations between patient characteristics and diagnosis within each of 3 BMI categories. Factors in the multivariate models included BMI and height percentiles, age, family history, gender, ethnicity, and number of overweight visits. For factors that changed over the study period (eg, age), infor-mation from the first overweight or obese visit was used. For family history, only information collected before the first overweight or obese visit was used.
To examine temporal trends, the percentage of patients diagnosed within each year from 1999 –2007 among those with no previous diagnosis in the EMR was calculated. Generalized estimating equations for logistic regression with the autoregressive correlation structure were used to examine the association between year and diagnosis, ac-counting for demographic changes in the population over time and repeated visits by the same patient.28
weight. Since January of 2004, BMIs have been dis-played in red in the EMR if they are ⱖ85th or ⱕ10th percentile. We also evaluated whether there was any change in the temporal trend for diagnosis before and after the introduction of this abnormal BMI “flag.” All statistical analyses were performed by using SAS 9.1.29
RESULTS
A total of 60 711 patients with 146 900 WCV (median visits per patient ⫽ 2) were included in the analysis. There were 25 382 (41.8%) patients who were over-weight or obese during the study period; of these, 11 277 (18.6%) were overweight and 14 105 (23.2%) were
obese. Within the obese category, 4670 patients (7.7% of all patients and 33.1% of obese patients) met criteria for being severely obese. Demographic characteristics of each group are listed in Table 1. Of the black children, 18.1% were overweight, 22.9% were obese, and 7.7% were severely obese. Of the white children, 19.4% were overweight, 22.7% were obese, and 7.2% were severely obese. Of the Hispanic children, 19.0% were over-weight, 27.3% were obese, and 10.0% were severely obese. Hispanic children demonstrated greater severity of overweight status and were more likely to be obese and severely obese than were black or white children.
Among all overweight and obese patients, 8659 (34.1%) were diagnosed with a relevant ICD-9 code during the study period. Of the 11 277 overweight pa-tients, 1071 (9.5%) were diagnosed as such. The per-centage of patients who had received a diagnosis was higher among obese and severely obese children (53.8% and 75.6%, respectively). Of children in each weight category who were eventually given a diagnosis, the percentage diagnosed at their first qualifying abnormal weight visit was 31.4% if they were overweight and 66.9% and 88.8% if they were obese or severely obese. Overall, 76.5% of diagnoses were made with the ICD-9 code 287.00 (obesity, not otherwise specified). The codes 783.1 (weight gain, abnormal), 278.01 (mor-bid obesity), 278.02 (overweight), and 277.7 (dysmeta-bolic syndrome) were used 13.7%, 7.5%, 2.2%, 1.3%, and ⬍1% of the time, respectively. These percentages were similar in each BMI category, with the exception of the code for morbid obesity being more common among patients classified as severely obese (12.2% of diagnoses) and less common among patients classified as over-weight (1.3% of diagnoses), and the code for over-weight gain, with abnormal being more common among pa-tients classified as overweight (20.1% of diagnoses) and
TABLE 1 Descriptive Characteristics of All Patients in the Study Population and Specific Abnormal BMI Categories
All Patients
Overweight Patientsa
Obese Patientsb
Severely Obese Patientsc
No. of patients 60 711 11 277 14 105 4670
Mean age (SD), y 8.5 (4.7) 9.2 (4.7) 9.7 (4.5) 9.1 (4.6) No. of overweight visits (SD) NA 1.5 (0.9) 1.9 (1.3) 1.8 (1.2) Mean weight, % (SD) 64.6 (29.1) 83.5 (13.4) 96.3 (6.2) 98.9 (4.9) Mean height, % (SD) 56.9 (29.4) 57.7 (28.7) 67.5 (27.6) 72.5 (26.7) Mean BMI, % (SD) 64.9 (29.4) 90.0 (2.9) 98.0 (1.4) 99.5 (0.3)
Female gender, % 49.9 51.7 49.8 44.8
Black, % 47.3 46.1 46.6 47.4
Hispanic, % 13.7 14.0 16.0 17.7
White, % 32.9 34.3 32.1 30.8
Other races/ethnicities, %d 6.1 5.6 5.3 4.1
NA indicates not applicable.
aOverweight was defined as a patient with a BMI ofⱖ85th percentile with no visits with a BMI ofⱖ95th percentile.
bObese was defined as a patient with a BMI ofⱖ95th percentile.
cSeverely obese was defined as a patient with a BMI ofⱖ99th percentile. Patients defined as being severely obese are also included in the obese category.
dIncluding Asian American/Pacific Islander, American Indian/Eskimo, Multi-racial, other, and unknown.
TABLE 2 Associations of Patient Characteristics With Diagnosis in Abnormal BMI Categories
Abnormal BMI Categories, Multivariate Odds Ratio (95% CI)
Overall Weight Problems (N⫽25 382, 8659
Diagnosed)a
Overweight Patients (N⫽11 277, 1071
Diagnosed)b
Obese Patients (N⫽14 105, 7588 Diagnosed)c
Severely Obese Patients (N⫽4670, 3532
Diagnosed)a
Clinical features
No. of abnormal weight visits (per each additional visit)
1.7 (1.7–1.8) 1.4 (1.3–1.5) 1.8 (1.8–1.9) 2.0 (1.8–2.2)
Obesity-related family history 1.3 (1.1–1.4) 1.4 (1.1–1.8) 1.2 (1.0–1.5) 1.1 (0.8–1.5)
Anthropomorphic features
Increasing BMI % (per 1% increase) 1.4 (1.4–1.4) 1.4 (1.1–1.6) 1.7 (1.6–1.7) 2.3 (1.7–3.0) Increasing height % (per 10% increase) 1.2 (1.1–1.3) 0.8 (0.7–0.9) 1.3 (1.2–1.5) 1.2 (1.1–1.3) Demographic features
Black raced 1.4 (1.3–1.5) 1.3 (1.1–1.5) 1.5 (1.4–1.6) 1.5 (1.2–1.7)
Hispanic ethnicityd 1.7 (1.6–1.9) 1.7 (1.4–2.1) 1.7 (1.5–1.9) 1.5 (1.2–1.8)
Female gender 1.6 (1.5–1.7) 1.6 (1.4–1.9) 1.7 (1.6–1.8) 2.0 (1.7–2.4)
Increasing age (per year) 1.4 (1.3–1.5) 1.1(1.1–1.1) 1.2 (1.2–1.2) 1.2 (1.2–1.3)
aOverall weight problems were defined as a patient with a recorded BMI ofⱖ85th percentile. This consists of those patients in the overweight and obese category. bOverweight was defined as a patient with a BMI ofⱖ85th percentile with no visits with a BMI ofⱖ95th percentile.
cObese was defined as a patient with a BMI ofⱖ95th percentile; severely obese was defined as a patient with a BMI ofⱖ99th percentile. Patients defined as being severely obese are also included in the obese category.
less common among patients classified as obese and severely obese (8.3% and 8.0%, respectively).
Several patient characteristics were associated with cor-rect diagnosis (Table 2). The number of overweight visits, documented obesity-related family history, and increasing BMI percentile each increased the likelihood of diagnosis. Black and Hispanic patients were more likely to be given a diagnosis than white patients. Female patients were more likely to be given a diagnosis than male patients, and older children were more likely to be given a diagnosis than younger children. The associations between diagnosis and gender, increasing age, BMI percentile, and number of overweight visits were stronger in the obese and severely obese categories, whereas family history was a stronger predictor among patients classified as overweight.
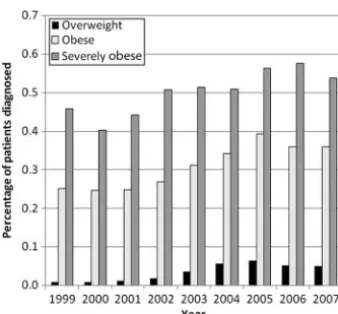
There was a statistically significant trend toward increas-ing diagnosis over the study period (P⬍.001), although the percentage of patients who were diagnosed per year seemed to plateau or decrease after 2005 (see Fig 1). The percentage of all abnormal-weight patients who were
given a diagnosis increased from 13.0% in 1999 to 21.6% in 2005 but subsequently decreased to 18.5% in 2007. The percentage of patients who were given a diagnosis in the overweight category was 1.3% in 1999, increased to 6.0% in 2005, and decreased to 4.8% in 2007. In the obese category, the percentage of patients who were diagnosed rose from 25.1% in 1999 to 39.3% in 2005 and decreased to 35.9% in 2007. Severely obese diagnosis rates began at 45.7%, rose to 57.5% in 2006, and fell to 53.7% in 2007. The temporal pattern was similar when using percentages that only included patients at their first overweight or obese visit (data not shown). When adjusted for age, gen-der, race/ethnicity, and BMI percentile, there was a statis-tically significant trend toward increasing diagnosis from 1999 to 2007 in the overweight, obese, and severely obese categories (P⬍ .001). However, when the adjusted per-centage change in diagnosis was computed for each year compared with the previous year (Table 3), there was no significant increase in the percentage of patients who were diagnosed after 2005, and there was suggestion of a de-crease in diagnosis in 2006 and 2007. Moreover, there was no evidence of a greater increase in diagnosis for the years after the introduction of the abnormal BMI flag (2004 – 2007) than for the years before this introduction (1999 – 2003).
Among undiagnosed patients whose EMRs were re-viewed manually (n ⫽195), 10.8% of overweight pa-tients, 38.2% of obese papa-tients, and 40.0% of severely obese patients had documentation of a diagnosis outside of the ICD-9 codes. If extrapolated to the entire study population, these additional “diagnoses” increase the percentage of overweight children who were given a diagnosis to 19.2% and the percentages of obese and severely obese children who were given a diagnosis to 71.5% and 85.4%, respectively.
DISCUSSION
Pediatric overweight/obesity is a growing epidemic among America’s youth. Previous survey results have demonstrated that pediatric providers are concerned with weight issues, and 73% to 88% often make
recom-FIGURE 1
Percentage of patients diagnosed within each year from 1999 to 2007 among those with no previous diagnosis. Overweight is defined as a patient with a BMI ofⱖ85th percentile with no visits with a BMI ofⱖ95th percentile. Obese is defined as a patient with a BMI of
ⱖ95th percentile. Severely obese is defined as a patient with a BMI ofⱖ99th percentile. Patients defined as severely obese are also included in the obese category.
TABLE 3 Diagnosis for Each Year Compared to Previous Year
Year Diagnosis, Adjusted Percent Change (95% CI)
Overall Weight Problemsc
Overweight Patientsc
Obese Patientsc Severely Obese
Patientsc
2000a ⫺5 (⫺27 to 23) ⫺13 (⫺76 to 213) ⫺66 (⫺86 to⫺76) ⫺26 (⫺52 to 13)
2001a ⫺7 (⫺20 to 8) 28 (⫺38 to 167) ⫺9 (⫺23 to 7) 3 (⫺21 to 36)
2002a 22 (7 to 38) 64 (⫺3 to 175) 24 (8 to 43) 60 (26 to 102)
2003a 33 (19 to 48) 94 (37 to 174) 31 (17 to 48) 5 (⫺15 to 29)
2004a 29 (16 to 43) 67 (31 to 164) 23 (10 to 38) 0 (⫺19 to 23)
2005a 33 (20 to 47) 16 (⫺6 to 43) 42 (26 to 59) 40 (22 to 74)
2006a ⫺15 (⫺25 to⫺8) ⫺22 (⫺37 to⫺2) ⫺16 (⫺25 to⫺5) 3 (⫺18 to 28)
2007a ⫺2 (⫺12 to 9) ⫺4 (⫺24 to 21) ⫺5 (⫺16 to 8) ⫺23 (⫺39 to⫺2)
1999–2007b 15 (13 to 16) 23 (19 to 26) 15 (14 to 17) 12 (9 to 15) aPercent change is given compared to the previous year and was adjusted for age, gender, BMI percentile, and race.
bOverall percent change per year from 1999 to 2007 adjusted for age, gender, BMI percentile, and race.
mendations for weight control.30 Nonetheless, the
per-centage of children with abnormal weight who are di-agnosed as such has been reported between 21% and 86%,18–22 and survey results have demonstrated that
only 7% of pediatricians follow recommended evalua-tions for all comorbid condievalua-tions.31 Our study
demon-strates a continued low percentage of diagnosis of pedi-atric weight problems, lowest among overweight children in whom intervention may be most beneficial.23
Further-more, we reveal that the percentage of patients who were given a diagnosis is no longer increasing at an appreciable rate. To our knowledge, we used the largest clinical cohort to date to report the underdiagnosis of pediatric over-weight/obesity, and this is the first study to report temporal trends in this diagnosis.
We found that among the population sampled, 41.8% had a BMI ofⱖ85th percentile during the study period. Although this is higher than the 33.6% presented on the basis of National Health and Nutrition Examination Sur-vey data for 2003–2004,1 we define this percentage as
patients who had an elevated BMI at any time during a 7-year period, whereas the National Health and Nutri-tion ExaminaNutri-tion Survey data present a prevalence at a single visit. Our higher percentage is also partially ex-plained by the increasing prevalence of obesity among youth (prevalence increased 3.6% from 2001 to 2002 vs 2003 to 20041).
The percentage of patients whose condition was di-agnosed within each year increased over the study pe-riod until 2005, possibly because of increasing public and professional focus on obesity. However, our results also suggest that the trend of increasing diagnosis has pla-teaued or even decreased in recent years, implying that the impact of publicity regarding weight problems may be reaching its peak. This is consistent with a previous study that indicated that the percentage of adult visits containing weight-control counseling declined between 1995 and 2004.32 Our findings also suggest that
auto-matic flagging of abnormal BMIs is insufficient to pro-vide long-term increases in diagnosis rates. These results point to the need for more active clinical decision-sup-port approaches and strategies to aid in the diagnosis of pediatric weight problems.
The view that overweight and obesity are not true diseases is a historic barrier to diagnosis. It was not until 2004 that the phrase “Obesity itself cannot be considered an illness” was removed from Medicare payment regu-lations.33The remnants of this view are demonstrated by
the lack of reimbursement for care of weight problems that persists today. Along with lack of reimbursement, other reasons for the underdiagnosis of pediatric weight problems include limited time and perceived futility of involvement because of parental or patient lack of mo-tivation.34,35Many primary care providers may feel that
because time in visits is limited, discussion should be directed toward problems for which intervention is more fruitful. In 1 survey study, primary care providers re-ported treating obesity themselves only ⬃50% of the time.36In addition, practitioners see obesity as less
im-portant than other health risks. Pediatricians rank
over-weight and obesity as less important than smoking, drugs, alcohol, and risky sexual behavior.34
Factors positively influencing diagnosis in our study included increasing BMI and age, female gender, obesity-related family history, black race, and Hispanic ethnicity. These factors are important, because older and heavier patients are more likely to remain obese into adoles-cence and adulthood.37The positive association of black
race, Hispanic ethnicity, and female gender with diag-nosis may reflect providers’ belief that obesity is more prevalent among these populations.2
Our study has several limitations. Our population represents a single health care system, and although our sample size is large, our population may not be repre-sentative of other regions. There are some characteristics of the patients, including socioeconomic status and in-surance company, that we did not investigate. We relied largely on ICD-9 codes. Although there was a sizeable increase in the diagnosis rate when a manual chart re-view of 1% of the charts was used to incorporate non– ICD-9 code diagnoses, the diagnosis rate for children classified as overweight remained very low, demonstrat-ing that overweight in children is greatly underdiag-nosed even when non–ICD-9 code diagnoses are consid-ered. Although the use of ICD-9 codes has its shortcomings, as EMRs take a central role in medical care, it can be argued that documentation in ICD-9 format is essential to the diagnosis and management of a chronic problem such as obesity, both for billing and documentation purposes.
Other factors in our analysis may overestimate diagno-sis. We evaluated BMI percentiles only at WCVs because these encounters lend themselves toward diagnosis of seemingly asymptomatic diseases such a weight problems. Also, height and weight measures are routinely measured at WCVs but may not be at other visits. However, to pro-vide the most inclusive diagnosis percentages possible, di-agnosis codes were gathered from all visits, meaning that diagnoses at non-WCVs are included. Also, for overall di-agnosis calculations, patients were counted as having been given a diagnosis if a diagnosis was made at any point regardless of the number of previous overweight/obese visits in which no diagnosis was made.
CONCLUSIONS
As with any chronic disease, early diagnosis of overweight and obesity is likely to be an important step toward reduc-ing morbidity, mortality, and health care costs. Within the health care system, diagnosis of these seemingly asymp-tomatic diseases rests with primary care providers. This study demonstrates that many primary care opportunities for diagnosis are missed. Primary care practitioners should be encouraged to take a stronger role in the identification and treatment of obesity and overweight.
As the role of EMRs grows, automated mechanisms to enhance diagnosis of pediatric obesity may become more elaborate. Methods such as automatic electronic alerts sent to providers or to families about a child’s weight status and automatic referrals to specific pediatric weight-management programs may prove effective. Ad-ditions such as patient information concerning weight status automatically provided to overweight children may also raise patient and parental awareness.
REFERENCES
1. Ogden CL, Carroll MD, Curtin LR, McDowell MA, Tabak CJ, Flegal KM. Prevalence of overweight and obesity in the United States, 1999 –2004.JAMA.2006;295(13):1549 –1555
2. Strauss RS, Pollack HA. Epidemic increase in childhood over-weight, 1986 –1998.JAMA.2001;286(22):2845–2848 3. Bundred P, Kitchiner D, Buchan I. Prevalence of overweight
and obese children between 1989 and 1998: population based series of cross sectional studies.BMJ.2001;322(7282):326 –328 4. Cook NR, Gillman MW, Rosner BA, Taylor JO, Hennekens CH. Prediction of young adult blood pressure from childhood blood pressure, height, and weight. J Clin Epidemiol. 1997;50(5): 571–579
5. Moore WE, Stephens A, Wilson T, Wilson W, Eichner JE. Body mass index and blood pressure screening in a rural public school system: the Healthy Kids Project.Prev Chronic Dis.2006; 3(4):A114
6. Sorof JM, Lai D, Turner J, Poffenbarger T, Portman RJ. Over-weight, ethnicity, and the prevalence of hypertension in school-aged children.Pediatrics.2004;113(3 pt 1):475– 482 7. Berenson GS, Srinivasan SR, Bao W, Newman WP 3rd, Tracy
RE, Wattigney WA. Association between multiple cardiovas-cular risk factors and atherosclerosis in children and young adults. The Bogalusa Heart Study.N Engl J Med.1998;338(23): 1650 –1656
8. Malcolm DD, Burns TL, Mahoney LT, Lauer RM. Factors af-fecting left ventricular mass in childhood: the Muscatine Study.
Pediatrics.1993;92(5):703–709
9. Hanevold C, Waller J, Daniels S, Portman R, Sorof J. The effects of obesity, gender, and ethnic group on left ventricular hyper-trophy and geometry in hypertensive children: a collaborative study of the International Pediatric Hypertension Association.
Pediatrics.2004;113(2):328 –333
10. Redline S, Tishler PV, Schluchter M, Aylor J, Clark K, Graham G. Risk factors for sleep-disordered breathing in children: as-sociations with obesity, race, and respiratory problems.Am J Respir Crit Care Med.1999;159(5 pt 1):1527–1532
11. Ford ES. The epidemiology of obesity and asthma.J Allergy Clin Immunol.2005;115(5):897–909
12. Michelmore KF, Balen AH, Dunger DB, Vessey MP. Polycystic ovaries and associated clinical and biochemical features in young women.Clin Endocrinol.1999;51(6):779 –786
13. Sorof J, Daniels S. Obesity hypertension in children: a problem of epidemic proportions.Hypertension.2002;40(4):441– 447 14. Hampel H, Abraham NS, El-Serag HB. Meta-analysis: obesity
and the risk for gastroesophageal reflux disease and its com-plications.Ann Intern Med.2005;143(3):199 –211
15. Fishman L, Lenders C, Fortunato C, Noonan C, Nurko S. Increased prevalence of constipation and fecal soiling in a population of obese children.J Pediatr.2004;145(2):253–254 16. Taylor ED, Theim KR, Mirch MC, et al. Orthopedic
complica-tions of overweight in children and adolescents. Pediatrics.
2006;117(6):2167–2174
17. Gunnell DJ, Frankel SJ, Nanchahal K, Peters TJ, Davey Smith G. Childhood obesity and adult cardiovascular mortality: a
57-y follow-up study based on the Boyd Orr cohort.Am J Clin Nutr.1998;67(6):1111–1118
18. O’Brien SH, Holubkov R, Reis EC. Identification, evaluation, and management of obesity in an academic primary care cen-ter.Pediatrics.2004;114(2). Available at: www.pediatrics.org/ cgi/content/full/114/2/e154
19. Dorsey KB, Wells C, Krumholz HM, Concato JC. Diagnosis, evaluation, and treatment of childhood obesity in pediatric practice.Arch Pediatr Adolesc Med.2005;159(7):632– 638 20. Barlow SE, Bobra SR, Elliott MB, Brownson RC, Haire-Joshu
D. Recognition of childhood overweight during health super-vision visits: does BMI help pediatricians?Obesity (Silver Spring).
2007;15(1):225–232
21. Riley MR, Bass NM, Rosenthal P, Merriman RB. Underdiagno-sis of pediatric obesity and underscreening for fatty liver dis-ease and metabolic syndrome by pediatricians and pediatric subspecialists.J Pediatr.2005;147(6):839 – 842
22. Hampl SE, Carroll CA, Simon SD, Sharma V. Resource utiliza-tion and expenditures for overweight and obese children.Arch Pediatr Adolesc Med.2007;161(1):11–14
23. Davis K, Christoffel KK. Obesity in preschool and school-age children: treatment early and often may be best.Arch Pediatr Adolesc Med.1994;148(12):1257–1261
24. He M, Evans A. Are parents aware that their children are overweight or obese? Do they care?Can Fam Physician.2007; 53(9):1493–1499
25. Hansen ML, Gunn PW, Kaelber DC. Underdiagnosis of hyper-tension in children and adolescents. JAMA. 2007;298(8): 874 – 879
26. National Center for Health Statistics. CDC growth charts: United States. Available at: www.cdc.gov/growthcharts. Ac-cessed December 7, 2007
27. Barlow SE; Expert Committee. Expert committee recommen-dations regarding the prevention, assessment, and treatment of child and adolescent overweight and obesity: summary report.
Pediatrics.2007;120 (suppl 4):S164 –S192
28. Twisk J. Applied Longitudinal Data Analysis for Epidemiology: A Practical Guide. Cambridge, United Kingdom: Cambridge Uni-versity Press; 2003
29. SAS System for Windows [computer program]. Version 9.13. Cary, NC: SAS Institute Inc; 2006
30. Barlow SE, Trowbridge FL, Klish WJ, Dietz WH. Treatment of child and adolescent obesity: reports from pediatricians, pedi-atric nurse practitioners, and registered dietitians. Pediatrics.
2002;110(1):229 –235
31. Barlow SE, Dietz WH, Klish WJ, Trowbridge FL. Medical eval-uation of overweight children and adolescents: reports from pediatricians, pediatric nurse practitioners, and registered die-titians.Pediatrics.2002;110(1):222–228
32. McAlpine DD, Wilson AR. Trends in obesity-related counseling in primary care: 1995–2004.Med Care.2007;45(4):322–329 33. Stern JS, Kazaks A, Downey M. Future and implications of
reimbursement for obesity treatment.J Am Diet Assoc. 2005; 105(5 suppl 1):S104 –S109
34. Jelalian E, Boergers J, Alday CS, Frank R. Survey of physician attitudes and practices related to pediatric obesity.Clin Pediatr (Phila).2003;42(3):235–245
35. Story MT, Neumark-Stzainer DR, Sherwood NE, et al. Man-agement of child and adolescent obesity: attitudes, barriers, skills, and training needs among health care professionals.
Pediatrics.2002;110(1 pt 2):210 –214
36. Kristeller JL, Hoerr RA. Physician attitudes toward managing obesity: differences among six specialty groups.Prev Med.1997; 26(4):542–549
DOI: 10.1542/peds.2008-1408
2009;123;e153
Pediatrics
Lacey Benson, Heather J. Baer and David C. Kaelber
2007
−
1999
Trends in the Diagnosis of Overweight and Obesity in Children and Adolescents:
Services
Updated Information &
http://pediatrics.aappublications.org/content/123/1/e153
including high resolution figures, can be found at:
References
http://pediatrics.aappublications.org/content/123/1/e153#BIBL
This article cites 33 articles, 10 of which you can access for free at:
Subspecialty Collections
http://www.aappublications.org/cgi/collection/obesity_new_sub
Obesity
http://www.aappublications.org/cgi/collection/endocrinology_sub
Endocrinology
following collection(s):
This article, along with others on similar topics, appears in the
Permissions & Licensing
http://www.aappublications.org/site/misc/Permissions.xhtml
in its entirety can be found online at:
Information about reproducing this article in parts (figures, tables) or
Reprints
http://www.aappublications.org/site/misc/reprints.xhtml
DOI: 10.1542/peds.2008-1408
2009;123;e153
Pediatrics
Lacey Benson, Heather J. Baer and David C. Kaelber
2007
−
1999
Trends in the Diagnosis of Overweight and Obesity in Children and Adolescents:
http://pediatrics.aappublications.org/content/123/1/e153
located on the World Wide Web at:
The online version of this article, along with updated information and services, is
by the American Academy of Pediatrics. All rights reserved. Print ISSN: 1073-0397.