GENERAL PEDIATRIC RESEARCH
Black and White Middle Class Children Who Have Private Health
Insurance in the United States
Michael Weitzman, MD*; Robert S. Byrd, MD, MPH‡; and Peggy Auinger, MS*
ABSTRACT. Objective. To compare the health, be-havior and school problems, and use of medical, mental health, and special education services of privately in-sured, middle class black and white children in the United States.
Design/Methods. Analyses of the Child Health Sup-plement to the 1988 National Health Interview Survey, with a nationally representative sample of 17 110 chil-dren age 0 –17 years.
Results. Privately insured middle class black chil-dren had fewer chronic health conditions, but were less likely to be reported to be in excellent health (46.2% vs 57.3%) and more likely to have had asthma (8.5% vs 5.8%) or to have been of low birth weight (10.7% vs 5.6%). There were no differences in rates of having a usual source of routine care (92.2% vs 93.8%) or of being up to date with well-child care (79.3% vs 78.2%), but black children made fewer physician visits, were less likely to use physicians’ offices, were more likely to lack continuity of care, and were twice as likely to use emer-gency departments. These differences in use of medical services persisted in multivariate analyses and analyses restricted to more affluent children. Despite similar rates of behavior problems, black children were more likely to repeat a grade (20.0% vs 12.3%) and to have been suspended from school (11.3% vs 5.0%). Although significantly fewer black middle class children received mental health or special education services in bivariate analyses, no differences in receipt of these services were noted in multivariate analyses. All differences reported were significant.
Conclusions. Among middle class children in the United States, black and white children have similar rates of health and behavior problems, but black chil-dren experience substantially increased rates of asthma, low birth weight, and school difficulties. Al-though not differing in the receipt of mental health or special education services, middle class black chil-dren, even in the presence of private health insurance, have markedly different sources and patterns of use of medical services.Pediatrics1999;104:151–157;black and white children, middle class, private health in-surance.
ABBREVIATION. BPI, Behavior Problem Index.
S
ubstantial time and resources have been
de-voted to identifying, attempting to
under-stand the causal mechanisms behind, and
rectifying racial disparities in health in the United
States.
1–10Much of our understanding of racial
dif-ferences in children’s health and access to health
services has been hindered by black race being
confounded and often confused with low
socioeco-nomic status,
4,9,11,12and we often fail to recognize
that
.
50% of all black children in the United States
do not live in poverty.
In contrast to the extensive literature comparing
the health and use of health services of poor and
nonpoor children
13–18or of uninsured and insured
children,
19virtually no literature has focused on
these issues for middle class black and white
chil-dren. The objectives of this study were to
investi-gate and compare the health, behavior and school
problems, sources of ambulatory care for, and use
of medical, mental health, and special education
services of middle class black and white children
with private health insurance in the United States.
These children were the focus because private
in-surance is the primary means of financing health
care for children in this country,
20and we wished
to examine the health and patterns of service use
among children for whom there are no, or minimal,
financial barriers to care.
METHODS
Data were from the Child Health Supplement to the 1988 National Health Interview Survey. This is a cross-sectional, ran-domized household survey conducted by the Bureau of the Census for the National Center for Health Statistics.21,22In se-lected years, the most recent being 1988, a Child Health Sup-plement is added to obtain detailed information about the health of and use of health services by the nation’s children. Informa-tion was obtained by face-to-face interviews with adult family members on 1 randomly chosen child per household surveyed, resulting in a sample of 17 110 children 0 to 17 years of age, representative of all noninstitutionalized children and youth in the United States in 1988.
The Census Bureau does not have an official definition of the “middle class,” but it does rank households from lowest to highest based on income and then divides them into equal population groups, typically quintiles. The lowest quintile often is used as a proxy measure of those in poverty and the highest quintile as those who are most affluent.23For the purposes of these analyses, children were categorized as being middle class if their families’ reported income was in the second, third, or fourth quintile. In 1988, family incomes in the second quintile
From the *Department of Pediatrics, University of Rochester School of Medicine and Dentistry, Rochester, New York, and the ‡Department of Pediatrics, University of California School of Medicine at Davis, Davis, California.
This work was presented in part at the 37th Annual Meeting of the Ambulatory Pediatric Association; May 1997; Washington, DC. Received for publication Dec 26, 1998; accepted Feb 4, 1999.
Address correspondence to Michael Weitzman, MD, Department of Pedi-atrics, Rochester General Hospital, 1425 Portland Ave, Rochester, NY 14621. E-mail: michael.weitzman@viahealth.org
ranged from $15 103 to $26 182, in the third quintile from $26 183 to $38 500, and in the fourth quintile from $38 501 to $55 906. Therefore, children in middle class families, as defined in these analyses, were in families whose incomes ranged from $15 103 to $55 906 in 1988. The comparable range in 1995 was $19 071 to $72 260. Because of concern that comparisons using children in families whose incomes are in the second through fourth quintiles might be biased because of the unequal distri-bution of black and white children across this income range, all bivariate analyses were repeated after analyses were restricted only to children in families whose incomes were in the third and fourth quintiles.
Children were categorized as being covered by private health insurance if the respondent answered yes to the question, “Is — now covered by a health insurance plan that pays any part of a hospital, doctor’s office or surgeon’s bill?” Although this ques-tion may be answered affirmatively by some children covered by Medicaid, such misclassification is likely to be minimized with the analyses limited to children whose family income is above the poverty level. Demographic and family characteristics, health status, behavior and school problems, and sources of ambulatory care and utilization of health services of privately insured, middle class black and white children and youth were compared, as presented below.
Demographic and Family Characteristics
Characteristics investigated included family income and size; region and degree of urbanization of residence24,25; maternal educational level and age at the time of child’s birth; single- or two-parent family; and index child’s age and gender. As is true of all other variables in this dataset, children’s race was based on parental report. Race and Hispanic ethnicity were asked sepa-rately. Hispanic children were not excluded from analyses, and racial comparisons in this study are likely to be less pronounced than in analyses confined to non-Hispanic children.
Health Status
The following aspects of children’s physical health were in-vestigated: parental rating of children’s overall health; the per-centage of children whose birth weights were low and very low (2500 and 1500 g, respectively) or who were reported as having asthma; the prevalence of chronic physical health conditions (ascertained from affirmative responses to a checklist of 76 childhood health conditions that respondents were asked whether the child had in the past 12 months— 68 of which were considered chronic, consistent with earlier work using the sur-vey)19,21,26,27; limitations of activities among children reported as having any of these chronic conditions; and the number of days spent in bed.
Behavior and School Problems
Extreme scores (top 10th percentile) on the 32-item Behavior Problem Index (BPI) developed by Zill for children 4 years of age and older and modeled after the Child Behavior Checklist of Achenbach and Edelbrock28,29were used to identify the percent of children who had behavior problems. This index has been used in several earlier studies,30 –35and extreme scores on it have been shown to correlate substantially with referrals to mental health professionals.30Whether the respondent believed that the child needed psychological help in the past year also was de-termined, as was whether the child had ever repeated a grade or been suspended from school.
Utilization of Medical, Mental Health, and Special Education Services
Sources of routine and sick care and whether the child uti-lized the same source for routine and sick care (continuity of routine and sick care) were assessed. Sources of care were cat-egorized as 1) physicians’ office (doctors’ offices, private clinics, and health maintenance organization/prepaid group plans); 2) outpatient clinics (hospital, school, and migrant clinics); 3) health centers (neighborhood and rural centers); and 4) emer-gency departments (hospital emeremer-gency departments and walk-in emergency care centers). Also investigated were the number of visits made to a physician, the number of hospital-izations in the past 12 months, and whether the child was up to
date for well-child care,19estimated by comparing the reported number of routine physician visits with age-specific guidelines established by the American Academy of Pediatrics.36Also as-sessed was whether the child had ever seen a psychiatrist or counselor or received special education services. No detailed information regarding the specific nature of special education services received was available, thus, it was not possible to determine whether parents were referring to educational coun-seling, tutoring, or other school-based support services, or to their children being placed in totally separate classes or educa-tional tracks.
Statistical Analyses
x2Tests were used to test for differences in weighted propor-tions. Logistic and linear regression modeling was conducted to investigate the independent association of children’s race and aspects of their physical health, behavior and school problems, sources of ambulatory care, and utilization of services.
All analyses were conducted on an IBM-compatible PC. PC SAS software was used for the initial analyses.37SUDAAN soft-ware was used to obtain precise confidence intervals, account-ing for the complex, two-stage survey design.38
RESULTS
Of the
;
64 million children in the United States
in 1988, 48.3% (4.3 million) of black and 67% (32.5
million) of white children lived in families whose
incomes were in the second, third, and fourth
quin-tiles of family incomes (
P
,
.001). Of these middle
class children, 75.9% of black and 85.3% of white
youth had private health insurance (
P
,
.001). All
subsequent results and all tabular presentations of
data refer to middle class children who were
re-ported to have had private health insurance.
Demographic and Family Characteristics
Among middle class children who had private
health insurance, black children were less affluent
and more likely to live in single-parent households
(31.3% vs 12.4%;
P
,
.001) of larger size (3.62 vs
3.34 family members per household;
P
5
.003) with
mothers whose age at their birth was
#
16 years
(3.6% vs 1.4%;
P
,
.01) (Table 1). Maternal
educa-tional status did not differ between groups.
Physical Health, Behavior, and School Problems
Black children were reported as having fewer
chronic health conditions, fewer days in bed
be-cause of illness, and comparable rates of limitations
of activity. However, they were less likely to be
reported to be in excellent health (46.2% vs 57.3%;
P
,
.001) (Table 2). They also were more likely to
have been born with a low birth weight (10.7% vs
5.6%;
P
,
.001) and to have asthma (8.5% vs 5.8%;
P
,
.01).
Whereas there were no differences in rates of
scoring in the top 10th percentile on the BPI or in
being perceived by parents as needing
psychologi-cal help in the past 12 months, black children were
almost twice as likely to have ever repeated any
grade (20.0% vs 12.3%;
P
,
.001), and they were
more than twice as likely to have ever been
sus-pended from school (11.3% vs 5.0%;
P
,
.001).
Utilization of Medical, Mental Health, and Special Education Services
were no differences in rates of being up to date with
well-child care or in the number of hospital
epi-sodes in the past 12 months, on every other
mea-sure, the two groups differed (Table 3). Black
chil-dren lacked a source for sick care (6.6% vs 3.8%;
P
,
.01) or continuity of routine and sick care more
frequently (13.8% vs 7.5%;
P
,
.001), used a
phy-sician’s office for routine (79.4% vs 92.8%;
P
,
.001) or sick care (81.8% vs 92.0%;
P
,
.001) less
frequently, and were more than twice as likely to
have used emergency departments for sick care
(5.4% vs 2.4%;
P
,
.01). They also made fewer
ambulatory care visits, were less likely to receive
mental health services (3.6% vs 5.8%;
P
,
.05), and
among children who repeated a grade or were
sus-pended from school, they were substantially less
likely to have received special education (11.8% vs
18.8%;
P
,
.05) or mental health services (4.0% vs
13.2%;
P
,
.001).
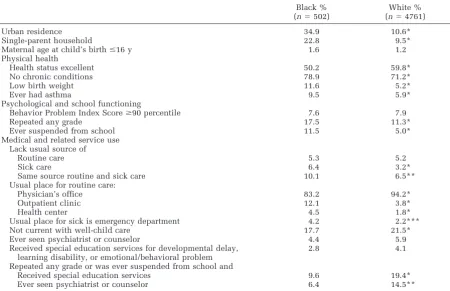
Children Whose Family Incomes Were in the Third and Fourth Quintiles
Analyses restricted to children whose family
in-comes were in the third and fourth quintiles
re-vealed findings similar to those from analyses that
also included children of less affluent families
hav-ing incomes in the second quintile. Although the
findings in the more restricted and smaller sample
did not reach statistical significance for some
mea-sures, the trend remained similar to that found in
the larger middle class sample. For example, black
children still were more likely to lack the same
source of care for routine and sick care (10.1% vs
6.5%;
P
5
.06), more likely to use emergency
de-partments as their source of sick care (4.2% vs
2.2%;
P
5
.07); and less likely to receive mental
health (4.4% vs 5.9%;
P
5
.22) or special education
services (2.8% vs 4.1%;
P
5
.13). Among children
who experienced educational difficulties, black
TABLE 1. Demographic and Family Characteristics of Black and White Middle Class Children and Youth with Private Health Insurance in the United States, Child Health Supplement to the 1988 National Health Interview Survey (N58381)
Black % (n5979)
White % (n57402)
P
Family income
Second quintile 39.3 26.3 ,.001
Third quintile 36.3 44.3 ,.001
Fourth quintile 13.8 20.5 ,.001
Middle class, quintile unknown* 10.5 8.9 NS Region
Northeast 15.4 20.2 ,.05
Midwest 18.0 30.6 ,.001
South 58.5 30.4 ,.001
West 8.1 18.8 ,.001
Degree of urbanization
Urban 34.4 10.4 ,.001
Suburban 16.8 25.5 ,.001
Other 48.9 64.1 ,.01
Maternal education
,High school 13.1 11.6 .28
High school 47.9 48.3 .87
.High school 39.0 40.1 .61
Household composition
Single parent 31.3 12.4 ,.001
Two parents 68.7 87.6 ,.001
Maternal age at child’s birth
#16 y 3.6 1.4 ,.01
.16 y 96.4 98.6 ,.01
* Family reported that income was$$20 000, but failed to give exact amount.
TABLE 2. Physical Health and Behavior and School Problems of Black and White Middle Class Children and Youth with Private Health Insurance in the United States, Child Health Supplement to the 1988 National Health Interview Survey (N58381)
Black % (n5979) White % (n57402) P
Physical health Health status
Excellent 46.2 57.3 ,.001
Very good or good 51.3 41.0 ,.001
Fair or poor 2.5 1.7 .30
Low birth weight (,2500 g) 10.7 5.6 ,.001
Very low birth weight (,1500 g) 1.4 0.6 .08
Ever had frequent ear infections 16.9 27.9 ,.001
Ever had asthma 8.5 5.8 .01
Chronic health conditions
None 80.8 71.5 ,.001
1 16.1 21.9 .001
2 2.0 4.8 ,.001
.2 1.0 1.8 .07
Chronic health condition and limitations of activity
Major activity limited 4.5 5.1 .45
School activity limited 5.1 6.1 .19
Days in bed in last 12 mo
0 63.3 44.1 ,.001
1–5 28.5 41.9 ,.001
6–10 5.7 8.6 .002
11–20 1.6 3.8 ,.001
.20 0.8 1.6 .02
Household member currently a smoker 41.9 39.2 .29
Household members smoked since child born 49.7 49.8 .95
Psychological and school functioning
Behavior Problem Index score$90 percentile 7.5 8.3 .51
Felt to need psychological help in the past 12 mo 1.8 1.7 .88
Repeated any grade 20.0 12.3 ,.001
children in these quintiles also were less likely to
receive both special education (9.6% vs 19.4%;
P
,
.05) and mental health (6.4% vs 14.5%;
P
,
.06)
services.
Multivariate Analyses
Table 5 demonstrates adjusted ORs for selected
measures of health, behavior and school problems,
and sources of care and use of services, controlling
for family income and size, source of routine care,
region, urbanization, gender, single- vs two-parent
household, and maternal age at child’s birth. Black
children in these quintiles still were less likely to
be reported as being in excellent health (OR: 0.7,
95% CI: 0.6 – 0.8), and they still were more likely to
have been born with a low birth weight (OR: 1.9,
95% CI: 1.3–2.8) and to have asthma (OR: 1.4, 95%
CI: 1.01–2.0;
P
,
.05). Black children also remained
at increased risk for having ever been suspended
from school (OR: 2.2, 95% CI: 1.5–3.3) and tended
to have higher rates of repeating a grade (OR: 1.4,
95% CI: 0.98 –1.9;
P
5
.07) in adjusted analyses.
In multivariate analyses, race no longer was
as-sociated with disparities in lack of a usual source of
sick care, but black children still were more likely
to lack continuity of routine and sick care. The
likelihood of black children overall ever having
received mental health or special education
ser-vices, although still less than that of white
chil-dren, was now of marginal statistical significance.
Similarly, among children who had ever repeated a
grade or had ever been suspended from school,
although no longer statistically significant, the
trend was still for black children to be less likely to
have received special education services or to have
seen a psychiatrist or counselor. Black children
still were found to use physicians’ offices for
rou-tine care half as often (OR: 0.4, 95% CI: 0.3– 0.5)
and emergency departments for sick care three
times as often as white children (OR: 3.2, 95% CI:
1.7–5.8). Not shown are data from a linear
regres-sion model indicating that black children still had
fewer physician visits than did white children (
P
,
.001).
DISCUSSION
This study differs from other studies of
chil-dren’s health and use of health services in that it
focuses on middle class black and white children
who have private health insurance. Black and
white children were found to have comparable
rates of being up to date with well-child care. In
contrast, they differed substantially on many
mea-sures of utilization of services, and most of these
differences persisted in multivariate analyses and
analyses restricted to more economically privileged
middle class children, as well as across the entire
middle class income range. Black children were
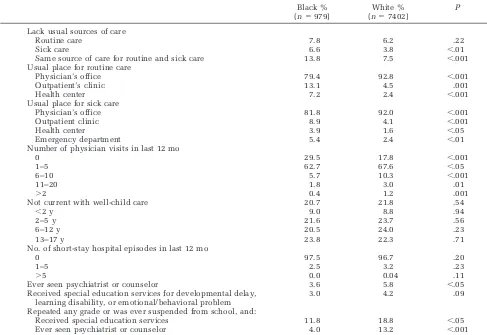
TABLE 3. Comparison of Sources of Care and Use of Medical, Mental Health, and Special Education Services by Black and White Middle Class Children and Youth with Private Insurance in the United States, Child Health Supplement to the 1988 National Health Interview Survey (N58381)
Black % (n5979)
White % (n57402)
P
Lack usual sources of care
Routine care 7.8 6.2 .22
Sick care 6.6 3.8 ,.01
Same source of care for routine and sick care 13.8 7.5 ,.001
Usual place for routine care
Physician’s office 79.4 92.8 ,.001
Outpatient’s clinic 13.1 4.5 .001
Health center 7.2 2.4 ,.001
Usual place for sick care
Physician’s office 81.8 92.0 ,.001
Outpatient clinic 8.9 4.1 ,.001
Health center 3.9 1.6 ,.05
Emergency department 5.4 2.4 ,.01
Number of physician visits in last 12 mo
0 29.5 17.8 ,.001
1–5 62.7 67.6 ,.05
6–10 5.7 10.3 ,.001
11–20 1.8 3.0 .01
.2 0.4 1.2 .001
Not current with well-child care 20.7 21.8 .54
,2 y 9.0 8.8 .94
2–5 y 21.6 23.7 .56
6–12 y 20.5 24.0 .23
13–17 y 23.8 22.3 .71
No. of short-stay hospital episodes in last 12 mo
0 97.5 96.7 .20
1–5 2.5 3.2 .23
.5 0.0 0.04 .11
Ever seen psychiatrist or counselor 3.6 5.8 ,.05
Received special education services for developmental delay, learning disability, or emotional/behavioral problem
3.0 4.2 .09
Repeated any grade or was ever suspended from school, and:
Received special education services 11.8 18.8 ,.05
more likely to lack a usual source for sick care and
continuity of routine and sick care, get their care
from outpatient clinics and health centers, and use
emergency rooms, and they made fewer physician
visits.
Privately insured middle class black children
were more likely to have been born with low birth
weight, a finding consistent with other studies
showing this same difference among infants born to
nonpoor parents.
39,40They also were more likely to
have asthma, a finding compatible with results of
other studies
32,41– 43that show that higher rates of
this condition among black children cannot be
ex-plained entirely by social or economic factors. In
contrast, black children were reported as having
fewer chronic health conditions overall and similar
TABLE 4. Physical Health, Behavior and School Problems, Sources of Care, and Use of Medical, Mental Health, and Special Education Services by Black and White Children with Private Health Insurance and Family Incomes in the Third and Fourth Quintiles Child Health Supplement to the 1988 National Health Interview Survey (N55263)
Black % (n5502)
White % (n54761)
Urban residence 34.9 10.6*
Single-parent household 22.8 9.5*
Maternal age at child’s birth#16 y 1.6 1.2
Physical health
Health status excellent 50.2 59.8*
No chronic conditions 78.9 71.2*
Low birth weight 11.6 5.2*
Ever had asthma 9.5 5.9*
Psychological and school functioning
Behavior Problem Index Score$90 percentile 7.6 7.9
Repeated any grade 17.5 11.3*
Ever suspended from school 11.5 5.0*
Medical and related service use Lack usual source of
Routine care 5.3 5.2
Sick care 6.4 3.2*
Same source routine and sick care 10.1 6.5**
Usual place for routine care:
Physician’s office 83.2 94.2*
Outpatient clinic 12.1 3.8*
Health center 4.5 1.8*
Usual place for sick is emergency department 4.2 2.2***
Not current with well-child care 17.7 21.5*
Ever seen psychiatrist or counselor 4.4 5.9
Received special education services for developmental delay, learning disability, or emotional/behavioral problem
2.8 4.1
Repeated any grade or was ever suspended from school and
Received special education services 9.6 19.4*
Ever seen psychiatrist or counselor 6.4 14.5**
*P,.05; **P5.06; ***P5.07.
TABLE 5. Adjusted ORs* for Selected Measures of Health, Behavior and School Problems, Sources of Care, and Health Services Utilization by Privately Insured, Middle Class Black Children and Youth in the United States,** Child Health Supplement to the 1988 National Health Interview Survey (N58381)
OR 95% CI P
Excellent health 0.7 0.6–0.8 ,.001
Ever had asthma 1.4 1.01–2.0 ,.05
Low birth weight 1.9 1.3–2.8 ,.001
Repeated any grade 1.4 0.96–1.9 .09
Ever suspended from school 2.2 1.5–3.3 ,.001
Lack
Usual source of sick care 1.3 0.8–2.2 .34
Same source of care for routine and sick care 1.9 1.2–2.9 .01
Physician’s office is usual place for routine care 0.4 0.3–0.5 ,.001
Emergency department is usual place for sick care 3.0 1.7–5.5 ,.001
Ever seen psychiatrist or counselor 0.5 0.2–1.1 .10
Psychiatrist or counselor felt needed, but never seen 0.7 0.3–1.9 .50
Ever seen psychiatrist or counselor, child has BPI$90th percentile*** 2.0 0.5–7.9 .30
Ever received special education services 0.6 0.4–1.1 .09
Repeated any grade or ever suspended from school
Received special education services 0.6 0.3–1.2 .12
Ever seen psychiatrist or counselor 0.5 0.2–1.8 .31
* Independent Variables tested include second (lower), third (middle), and fourth (upper) middle class income quintiles; age; source of routine care (outpatient clinic, health center, emergency department, physician’s office); region (Midwest, South, West, Northeast); urbanization (large or small city, suburban, rural); gender; household composition (single- or two-parent); maternal age at child’s birth (#16 y or.16 y); and family size.
rates of limitations of activity because of these
con-ditions, yet they were less likely to be perceived by
their parents as being in excellent health. Although
black children and white children had similar rates
of behavior problems, black children were twice as
likely to have repeated a grade or to have been
suspended from school. In multivariate analyses,
the association of children’s race and repeating a
grade was no longer statistically significant (OR:
1.4;
P
5
.09), but black children were still more
than twice as likely to have been suspended from
school compared with their white peers. We are
unaware of any previous studies indicating this
heightened risk for black middle class children.
Other studies, although not focusing on middle
class children, also have found increased rates of
discontinuity of routine and sick care, increased
use of hospital outpatient departments and
com-munity health centers,
1,2,18,44and decreased
num-bers of ambulatory care visits by black
chil-dren.
13,45,46Although it appears that the increased
rates of lacking continuity of care were attributable
to their increased use of community health centers
and hospital outpatient departments, this does not
appear to account for black children’s diminished
use of private physicians for routine care, their
increased reliance on emergency departments for
sick care, or their fewer ambulatory care visits,
because these differences persisted in multivariate
analyses that controlled for their source of routine
care. The data available provide no insights into
whether these differences are attributable to
nonfi-nancial barriers to care,
46,47such as long waits and
diminished evening and weekend availability at
hospital outpatient departments and community
health centers; longer distance to or more difficult
access to private physicians’ offices; families
feel-ing out of place in some practice settfeel-ings; or overt
or covert discrimination.
There are other limitations to these data. All data
were from parent report, with limited information
available about many important aspects of
chil-dren’s insurance and health care. Potentially
im-portant unassessed factors include the
comprehen-siveness, cost-sharing (ie, copays or deductibles),
and limits of insurance coverage; content,
compre-hensiveness, and cultural appropriateness of care
received; variability of any of these characteristics
with degree of urbanization, specific city, state, or
region of the United States; and factors influencing
choice of sources of care. There also was no
infor-mation available regarding family wealth (ie,
finan-cial assets), and resources such as home ownership,
cars, other material possessions and liquid savings
might influence the patterns of service use noted.
Also, the data are 10 years old, predating the rapid
introduction of managed care into many
communi-ties.
Despite the limitations, these data offer what we
believe is the first detailed picture of the health,
behavior and school problems, and use of medical,
mental health, and special education services of
black and white middle class children in the
United States. They demonstrate similar rates of
health and behavior problems, but substantially
in-creased rates of school difficulties among black
children. They also demonstrate no differences in
rates of having a usual source of routine care being
current with well-child care, or receiving mental
health or special education services. In contrast,
even in the presence of private health insurance,
middle class black children had markedly different
sources and patterns of ambulatory medical service
use. Although the findings do not identify the
mechanisms behind the differences, they clearly
demonstrate the increased risk and relative
disad-vantage that black race appears to portend for
mid-dle class children in the United States. These and
similar findings, we believe, are crucial to our
ef-forts to ensure equal access to medical services for
all our children, irrespective of their income,
insur-ance, or race.
REFERENCES
1. Blendon RJ, Aiken LH, Freeman HE, Corey CR. Access to medical care for black and white Americans.JAMA.1989;261:278 –281 2. Council on Ethical and Judicial Affairs. Black–white disparities in
health care.JAMA.1990;263:2344 –2346
3. Strogatz D. Use of medical care for chest pain: differences between blacks and whites.Am J Public Health.1990;80:290 –294
4. Navarro V. Race or class versus race and class: mortality differentials in the United States.Lancet.1990;336:1238 –1240
5. Council on Scientific Affairs of the American Medical Association. Hispanic health in the United States.JAMA.1991;265:248 –252 6. Public Health Service. Healthy People 2000: National Health
Promo-tion and Disease PrevenPromo-tion Objectives. Washington, DC: US Dept of Health and Human Services, Public Health Service. DHHS publica-tion no. (PHS)91-50212; 1991
7. Lieu TA, Newacheck PW, McManus MA. Race, ethnicity, and access to ambulatory care among US adolescents.Am J Public Health.1993; 83:960 –965
8. Gornick ME, Eggers PW, Reilly TW, et al. Effects of race and income on mortality and use of services among Medicare Beneficiaries.
N Engl J Med.1996;335:791–799
9. Geiger HJ. Race and health care—an American dilemma?N Engl J Med.1996;335:815– 816
10. Peterson ED, Shaw BS, DeLong ER, Pryor DB, Califf RM, Mark DB. Racial variation in the use of coronary revascularization procedures.
N Engl J Med.1997;336:480 – 486
11. Adler NE, Boyce T, Chesney MA, Folkman S, Syme SL. Socioeco-nomic inequalities in health: no easy solution. JAMA. 1993;269: 3140 –3145
12. Pappas G. Elucidating the relationships between race, socioeconomic status, and health.Am J Public Health.1994;84:892– 893
13. Kleinman JC, Gold M, Makuc D. Use of ambulatory care by the poor: another look at equity.Med Care.1981;19:1011–1029
14. Egbuonu BS, Starfield B. Child health and social status.Pediatrics.
1982;69:550 –557
15. Starfield B. Family income, ill health, and medical care of US chil-dren.J Public Health Policy.1982;3:244 –259
16. Newacheck PW, Halfon N. Preventive care use by school-aged chil-dren. Differences by socioeconomic status. Pediatrics. 1988;82: 462– 468
17. Wise PH, Meyers A. Poverty and child health.Pediatr Clin North Am.
1988;35:1169 –1186
18. St. Peter RF, Newacheck PW, Halfon N. Access to care for poor children: separate and unequal?JAMA.1992;267:2760 –2764 19. Holl JL, Szilagyi PG, Rodewald LE, Byrd RS, Weitzman M. Profile of
uninsured children in the United States.Arch Pediatr Adolesc Med.
1995;149:398 – 406
20. Sheils JF, Wolfe PR. The role of private health insurance in children’s health care.Future Child.1992;2:115–133
21. Adams PF, Hardy AM. Current estimates from the National Health Interview Survey: United States, 1988.Vital Health Stat.1989;173: 1–11, 133–144
Health Statistics. Advance data fromVital Health Stat.No. 188; 1990 23. US Bureau of the Census.Middle Class and Income Inequality. Cur-rent Population Reports, Series P60. Washington, DC: US Bureau of the Census; 1997. http://www.census.gov/hhes/income/midclass/ midclsan.html
24. Massey JT.Design and Estimation for the National Health Interview Survey, 1985–94. Data Evaluation and Methods Research. Vital Health Stat–Series 2;1989;110:1–33
25. Collins JG, Hendershot GE.Health Characteristics of Large Metro-politan Statistical Areas: United States, 1988 – 89. Vital Health Stat–Series 10; 1993;187:1–97. Data from the National Health Sur-vey. US Bureau of the Census. Statistical Abstracts of the United States: 1993 (113th ed). Washington, DC: Government Printing Office; 1993
26. Newacheck PW, Stoddard JJ, McManus P. Ethnocultural variations in the prevalence and impact of childhood chronic conditions. Pediat-rics.1993;91:1031–1039
27. Weitzman M, Byrd RS, Auinger P. Children in big cities in the United States: health and related needs and services.Ambulatory Child Health.1996;1:347–359
28. Peterson JL, Zill N. Marital disruption, parent– child relationships, and behavior problems in children.J Marriage Fam.1986;48:295–307 29. Achenbach TM, Edelbrock C.Manual for the Child Behavior Check-list and Revised Child Behavior Profile.Burlington, VT: Queen City Printers; 1983
30. Gortmaker SL, Walker DK, Weitzman M, Sobol AM. Chronic condi-tions, socioeconomic risks, and behavioral problems in children and adolescents.Pediatrics.1990;85:267–276
31. Byrd RS, Weitzman M. Predictors of early grade retention among children in the United States.Pediatrics.1994;93:481– 487 32. Weitzman M, Gortmaker SL, Sobol AM, Perrin JM. Recent trends in
the prevalence and severity of childhood asthma.JAMA.1992;268: 2673–2677
33. McCormick MC, Gortmaker SL, Sobol AM. Very low birthweight children: behavior problems and school difficulty in a national sam-ple.J Pediatr.1990;117:687– 693
34. Weitzman M, Gortmaker SL, Sobol AM. Maternal smoking and
be-havior problems of children.Pediatrics.1992;90:342–349
35. Byrd RS, Weitzman M, Auinger P. Behavior problems, age-for-grade and grade retention among children in the United States.Pediatrics.
In press
36. American Academy of Pediatrics.Guidelines for Health Supervision II. Elk Grove Village, IL American Academy of Pediatrics; 1988 37. SAS Institute Inc.SAS/STAT User’s Guide: Statistics. Release 6.03
ed. Cary, NC: SAS Institute Inc; 1988
38. Shah BV, Barnwell BG, Hunt N, LaVange LM.SUDAAN User’s Man-ualRelease 6.40. Research Triangle Park, NC: Research Triangle Institute; 1995
39. Barfield WD, Wise PH, Rust FP, Rust KJ, Gould JB, Gortmaker SL. Racial disparities in outcomes of military and civilian births in Cal-ifornia.Arch Pediatr Adolesc Med.1996;150:1062–1067
40. Schoendorf KC, Hogue CJR, Kleinman JC, Rowley D. Mortality among infants of black as compared with white college-educated parents.
N Engl J Med.1992;326:1522–1526
41. Weitzman M, Gortmaker S, Sobol A. Racial, social, and environmen-tal risks for childhood asthma.Am J Dis Child.1990;144:1189 –1194 42. Cunningham J, Dockery DW, Speizer FE. Race, asthma, and persistent wheeze in Philadelphia school children.Am J Public Health.1996; 86:1406 –1409
43. Gergen P. Social class and asthma— distinguishing between the dis-ease and the diagnosis.Am J Public Health.1996;86:1361–1362 44. Hahn BA. Children’s health. Racial and ethnic differences in the use
of prescription medications.Pediatrics.1995;95:727–732
45. Wood DL, Hayward RA, Corey CR, Freeman HE, Shapiro MF. Access to medical care for children and adolescents in the United States.
Pediatrics.1990;86:666 – 673
46. Orr ST, Miller CA, James SA. Differences in use of health services by children according to race: relative importance of cultural and sys-tem-related factors.Med Care.1984;22:848 – 853