342 | P a g e
RUN OFF ESTIMATION BY USING LOW IPMACT
DEVELOPMENT (LID) APPROACH FROM A SMALL
WATERSHED
Srusti Chand
1, Krishna Khandelwal
2, D. K. Barik
3 1,2Undergraduate Student, Dept. of Environmental and Water Resources Engineering, SCALE,
VIT University, Vellore, Tamil Nadu,(India)
3
Assoc. Prof.
Dept. of Environmental and Water Resources Engineering, SCALE, VIT
University, Vellore, Tamil Nadu, (India)
ABSTRACT
Development of land transforms the landscape and impacts in stream ecosystems as it changes the natural flow
area. An increase in impervious areas where the water doesn’t percolate in the ground results in higher volumes
of storm water runoff, which in turn reduce time to peak, and more frequent flooding. Low Impact development
(LID) is a measure which can be used to reduce the impact of urbanization by controlling runoff at the source.
Peak flow, rainfall and runoff volume are few of the conventional terms which are used to evaluate the impact
and performance of storm water management techniques on the watershed. In this study it is focused to simulate
runoff with LID approach and compare it with conventional approach. There are many LID techniques available
to estimate runoff; here it has used pavements and bio-retention technique only. With LID, curve number has
been estimated and by using the curve number method, runoff has been estimated. It has been found that with
LID approach, the runoff amount is increased by 0.8 to 1.7 % than conventional approach.
Keywords
: Low Impact Development (LID), Curve Number, Bioretention, Pavement, Runoff
I. INTRODUCTION
Proper development and management of watershed will increases the peak flows and runoff volume. This alters
the natural flow system of the stream and disturbs the in-stream ecosystem. Watershed management is an
amalgamation of technologies within the natural margins of a drainage area for optimum development of lands
and water resources. Simply, Watershed management implies the wise use of all land and water resources and
for the betterment of people. Low Impact Development (LID) practices are different methods for controlling
storm water at the source like rooftops, parking lots and sidewalks.
LID technologies include permeable pavements, roof gardens, infiltration swales, rainwater harvesting bio
retention areas, disconnected impervious areas [1]. LID goals at reproducing the natural hydrologic landscape
and create flow conditions that mimic the pre-development flow system through the mechanisms of micro-scale
343 | P a g e
are regarded as an effective tool in managing stormwater. When compared to traditional, impervious asphalt,permeable pavements can reduce runoff quantity, lower peak runoff rates, and delay peak flows due to their high
surface infiltration rates [2, 3, 4]. A set of studies have examined the impact of LID on the hydrologic stream
regime and found that LID is able to reduce the peak flow for regular, less intense storms. For other rainfall
measures, LID may not be effective in depressing the peak flow, but can increase the time to peak or decrease
the period of sustained high currents.
However it was witnessed that, reduction was higher for less frequent rainfall events, and this less frequent
rainfall events leads to flood, which needs the proper management. Therefore, the LID approach helps in flood
management and also in improving hydrologic sustainability of the watershed. By using LID approach at a field
site in Goldsboro, North Carolina, water quality samples from PICP subsurface drainage were evaluated [5].
The goal of watershed management is to choose LID, or a combination of technologies to mitigate the
hydrologic effects of expansion in a watershed. The modifications in the timing of flows and duration of
flooding can considerably impact the condition in the downstream ecosystem communities, which have to be
incorporated when evaluating and picking sustainable watershed management plans.
Hence, in this study, a small watershed Batanwada has been taken to study the impact of LID to the hydrologic
behaviour of watershed. The LID practices, including permeable pavements and bioretention, were considered
to investigate the impact of LID on the small watershed. These LID strategies are simulated within a hydrologic
model to facilitate watershed management for a small watershed where storm water runoff and erosion problems
have been documented. The Curve Number method has been used and integrated into the watershed model to
represent each of the LID technologies.
The Bioretention units are being constructed in the upland areas which improves the aesthetic appeal as well as
the use of the land. Porous pavements will only help in improving the transportation facilities. And as a whole
these LID practices will help in the development of the watershed
II. STUDY AREA AND DATA COLLECTION
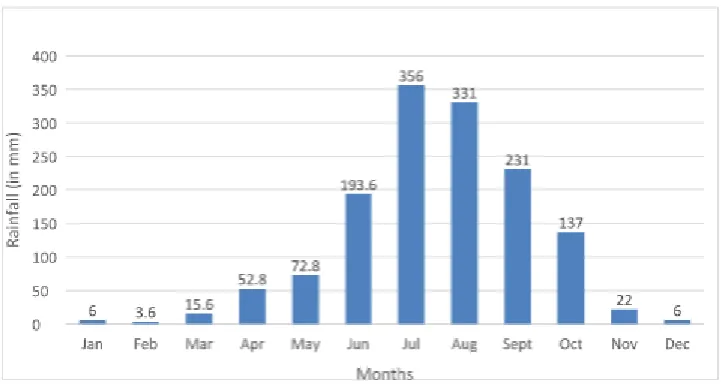
Table 1 depicts the characteristics of the study area. The monthly rainfall data has been collected for 2013 for
this study area. The watershed DEM has been downloaded from USGS and the watershed has been delineated
by using GIS software. The drainage network and contour maps are shown in Fig. 1. The land use and land
344 | P a g e
Table No. 1: The characteristics of the study area
Name of the watershed Batanwada
Latitude
Longitude
18° 15’ 39.60” 81° 33’ 28.8”
Name of the village
Batanwada
Name of the Block Podia
Name of the District Malkangiri
Name of the State Odisha
Total geographical area 377.06 Hectares
Agro climatic zone North central plateau zone
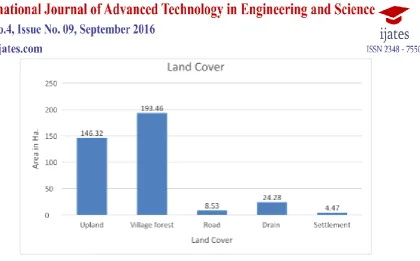
Land cover Upland and forest
345 | P a g e
Figure No. 2: Land cover with its coverage area
III. METHODOLOGY
3.1 Estimation of Runoff
The runoff was estimated by soil conservation services or SCS curve number method. The curve number has
been used to determine the runoff in this method. The curve number depends on hydrologic soil group, land use
and hydrologic condition. Curve number has been taken from the information of land use and land cover and
soil types .The equation for runoff estimation in SCS method is:
Q = 0 for P≤IaP-Ia2P-Ia+S for P>Ia (1)
Where,
Q = Runoff in inches
P = Rainfall in inches
S = Maximum watershed storage
Ia = Initial loss
The initial equation is based on the trends observed in the data collected from various sites. And after further
evaluation of empirical datasets the value Ia can be expressed in terms of S;
Ia = 0.2S (2)
Substituting this in the previous equation gives;
Q = 0 for P≤IaP-0.2S2P-0.8S for P>Ia (3)
The runoff curve number CN is then related to S as;
346 | P a g e
And, S=25400CN-254 for Q, P, S in mm (5)3.2 Runoff estimation by using LID
3.2.1 Permeable Pavement
HydroCAD software solutions provided a method for calculating the appropriate CN for pavements in
watersheds where there is no hydrologic data available for the same. The maximum watershed storage (S) and
effective storage (Se) are equated, which is defined as the product of depth (d) and porosity (n) of the pavement. Se =d × n (6)
The required data for different pavements have been taken from available literature [5] and presented in Table 2.
The values of curve numbers were calculated by substituting the values in (5)
Table No. 2: Values of CN for different pavements
Permeable Pavement Design
Effective storage (Se) Curve Number (CN)
Porous pavement 40 mm 85.4
Concrete grid paver 70mm 77.5
Porous pavement with
underdrain
9mm 95.4
3.2.2 Bioretention
Bioretention are typical storm water control measures that stores and manages water quality control volume
(WQv). The change in curve number by the implementation of bioretention was calculated by a method developed by schueler’s which calculates water quality control volume (WQv) by multiplying 1 inches (2.54 cm)
of rainfall by volumetric runoff coefficient (Rv) [6].
Volumetric Runoff Coefficient (Rv) is defined as;
Rv = 0.05 + 0.009Ia (7)
Where Ia is defined as % of impervious cover for the drainage basin. Water quality volume in inches is calculated as follows;
WQv = 1.0(Rv) (8)
347 | P a g e
CNm=100010+5P+10WQV-10WQV2+1.25WQVP0.5 (9)
Where: P = Rainfall, in inches (use 1.0 inches)
WQv = Water quality volume, in inches (1.0 Rv) For Batanwada watershed
Total Impervious Area = 37.28 Hectares
Volumetric Runoff Coefficient (Rv) = 0.05 + 0.009 (37.28377.06×100) = 0.14
Water Quality Volume (WQv) in inches = 1.0(Rv) = 0.14 inches
The Modified Curve Number; CNm = 100010+5P+10WQV-10WQV2+1.25WQVP0.5
= 1000100+5×1.0+10×0.14-100.142+1.25×0.14×1.00.5
= 83.33
IV. RESULTS AND DISCUSSION
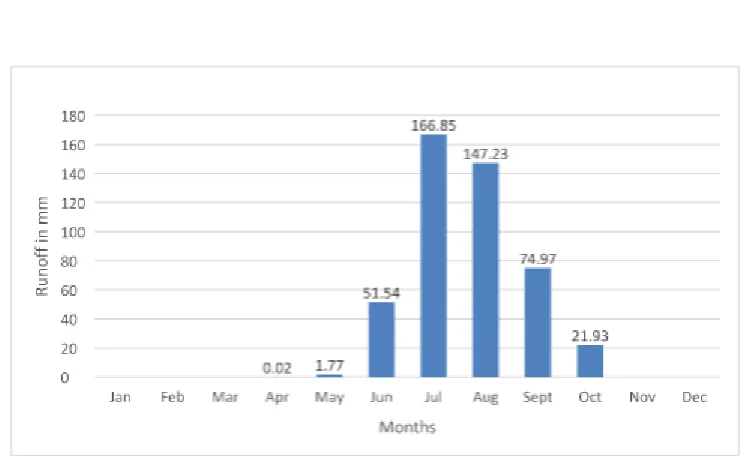
The Runoff was calculated for Batanwada watershed for the year 2013 based on available rainfall data (Fig. 3 &
4) by using SCS curve number as conventional way. It is observed that there is no runoff generated for a period
of five months with the highest runoff being generated in the month of July. The amount of runoff varies in
between 30% to 50% of the total rainfall in that particular month. Variation in curve number was calculated for
three types of permeable pavement and bioretention. And appropriate locations are being selected for placement
of bioretention. Results are being simulated for the same and the difference in the amount of runoff generated
was calculated.
348 | P a g e
Figure No. 4: Runoff generated in Batanwada watershed
4. 3 Estimation of Runoff for different pavements
Runoff was estimated after replacing traditional pavements with porous pavements using modified curve
number from Table 2. It was observed that the runoff volume increases by 15082.4 m3 or 0.86%. than the conventional method. Runoff was estimated after replacing traditional pavements with concrete grid paver
using the modified curve number from Table 2.
It was observed that the runoff increases by 7541.2 m3 or 0.4% than the conventional method. Runoff was estimated after replacing traditional pavements with porous pavements with underdrain using the modified curve
number from Table 2. In this case also runoff increased by 30164.8 m3 or 1.7% than conventional method. The increment volumes of runoff by using different pavements are presented in Table 3.
4.4 Estimation of Runoff for Bioretention
Runoff was estimated by placing Bioretention on the appropriate location and using (9) the modified curve
number. I t was observed that the runoff increases by 15082.4m3 or 0.8%.
5. 5 Estimation of Runoff for Bioretention with different pavements
Runoff was estimated by simultaneously placing Bioretention with different pavements i.e. porous, concrete and
porous with underdrain. The results are presented in Table 3. The percentages of volume increased are 1.7%,
349 | P a g e
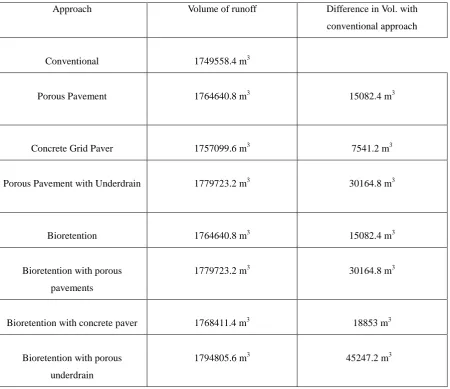
TABLE NO. 3: Comparison of change in volume of runoff for different LID approaches with
conventional approaches
Approach Volume of runoff Difference in Vol. with
conventional approach
Conventional 1749558.4 m3
Porous Pavement 1764640.8 m3 15082.4 m3
Concrete Grid Paver 1757099.6 m3 7541.2 m3
Porous Pavement with Underdrain 1779723.2 m3 30164.8 m3
Bioretention 1764640.8 m3 15082.4 m3
Bioretention with porous
pavements
1779723.2 m3 30164.8 m3
Bioretention with concrete paver 1768411.4 m3 18853 m3
Bioretention with porous
underdrain
1794805.6 m3 45247.2 m3
V. CONCLUSION
LID was simulated using a modelling approach for a watershed to evaluate the implementation of storm water
management strategies and its impact on hydrology of watershed when compared to the existing scenario
without any mitigating strategies. A variety of rainfall events needs to be consider for sustainable development
of the watershed. The simulation here indicates that a variety of LID events needs to be used based on the
suitability of the geographical condition. And the results demonstrated a considerable improvement in managing
350 | P a g e
It was observed that the runoff with only porous pavement was 15082.4 m3 and when porous pavement andbioretention were used simultaneously a 100% increase to 30164.8 m3 was observed. And similar changes were
also seen when bioretention was used simultaneously with concrete paver and porous pavement with underdrain.
Future research can investigate alternative solutions. With these alternatives different set of solutions can be
obtained which are different with respect to the decision variables but which results in a similar performance.
This would be helpful for the storm water management decision makers to explore different solutions which
results of same implementation cost and similar hydrologic impact reduction. Finally, the framework can be
extended to include different types of LIDs and BMP.
REFERENCES
[1] United State Environmental Protecting Agency (US, EPA), Reducing storm water cost by through low
impact development strategies and practice, 2007. EPA-841-F-07-006
[2] C. J. Pratt, J. D. G. Mantle, P. A. Schofield, Urban stormwater reduction and quality improvement through
the use of permeable pavements, Water Science and Technology, 21(8), 1989, 769-778.
[3] B. O. Brattebo, D. B. Booth, Long-term stormwater quantity and quality performance of permeable
pavement systems. Water Research. 37(18), 2003, 4369-4376.
[4] E. Z. Bean, W. F. Hunt, D. A. Bidelspach, Field survey of permeable pavement surface infiltration rates,
Journal of Irrigation and Drainage Engineering, 133 (3), 2007 247-255.
[5] E. Z. Bean, W.F. Hunt, D.A. Bidelspach, Evaluation of four permeable pavement sites in eastern North
Carolina for runoff reduction and water quality impacts, Journal of Irrigation and Drainage Engineering,
133(6), 2007, 583-592