1
Moving beyond CAD to an Object-Orientated Approach
1for Electrical Control and Instrumentation Systems
23
Peter E.D. Lovea, Jingyang Zhoua, Jane Matthewsb and David J. Edwardsc 4
a Dept. of Civil Engineering, Curtin University, GPO Box U1987, Perth, WA 6845 5
b Dept. of Construction Management, Curtin University, GPO Box U1987, Perth, WA 6845 6
c School of the Built Environment, Birmingham City University, Birmingham City University, 7
Millennium Point, Curzon Street, Birmingham, B4, 7XG, United Kingdom 8
Abstract: The quality of computer-aided-design (CAD) generated ‘As-built’ documentation is evaluated for a High
9
Voltage Switchgear System (HVSS), which forms part of a Supervisory Control and Data Acquisition up-grade within
10
a geo-thermal power plant. A total of 267 CAD drawings for the HVSS were used to create a Systems Information
11
Model (SIM) whereby the physical components and associated connections were constructed in an object orientated
12
database. Throughout the modelling process a considerable amount of errors and information redundancy were
13
identified and examples are presented. The aforementioned CAD drawings consumed 10,680 man-hours to produce
14
in stark contrast to the 80 man-hours required to construct the SIM; thus illustrating the efficiency and effectiveness
15
of SIM when compared to CAD for the design and documentation of electrical, control and instrumentation systems
16
(ECIS). To realise this huge potential cost and productivity saving requires a shift in mindset and a move beyond the
17
use of CAD, where there exists a 1:n relationship, to one that focuses on establishing a 1:1 relationship between
18
objects in the SIM and components in the real world.
19 20
Keywords: ‘As-built’ documentation, computer-aided design, errors, systems information model
21 22
Introduction 23
Accurate and reliable electrical documentation is pivotal for managing and operating constructed 24
facilities (Clayton et al., 1998). However, there is a propensity for ‘As-built’ documentation, which 25
records the status of a facility at the completion of construction, to contain errors and considerable 26
information redundancy (Gallaher et al., 2004; Love et al., 2014). Moreover, they often do not 27
effectively express the information required to operate a facility. An array of factors contribute to 28
this aforementioned scenario, including the working environment, and poorly designed processes 29
and structures. When producing electrical instrumentation and control system (ECIS) drawings 30
however, it has been suggested that use of Computer-Aided-Design (CAD) provides the medium 31
for generating of poor quality ‘As-built’ documentation, which renders them obsolete during 32
2
Within the construction and engineering industry, Building Information Modelling (BIM) has 34
progressively been employed to improve the management of information throughout a project’s 35
lifecycle. BIM is typically created using an array of integrated software applications for architectural, 36
structural, heating ventilation and air conditioning, and hydraulic elements. Such elements have 37
scale and geometry that can be visualized within the BIM. However, ECIS are void of scale and 38
geometry making visualized in a three-dimensional (3D) view impossible; albeit, cable trays and 39
components can be modelled. Consequently, ECIS practitioners rely upon CAD to detail the 40
connection and relationship between components (Love et al., 2013). 41
42
Documentation of ECIS in CAD 43
Through CAD, electrical and system engineers may: experiment with various alternative design 44
solutions; validate circuits more readily; and improve design accuracy. For example, the design of 45
a bi-stable circuit can be readily checked in CAD (i.e. values of load resistance attributed to the 46
various components). Similarly, faulty permanent magnet design previously posed significant 47
problems for electrical engineers as it resulted in partial demagnetization. However, CAD’s ability 48
to verify the design’s reasonability has been resolved. Other advantages offered by CAD for ECIS 49
practitioners include an ability to: 50
51
• provide an understandable representation of the numerical results of what? (e.g. through 52
graphs and other graphic devices); 53
• reduce the tediousness of solving common and complex equations; 54
• adapt simple numerical methods to solve complex problems that would be otherwise too 55
time-consuming to undertake via manual calculations; and 56
• test the design efficacy (such as the maximum value of load resistance the design can 57
support). 58
59
Typical types of drawings created within CAD for ECIS are: 1) block; 2) schematic; 3) termination; 60
and 4) layout. In addition to these drawings, complementary cable schedules and ‘Cause and Effect’ 61
(C&E) diagrams augment information provided within documentation produced; though this is 62
dependent upon the nature of the system that is being designed and documented. 63
64
Despite CAD’s many palpable benefits, ECIS engineers are dogged by errors and omissions, 65
especially as objects are often replicated on several different drawing types. In addition, concepts 66
3
patterns. Often, the same information is replicated within several documents to form relationships 68
between them. For example, different information about the same component will regularly be 69
placed in various documents or drawings and so equipment and cable tags are often repeated. As 70
a documentation package evolves it becomes increasingly difficult to ascertain which particular 71
documents contain the same information or show related information. Monitoring and controlling 72
documentation information accuracy and currency therefore forms a critical component of the 73
engineering management process. Yet, the extant literature consistently demonstrates that effective 74
audits are rarely undertaken due to time and financial constraints imposed on engineering firms 75
(e.g., Lopez and Love, 2012). When meticulous audits are undertaken, errors and omissions are 76
invariably found and consequently, several iterations of the documentation may be required Do 77
you mean ‘revisions of the documents’?. Unfortunately, engineers who are subject to tight 78
programmes of working and associated time constraints may distribute incomplete or inaccurate 79
documentation to contractors. 80
81
Incorrect labelling, missing labels and omissions represent typical errors found in ECIS drawings 82
(Love et al., 2013). Moreover, connections between various electrical? devices (represented as 83
shapes and lines) can be distributed among several drawings. Unclear please rewrite plus I’m not 84
clear as to what the significance of this sentence is Errors and omissions identified by engineers 85
on-site invariably result in a ‘Request for Information’ (RFI) being raised which seeks to identify 86
and resolve issues on-site to avoid potential contract disputes and claims at a later date (Tadt et al., 87
2012). Raising an RFI can be costly and may adversely impact upon the contractor’s productivity. 88
This is because, when RFIs are addressed, drawings must be up-dated to accommodate 89
consequential changes and thus better reflect what is actually being constructed; when this process 90
is not robustly executed, the quality of ‘As-built’ documentation produced is questionable. 91
92
‘As-built’ Documentation within Electrical Engineering Projects 93
‘As-built’ documentation represents a revised set of drawings submitted by a contractor upon 94
completion of the works they were contracted to undertake. They reflect changes made in the 95
specifications and working drawings during the construction process, and detail the exact 96
dimensions, geometry, and location of all elements of the work completed under a contract. 97
However, there is a proclivity for errors or omissions to be contained within the ‘As-built’ 98
documentation as they are prepared using two-dimensional (2D) CAD (Love et al., 2013; Zhou et
99
al., 2015). Increasing competition, schedule and financial pressures invariably manifest in the 100
4
(Love et al., 2015). Consequently, tender prices may increase as contractors account for potential 102
risks. During construction, drawings may need to be amended as RFIs and change orders arise. 103
Such amendments are ‘simply’ highlighted on selected drawings rather than comprehensively 104
revising all information produced (and effectively communicating such to all parties involved). 105
106
Research undertaken by Love et al. (2013), for example, found a component or device may occur 107
on as many as 20 drawings in electrical contracts. When a change is required to a 2D drawing, the 108
drawing and each corresponding view has to be manually updated thus a 1:n relationship exists. 109
In this case, every single drawing where a component or device exists is required to be up-dated, 110
which increases costs to an engineering firm, and thus adversely impacts their fee if a fixed fee had 111
been agreed. Contrastingly, if a cost reimbursement contract is awarded to an engineering firm, 112
then the financial considerations associated with amending documentation are accommodated; 113
they are in this instance being ‘paid’ to repeatedly issue paper, irrespective of its quality (i.e., 114
completeness and accuracy). 115
116
Case Study 117
Considering the paucity of research undertaken in this area, an exploratory case study approach was
118
undertaken. This empirical inquiry sought to specifically investigate the potential inadequacies of ‘As-built’
119
documentation produced using CAD when compared to the SIM approach. The case study selected for the
120
research was based upon ‘As-built’ documentation supplied by a instrumentation and electrical systems
121
organization who had been awarded a contract to upgrade the Supervisory Control and Data Acquisition
122
(SCADA) system of a power plant. . Essentially, a SCADA is a system operating with coded signals
123
over communication channels so as to provide control of remote equipment in real-time. The 124
control system may be combined with a data acquisition system by adding the use of coded signals 125
over communication channels to acquire information about the status of the remote equipment 126
for display or for recording functions. SCADA systems ensure management are provided with 127
timely and accurate data that can be used to optimize the operation of plant. The researchers worked
128
collaboratively with this organization to produce an equivalent SIM from the ‘As-built’ drawings that had
129
been provided by them in a CAD format.
130
131
Case Background
132
The Philippines is situated in the Western Pacific Ocean and consists of 7,107 islands with circa 133
100 million inhabitants. It is located at the western fringes of the Pacific Ring of Fire and is 134
5
for ‘green and renewable’ geothermal harvesting which currently contributes to 18% of the 136
country’s electrical power. In the early 1970’s, the Philippines and the New Zealand governments 137
initiated the ‘Colombo Plan’ to investigate the potential geothermal power reserve of the island of 138
Leyte. After a series of shallow and deep drillings, a number of wells were completed and used to 139
supply steam for the turbines for the Tongonan-1 Geothermal Power Plant, which was constructed 140
and commissioned in 1983. 141
142
TheEnergy Development Corporation (EDC) is the largest producer of geothermal energy in the 143
Philippines, second largest in the world and has invested in geothermal, hydro and wind energy 144
projects (REF). Green Core Geothermal, Inc. (GCGI) is a subsidiary of EDC and operates two 145
geothermal power plants, Tongonan-1 and Palinpinon, in Leyte and Negros Oriental respectively; 146
collectively, these plants have the capacity to generate 305 megawatts. The Tongonan-1 power 147
plant, which is the focus of the research presented in this paper, consists of three 37.5 megawatts 148
units that cumulatively generate a total of 112.5 megawatts. Why was this plant chosen over the 149
other one? Any reasons? 150
151
Dataset: ‘As-built’ Documents
152
The ‘As-built’ electrical documentation, comprising of 267 CAD drawings of a SCADA system, 153
identified in Table 1, were provided to a instrumentation and electrical systems organization by a 154
major international construction company. The SCADA system’s initial design was undertaken by 155
a Swiss electrical engineering company and it was estimated that the total number of drawings 156
produced was approximately 1800. 157
158
159
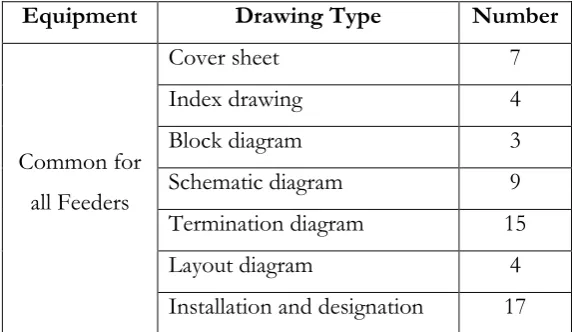
Table 1. Drawing list supplied 160
161
Equipment Drawing Type Number
Common for all Feeders
Cover sheet 7
Index drawing 4
Block diagram 3
Schematic diagram 9
Termination diagram 15
Layout diagram 4
6 Feeder 1
Cover sheet 1
Index drawing 6
Schematic diagram 13
Termination diagram 18
Equipment technical data 32
Cable schedule 2
Layout diagram 2
Feeder 2
Cover sheet 1
Index drawing 6
Schematic diagram 13
Termination diagram 18
Equipment technical data 31
Cable schedule 2
Layout diagram 2
Feeder 3
Cover sheet 1
Index drawing 5
Schematic diagram 9
Termination diagram 17
Equipment technical data 29 Total 267
162
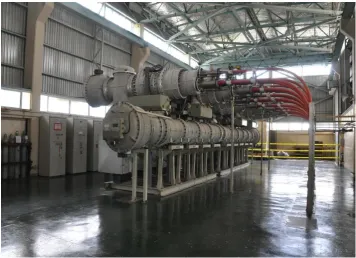
Would it not be better to move Figures 1 and 2 to after they are discussed not before? 163
7 165
166
Figure 1. High voltage switchgears 167
168
169
170
8
The supplied CAD drawings were used to document the design of the first three of nine high 172
voltage (HV) switchgears for the plant’s 138kV power Feeders (Figure 1). The layout of the 173
switchgears and the corresponding control panels are presented in Figure 2. These HV switchgears 174
are installed between generators and transformers and are critical for ensuring the power plant is 175
operational. They act to protect equipment by clearing the short-circuit faults that could cause 176
severe damage to them. Table 1 reveals that there are some common drawings that apply to all 177
three Feeders. These drawings are used to demonstrate the general arrangement of the equipment, 178
specify the designation for each individual device and illustrate the terminal connections for those 179
commonly used sockets/plugs. Each Feeder has a corresponding set of specified drawings. The 180
drawings indicate the equipment used for the switchgear and the panel side for each Feeder; inter-181
panel cable connections and wirings between component terminals are also illustrated. 182
183
Systems Information Modelling 184
In evaluating the quality (i.e., information redundancy and errors) of the documentation provided, 185
the electrical components and cables were digitally modelled into a SIM. A SIM is a generic term 186
used to describe the process of modelling complex EICS using appropriate software (e.g., Dynamic 187
Asset Documentation (DAD)) and is akin to the development of a Building Information Model 188
(BIM). When a SIM is used to design and document a connected system, all physical components 189
and associated connections to be constructed can be modelled in an object orientated database. 190
This results in a 1:1 relationship between objects in the SIM and components in the real world. 191
Consequently, errors and information redundancy typically contained within documentation 192
developed in a traditional CAD system can be eliminated (Love et al., 2013; Love et al., 2014). 193
194
Two methods can be used to construct a SIM using software such as DAD: 1) manually; and 2) 195
automatically. The manual method is appropriate for new projects or where a complete cable 196
schedule is not available. In such circumstances, engineers are required to manually create a digital 197
model of each real-world component and cable within the SIM to form a connected system. If 198
complete cable schedules are available, then the modelling process is considered to be 199
straightforward using software such as DAD, as it is equipped with a function that can generate a 200
SIM automatically based on the information derived from the cable schedules. 201
202
For this research, the available cable schedules only provided scant information about the inter-203
panel cables. Hence, the information was insufficient to construct a SIM model automatically, 204
9
instrumentation and electrical contractor. With this in mind, a SIM was manually created by the 206
researchers in conjunction with the contractor’s engineers. Can you briefly describe how this was 207
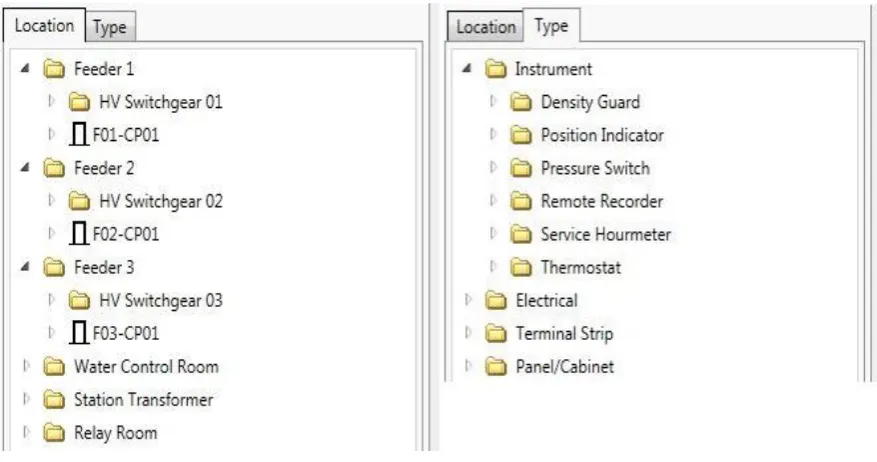
done? When the modelling process was completed a total of 525 components and 2451 cables 208
formed the basis of the SIM. The components were classified according to their ‘Location’ and 209
‘Type’; that is, their physical location in the plant and their functionality (Figure 3). Cables were 210
classified into various ‘Types’ according to the number of cores and their power rating. As a result, 211
this enabled the design to be examined by directly reviewing the relationships of components 212
through dynamically interconnected models rather than through the complicated connections 213
presented on CAD drawings, which are invariably difficult to decipher. 214
215
216
Figure 3. Location and type classification 217
218
Previous empirically research undertaken by Love et al. (2013) revealed that an average of five 219
components and cables (10 objects in total) requires one CAD drawing. Bearing this in mind, the 220
2976 objects (525 components plus 2451 cables) modelled in this case would require approximately 221
297 CAD drawings, which is akin to the number supplied. Love et al. (2013) also revealed that 40 222
man-hours, on average, were required to produce each CAD drawing of an ECIS design. Thus, it 223
is estimated that a total of 10,680 man-hours would be required to produce the 267 drawings. In 224
addition, producing a complete set of 1800 project drawings would require a total of 72,000 man-225
hours. Having established an estimate of workload, the quality of the ‘As-built’ documentation, as 226
a result of creating the SIM, could now be assessed in accordance with the information redundancy 227
and errors contained within the 267 electrical CAD drawings that were provided. 228
10 Evaluation of Documentation Quality
230
The frequency of components among various locations on the drawings is provided in Table 2. 231
From this table it can be seen that the number of components for the different Feeders are 232
analogous. The Feeders were designed to perform similar functions, which has resulted in their 233
configurations and the connections of components and cables being related. In fact, a detailed 234
examination of relevant drawings revealed that the majority of components installed on each of 235
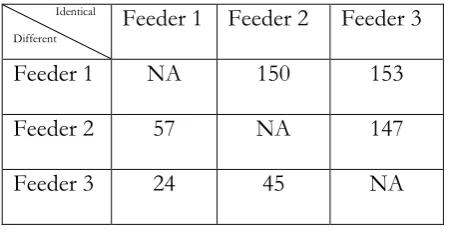
the three Feeders were identical. Table 3 illustrates the distributions of those identical/ different 236
components that have been used by comparing each pair of the Feeders. The upper triangular 237
elements in Table 3 identifies the number of identical components that appear in the Feeders. The 238
lower triangular elements in Table 3 indicates the number of different components between any 239
two different Feeders. 240
241
Table 2. Distribution of components 242
243
Location Number of components
Feeder 1 174
Feeder 2 183
Feeder 3 156
Relay Room 8
Station Transformer 1
Water Control Room 3
Total 525
244
Table 3. Components comparison between Feeders 245
246
Identical
Different
Feeder 1 Feeder 2 Feeder 3
Feeder 1 NA 150 153
Feeder 2 57 NA 147
Feeder 3 24 45 NA
247
When Feeder 1 is compared with Feeder 2, a total of 150 identical and 57 different components 248
(24 from Feeder 1 and 33 from Feeder 2) are detected. Explicitly, most of the components (over 249
11
the SIM is significantly reduced, especially as software such as DAD provides the users with 251
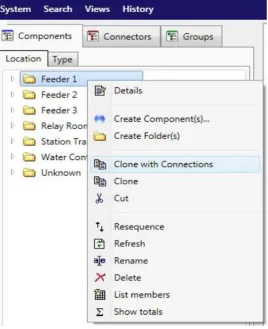
functionality that enables them to reproduce models using a ‘Clone’ command (Figure 4). Figure 252
4 illustrates the two options provided to users; namely: 1) ‘Clone’; and 2) ‘Clone with Connections’. 253
If the ‘Clone’ command is used, only the chosen components are replicated. If the ‘Clone with 254
Connections’ command is used, both the components and cables are replicated. Noteworthy, all 255
the objects that are cloned will have identical features and attributes as their source objects. 256
257
258
Figure 4. ‘Clone’ Function 259
260
As the functionality of the components and cables are similar for each of the Feeders, the function 261
‘Clone with Connections’ is used. The creation of the SIM for Feeder 1 is first developed and on 262
completion is cloned to produce the models for Feeders 2 and 3. Then, the cables from the Feeders 263
and control rooms are joined to form a single SIM. From Tables 2 and 3 it can be seen that through 264
‘cloning’, 82% of the components in Feeder 2 and 98% of the components in Feeder 3 can be 265
modelled instantly by replicating the corresponding components in Feeder 1. On completion of 266
the model for Feeder 1, those for Feeder 2 and Feeder 3 are also deemed to be almost finished. 267
12
by as much as two-thirds. When CAD is employed, each Feeder requires a specific set of drawings 269
with the same information being reproduced (Table 1). These drawings are produced manually 270
and as a result of complex relationships between components and cables, and the need to ensure 271
the traceability of information, this becomes an arduous and tedious task for engineers and 272
draftsmen. This manually-laden process significantly increases the propensity for human errors 273
and omissions to be committed. 274
275
Information Redundancy
276
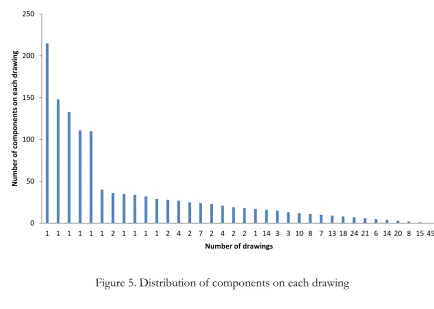
The distribution of components contained within the drawings was also examined. Figure 5 277
illustrates the distribution of the 525 components on each of the 267 CAD drawings; five drawings 278
each contained over 100 components whilst one contained more than 200 components. This 279
finding was expected as these drawings were common for all Feeders containing the definitions 280
and designations of the components. However, 45 drawings had no components recorded on 281
them. Essentially, they consisted of cover sheets, index and definition of drawings, which are time-282
consuming and expensive to develop, but do not provide adequate information to ensure system 283
integrity. 284
285
Most information contained on drawings was considered irrelevant to the electrical system design 286
by the engineers (not sure that you say anywhere how many engineers were spoken to? Maybe add 287
this detail earlier in the narrative?) who actively participated with researchers; the information 288
mainly pertained to recording the title block, document number, revisions, drawing sheet 289
specifications and notions. Documenting such information is an onerous and costly process and 290
is typically the responsibility of a draftsman. If a mistake or omission arises a new revision of the 291
entire drawing will have to be reproduced and reissued. This is an inefficient and ineffective 292
method, which adversely impacts the productivity of the design and documentation process (Love 293
et al., 2014). Pete – this text here seems like a repeat of earlier text…. 294
295
The number of drawings that are linked to each component was calculated and thus provided a 296
measure of system design complexity. Research revealed that, on average, each component could 297
approximately be presented on five various drawings (Love et al., 2013; 2014). This figure Figure 298
5? typically provides the basis for determining the estimated workload prior to performing the task 299
of producing the detailed design. 300
13 302
Figure 5. Distribution of components on each drawing 303
304
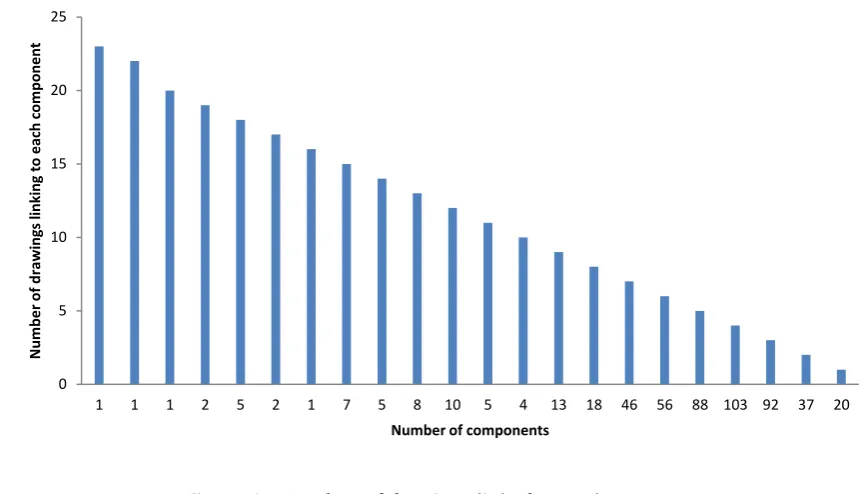
Figure 6 illustrates that a significant number of components appeared on more than ten drawings 305
and three occurring on more than 20 drawings Not quite sure what you mean here. Most of these 306
components are 48 pin sockets and terminal blocks, which are connected to multiple pieces of 307
equipment. Considering the sheer number of components that were documented on a widespread 308
of drawings, the propensity for draftsman to create an error (by placing sockets in the wrong 309
location) significantly increases. A majority of the components (total 422 components, over 80% 310
of the 525 components) were found to reside on two to seven drawings. In this instance, each 311
component will appear on average on 4.4 drawings, which is akin to empirical research 312
promulgated by Love et al. (2013; 2014). Thus, the design complexity is considered to be ‘standard’ 313
in this case. 314
315
As the original design was documented using CAD, each of the components would have been 316
manually reproduced approximately five times on different drawings. Engineers and draftsmen 317
must determine the types of drawings required (e.g., block, layout and schematic) and the 318
information contained within each to facilitate effective communication amongst all projects 319
parties regards what is to be physically constructed and installed. Noteworthy, no universal 320
standard exists for documenting and producing different electrical drawings, which can hinder an 321
engineer’s ability to understand them. When errors or omissions are identified on a drawing, the 322
0 50 100 150 200 250
1 1 1 1 1 1 2 1 1 1 1 2 4 2 7 2 4 2 2 1 14 3 3 10 8 7 13 18 24 21 6 14 20 8 15 45
Num
be
r
of
com
pone
nt
s
on
e
ach
dr
awi
ng
14
contractor’s engineer must examine all other related drawings and documents to determine which 323
one is correct or simply raise a RFI; either way these are non-value adding activities. 324
325
Figure 6. Number of drawings linked to each component 326
Error Identification
327
During the creation of the SIM, a plethora of errors (frequency (f) = 89) and omissions (f = 49) 328
were discovered on the CAD drawings (Table 4 not sure we need this table when it can be 329
explained in the text). For example, in Figure 7, it is shown that terminals X1 and X2 of a ‘pressure 330
switch F250’ are connected to terminals A11 and A10 of a socket X250, respectively. However, 331
the terminal X0 of F250 is connected to terminal B12 of X250, which is shown to be unusual 332
compared with the connections (Y terminals) next to it; all the three Y terminals (Y0, Y1 and Y2) 333
are connected to terminals B3, B2 and B1 of X250 respectively. Notably, there is no mismatch 334
between A and B terminals. An examination of the drawings revealed that the ‘pressure switch 335
F250’ appeared on eight drawings and the socket X250 on 14 of them. 336
337
0 5 10 15 20 25
1 1 1 2 5 2 1 7 5 8 10 5 4 13 18 46 56 88 103 92 37 20
Num
be
r
of
drawi
ng
s
linki
ng
t
o each
com
pone
nt
15 338
Figure 7. An example of error: incorrect terminal 339
340
The auxiliary contact K208 connected to X250 was found to occur on nine drawings. By examining 341
the related drawings three of them indicated that the terminal A12 had been mislabelled as B12. 342
If the site engineer had terminated the cables, as indicated by the drawing, the devices would have 343
malfunctioned and thus jeopardizing the integrity and safety of the entire plant. The pressure 344
switch is a critical component of the high voltage switchgear systems, which deals with the 138kV 345
power circuit. A ‘mistrip’ of the equipment could have catastrophic consequences for the 346
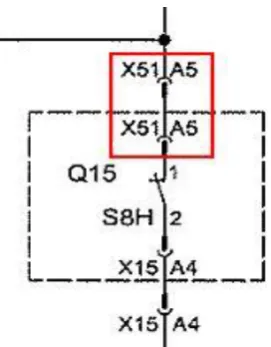
downstream devices and users. Similarly, the error identified in Figure 8 illustrates that terminal 1 347
of contact S8H had been connected to the terminal A5 of socket X51. However, the correct 348
connection should be terminal A5 of socket X15. 349
350
351
16
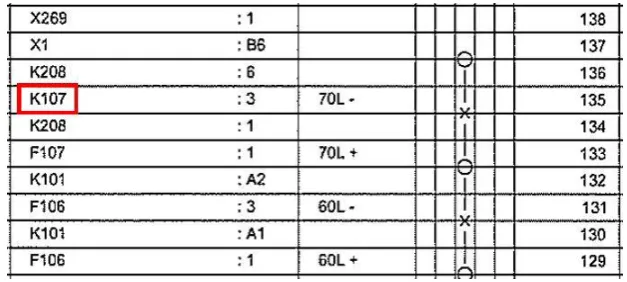
Figure 9 illustrates an error identified in a termination diagram. It is shown in Figure 9 that terminal 353
135 of a terminal strip is connected to the auxiliary relay K107. However, by checking the related 354
drawings of the terminal strip it could be concluded that the terminal should be connected to 355
circuit breaker F107 instead. 356
357
358
Figure 9. An example of error: incorrect equipment 359
360
Using a SIM to document the design of ECIS is more effective and efficient than using the CAD. 361
A total of 80 man-hours was required for an engineer to create the SIM model for three Feeders 362
compared to the 10,680 man-hours required using CAD. Assuming the hourly rate for a draftsman 363
is AU$130 (this is the current market rate circa Sept. 2015), this equates to a saving of $1,401,400 364
for a client or greater profits for the contractor. In addition to this saving, information redundancy 365
is removed and errors or omissions are eliminated. 366
367
Discussion 368
‘As-built’ drawings seldom represent what has actually be constructed; this represents a persistent 369
issue that is widely known amongst practitioners. This exposes an asset owner to elevated risk 370
levels and adversely affects their ability to conduct operations and maintenance productively and 371
safely. Needless to say, this does not necessarily mean what was actually installed was in accordance 372
with the drawings; they may not have been simply up-dated by the engineers and draftsmen. 373
Accordingly, the process of identifying and communicating errors to all project parties, and 374
subsequently, the rectifying and up-dating of drawing comes into question A bit woolly Petey – 375
can we be a bit more precise here? 376
377
When confronted with time and resource constraints, engineers and draftsmen the sheer number 378
17
or imminent documents are modified. A plethora of scenarios may unfold here, but fundamentally 380
the way in which ECIS are designed and documented needs to change in order to improve the 381
integrity of assets, productivity and the competitiveness of firms specializing in providing design, 382
engineering and contracting services. With the advent of BIM, it is expected that ECIS firms would 383
adopt object-orientated approaches to align themselves with other disciplines and feed directly 384
into a project’s federated building information model. Explicitly, this is not the case and Hanna et
385
al. (2013; 2014) reports upon the reluctance of electrical contractors to embrace BIM. In addressing 386
this issue, education is pivotal to ensuring its BIM’s or SIM? adoption, particularly as it requires 387
engineers to switch from CAD to a new digital vis-a-vis paper based medium. Research, presented 388
in this paper, provides a mechanism for ECIS engineers and contractors to realize that design and 389
documentation can be undertaken more effectively and efficiently using a SIM, which is aligned 390
with BIM. 391
392
Conclusion 393
Pete the conclusion is the weak link for me – as it represents a partial summary of the narrative 394
not a conclusion of it. I personally would change tack and starts by introducing the problem and 395
stating how much of a problem this is. Then go into some of what you did and quantify the 396
palpable benefits of it as a means of demonstrating the value of this important work. I would 397
conclude by discussing some of the issued that will be faced by culturally trying to reorientate a 398
whole industry to this new method of working and what may be need to assist in this process. 399
Maybe a final line then to just suggest some direction for future work… just my initial thoughts 400
and happy to review this section again 401
The quality of the ‘As-built’ documentation produced using CAD for a HVSS, which formed part 402
of an up-grade of a SCADA for a geo-thermal power plant were evaluated. A total of 267 CAD 403
drawings were examined for their errors and information redundancy and then used to create a 404
SIM. The creation of the SIM required 80 man-hours, while to create the 267 CAD drawings 405
required 10,860; a difference of 10,780. The empirical evidence clearly demonstrates that 406
organizations that provide ECIS engineering and contracting services need to shift their mindsets 407
from using CAD based systems where there exists a 1:n relationship, to one that focuses on 408
establishing a 1:1 relationship between objects in the SIM and components in the real world. In 409
doing so, it suggested that they will significantly improve the quality of their service, productivity 410
and their competitiveness within their respective marketplaces. 411
18 Acknowledgments
413
The authors would like to thank the participating contracting organization for making available 414
this invaluable case study and providing access to the Dynamic Asset Documentation (DAD) 415
Software. The authors would also like to acknowledge the financial support provided by the 416
Australian Research Council (DP130103018), which enabled this research to be undertaken. 417
References References are a little light on the ground – I’ve highlighted places where a 418
few more could be added to establish the context. Not essential though – more of a 419
thought…. 420
Clayton, M.J. Johnson, R.E., Song, Y., and Al-Qawasmi, J. (1998). A Study of Information Content 421
of As-Built Drawings for USAA. CRS Center Texas A&M University and USAA Facilities 422
and Services, January (Accessed 18th June 2015, available at:
423
https://www.researchgate.net/publication/254694636_A_STUDY_OF_INFORMATION_CONTENT_OF_AS-424
BUILT_DRAWINGS_FOR_USAA) 425
Gallaher, M.P., O’Connor, Dettbarn, J.L., and Gilday, L.T. (2004). Cost Analysis of Inadequate
426
Interoperability in the US Capital Facilities Industry. US Department of Commerce Technology 427
Administration, National Institute of Standards and Technology, Gaithersburg, Maryland, 428
US. 429
Hanna, A.S. Boodai, F., and El Asmar, M. (2013). State of practice of building information 430
modelling in mechanical and electrical construction industries. ASCE Journal of Construction
431
Engineering and Management, 139(10), pp. 432
Hanna, A.S., Yeutter, M., and Aoun, D.G. (2014). State of practice of building information 433
modelling in the electrical construction industry. ASCE Journal of Construction, Engineering and
434
Management, 140(12), pp. 435
Lopez, R., and Love, P.E.D., (2012). Deign error costs in construction. ASCE Journal of Construction,
436
Engineering and Management138(5), pp.585-594. 437
Love, P.E.D. Zhou, J., Sing, C-P. and Kim, J.T. (2013). Documentation errors in instrumentation 438
and electrical systems: Toward productivity improvement using system information 439
modelling. Automation in Construction, 35, pp.448-459. 440
Love, P.E.D., Zhou, J., and Kim, J.T (2014). Assessing the impact of requests for information in 441
electrical and instrumentation engineering contracts. Journal of Engineering Design, 25 (4-6), 442
pp.177-193. 443
Love, P.E.D., Zhou, J. Matthews, J. and Carey, B. (2015). Toward productivity improvement using 444
a systems information model. International Journal of Productivity and Performance Management, 445
Mills, A.J., Durepos, G., and Wiebe, E. (2010). Encyclopaedia of Case Study Research. SAGE 446
19
Robson, C. (1993). Real World Research: A Resource for Social Scientists and Practitioner-Researchers. 448
Blackwell Publishers, Oxford. 449
Tadt, E. Hanna, A., and White, D. (2012). Best practices from WisDOT Mega and ARRA Projects 450
—request for information: benchmarks and metrics. WisDOT Policy Research Program 451
Project, ID: 0092-1-20, Final Report, March 2012, Submitted to the Wisconsin Department 452
of Transportation by the Construction and Materials Support Center, University of 453
Wisconsin, Wisconsin, USA, 2012. 454
Zhou, J., Love, P.E.D., Matthews, J., Carey, B. and Sing, C-P. (2015). An object oriented model for life
455
cycle management of electrical instrumentation control projects. Automation in Construction, 49,
456
pp.142-151
457
458