Article 1
Study on Charging Method Selection According to
2Public-Sector Electric Vehicle Operating Environment
3Dan-Bi Bak1, Jae-Seok Bak2, and Sung-Yul Kim* 4
1 Affiliation 1; [email protected] 5
2 Affiliation 2; [email protected] 6
* Correspondence: [email protected]; Tel.: +82-053-580-5251 7
8
Received: date; Accepted: date; Published: date 9
Abstract: South Korea proposed reducing greenhouse gas emissions by 37% compared to the expected emissions 10
by 2030 as the POST-2020 greenhouse gas reduction target. Electric vehicle distribution in the public sector is 11
essential to achieve the carbon dioxide reduction target for transportation. In particular, when buses with 12
internal combustion engines, which travel long distances and contribute substantially to greenhouse gas 13
emissions, are replaced with electric buses, it is expected that greenhouse gas emissions will be significantly 14
reduced. There are three types of electric buses with different power supply systems: a plug-in type in which 15
power is supplied when a plug is inserted, a battery-swapping type in which a battery mounted on top of the 16
vehicle is swapped at a swapping station, and a wireless type in which the battery is wirelessly charged through 17
self-induction at a charging facility installed on the road. Vehicles of each charging type have different 18
advantages and disadvantages. The performance, charging type, battery capacity, and operating environment of 19
electric buses are mutually related parameters that must be considered when introducing such vehicles. 20
Therefore, the optimal charging type must be selected according to the operating environment to enable the 21
widespread use of electric buses. As such, this report proposes the optimal charging type according to the 22
operating environment of public-sector electric vehicles. 23
Keywords: Public sector, operating environment, electric bus, optimal charging type, charging infrastructure 24
Nomenclature 25
Annual electric bus energy-saving benefit compared to compressed natural gas (CNG) bus [$]
26
Annual CNG bus energy-saving benefit [$]
27
Annual electric bus energy-saving benefit [$]
28
Annual maintenance cost saving benefit [$]
29
Annual electric bus fare benefit [$]
30
Annual electric bus total benefit [$]
31
Battery cost [$]
32
Battery wear cost [$]
33
Battery replacement cost [$]
34
Annual CNG cost [$/ m3]
35
Annual electricity cost [$/kWh]
36
Electric bus initial infrastructure construction cost [$]
37 ene y B , ene cng y B , ene ev y B om y B oper y B total y B bat C , bat wear C , bat exc y C cng y C ev y C inf y C
Annual electric bus infrastructure maintenance cost [$]
38
Electric bus fare [$]
39
Electric bus subsidy [$]
40
Annual electric bus total cost [$]
41
Electric bus actual purchase cost [$]
42
Electric bus initial purchase cost [$]
43
Electric bus battery capacity [kWh]
44
Electric bus battery discharge amount [kWh]
45
Electric bus battery capacity (before considering state of charge (SOC)) [kWh]
46
Number of electric buses
47
Electric motor energy consumption [kW]
48
Electric bus charging power [kW]
49
Discount rate
50
Battery maximum SOC
51
Battery SOC at time t
52
Electric bus charging time [s]
53
Electric bus headway [s]
54
Electric bus average velocity [km/h]
55
Bus travel distance [km]
56
Analysis time [yr]
57
CNG bus fuel efficiency [km/m3]
58
Electric bus fuel efficiency [km/kWh]
59
Annual number of bus passengers [people]
60 Charging efficiency 61 Discharge efficiency 62 1. Introduction 63
Recently, interest in environmental issues has been increasing owing to CO2 emission control 64
reinforcement and the greenhouse gas emissions caused by increased fossil fuel use. The
65
transportation sector accounts for a significant proportion of fossil fuel consumption, and global
66
efforts have therefore been made to develop public transportation systems based on electric vehicles
67
to reduce the greenhouse gas emissions of the transportation sector [1–3].
68
In major Asian and European cities, electric vehicles with CO2 emissions lower than those of 69
conventional internal combustion engine vehicles have emerged in urban transportation [4–9].
70
Although the high initial costs of electric vehicles remain a major obstacle to their widespread use,
71
their application will be promoted by European companies and led by Chinese automakers.
72
Currently, China is the top producer and consumer of electric commercial vehicles, such as electric
73
buses, taxis, and trucks, in the world. It is becoming the world leader in terms of the key technologies
as well as market size. Accordingly, Beijing established a policy that 80% of all buses will be replaced
75
with electric buses by 2019 and is providing purchase subsidies for electric buses and operating
76
subsidies of up to RMB 80,000 per year. In addition to China, the U.S. and Europe are developing and
77
producing electric vehicles with various performance levels, and the penetration of electric vehicles
78
into the public sector is being promoted through government funding and incentive policies [10].
79
Many studies on electric vehicles have also been conducted in South Korea. Accordingly, various
80
efforts are being made to increase the utilization of electric vehicles. For instance, plug-in charging-type
81
electric buses were introduced into city bus routes in November 2016 [3]. South Korea has performed
82
small-scale electric bus demonstration projects, and many local governments, including that of Jeju Island,
83
are pursuing the active use of electric buses. In addition, Daegu City has been performing a demonstration
84
project for electric taxi distribution since 2016 with the objective of becoming a leading city for electric
85
vehicles. It has a goal of distributing 2000 electric vehicles by 2020.
86
According to the International Energy Agency (IEA), the primary obstacles to electric vehicle
87
penetration include their high purchase prices, the shortage of charging infrastructure, and the
88
battery service life. Thus, these factors must be considered to achieve the commercialization and
89
popularization of electric vehicles in the public sector [10]. Accordingly, various studies have been
90
conducted to realize this objective. For instance [11–13] present analyses of charging infrastructure
91
placement cases conducted with the goal of minimizing the total installation costs of electric bus
92
charging stations. However, the techniques proposed therein can only be applied under specific
93
conditions, because all of the electric buses must be of the same charging type. Meanwhile, [14–18]
94
describe analyses conducted using application programs, such as genetic algorithms, to construct the
95
optimal charging infrastructure for electric vehicles. The results of those studies also can only be
96
applied under specific conditions, even though the distance between charging locations was
97
optimized and the charging infrastructure was analyzed for cost minimization. In addition, Chan [19]
98
performed feasibility assessment considering the technical limits of electric buses, but it was assumed
99
that all of the electric buses were charged with the same capacity for the same time period.
100
Electric buses of each charging type have different advantages and disadvantages. The
101
performance, battery capacity, and operating environment of electric buses are mutually related
102
parameters that must all be considered when introducing such vehicles. Therefore, the optimal
103
charging type must be selected according to the operating environment to enable the widespread use
104
of electric buses in the public sector. As such, the battery capacity was estimated in this study
105
considering the depth of discharge (DOD) range and wear cost of electric buses. In addition, the
106
number of additional electric buses required beyond the number of existing compressed natural gas
107
(CNG) buses was estimated by considering the electric bus charging time by performing energy
108
consumption analysis according to the electric bus operating environment. Based on the results, the
109
optimal charging type was proposed and economic efficiency analysis of the bus routes in Daegu
110
City, South Korea, was performed for verification.
111
2. Electric Bus Characteristics by Charging Type 112
Electric buses can be classified into three types according to the charging method: plug-in,
battery-113
swapping, and wireless. For a plug-in bus, the charging facility costs are low and the required facilities
114
are simple because the battery in such a vehicle is charged simply by using a plug at a charging facility.
115
Owing to the battery charging time, however, additional electric buses are required to maintain the
116
existing bus headway.
117
Meanwhile, a battery-swapping vehicle is operated by driving its electric motor with electrical
118
energy through a detachable battery mounted on the vehicle, and additional electric buses are
119
unnecessary because no extra time is required other than the time for battery replacement. However,
120
the initial infrastructure construction costs associated with this type of vehicle are significantly higher
121
than those associated with vehicles of the other charging types. This drawback can be minimized by
installing charging stations at the intersections of multiple routes, because the initial infrastructure
123
construction costs can be reduced based on the operation rate of each route.
124
Finally, a wireless charging vehicle converts the magnetic field generated by the electric wires
125
buried under the road into electrical energy by employing a current collector mounted underneath
126
the vehicle and performs battery charging and driving using this energy. While this method enables
127
battery charging during vehicle operation, the charging efficiencies of such vehicles are lower than
128
those of vehicles of the other charging types, the initial infrastructure construction costs are somewhat
129
higher than those of plug-in vehicles, and additional electric buses are required to maintain the
130
existing bus headway. Table 1 summarizes the characteristics of electric buses based on a battery
131
capacity of 100 kWh according to charging type.
132
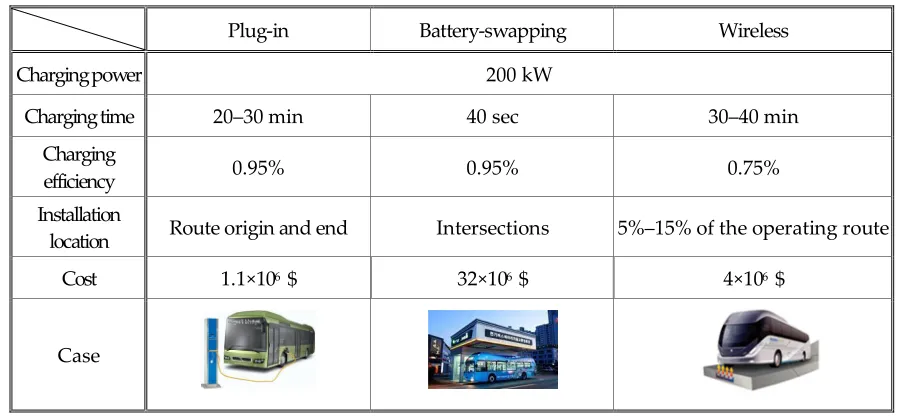
Table 1. Electric bus characteristics by charging type. 133
Plug-in Battery-swapping Wireless
Charging power 200 kW
Charging time 20–30 min 40 sec 30–40 min
Charging
efficiency 0.95% 0.95% 0.75%
Installation
location Route origin and end Intersections 5%–15% of the operating route
Cost 1.1×10⁶ $ 32×106 $ 4×10⁶ $
Case
3. Public-Sector Bus Battery Capacity Estimation 134
3.1 Battery DOD Range Estimation 135
According to the IEA, battery service life is a major obstacle to the distribution of electric vehicles
136
and therefore must be considered to commercialize and popularize electric buses. Thus, the battery
137
capacity that can be used during the service life according to the DOD selection must be calculated,
138
and the DOD that provides the largest total usable capacity must be selected. Figure 1 shows the
139
dependence of the service life a lithium-ion battery on the DOD, demonstrating that the DOD is
140
inversely proportional to the service life. However, when the DOD is reduced to extend the service
141
life using this relationship, the battery cannot be used efficiently because its total usable capacity is
142
decreased. Therefore, the battery degradation cost should be calculated according to the DOD from
143
the DOD-cycle curve so that the battery can be operated in the interval in which the degradation cost
144
is minimized. The battery degradation cost can be calculated according to the DOD as follows [21]:
145
. (1)
146
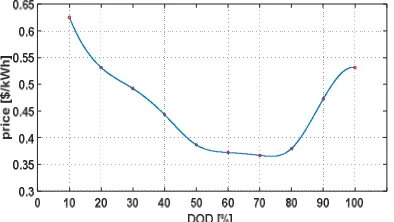
Figure 2 depicts the battery degradation cost for battery cycling within a specific state of charge
147
(SOC) range. The degradation cost of a 100 kWh battery was analyzed using the DOD-cycle graph in
148
Figure 1. It was assumed that the battery price was 273 $/kWh and the discharge efficiency was 0.97.
149
The appropriate DOD was found to be 75% considering battery degradation [22, 23].
150
deg
××××
151
Figure 1. Lithium-ion DOD cycle life model. 152
153
Figure 2. Battery degradation cost by DOD. 154
3.2 Battery Capacity Estimation 155
In this section, battery capacity estimation considering the all-electric range (AER), battery DOD,
156
and vehicle specifications is presented. The battery capacity can be estimated using Equation (2), and
157
the energy consumption can be calculated based on the power consumed by the electric motor, as
158
shown in Equation (3) [20]:
159
(2)
160
and
161
. (3)
162
The vehicle parameters in Equation (3) are defined as shown in Table 2.
163
Table 2. Vehicle parameters. 164
Symbol Property Unit Value
Motor drive efficiencies - 0.91
Vehicle mass kg 16,236
Gravity m/s2 9.81
Rolling resistance coefficient - 0.01 Air density kg/m3 1.23
Aerodynamic drag coefficient - 0.7
Frontal area m2 7.8965
Mass factor - 0.04
165
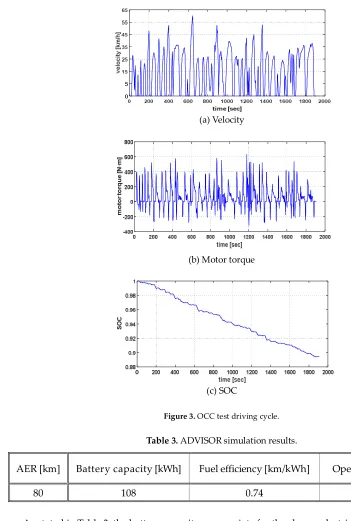
The battery capacity was analyzed according to the electric bus AER using the MATLAB-based vehicle
166
simulation program ADVISOR. The Orange County bus cycle (OCC) test was performed based on actual
167
bus operating data, and the results are presented in Figure 3.
168
For the electric bus AER, 80 km was used, as specified by the Ministry of Environment. Table 3
169
summarizes the battery capacity results obtained from the simulation.
170 171
172
(a) Velocity 173
174
(b) Motor torque 175
176
(c) SOC 177
Figure 3. OCC test driving cycle. 178
Table 3. ADVISOR simulation results. 179
AER [km] Battery capacity [kWh] Fuel efficiency [km/kWh] Operating time [sec]
80 108 0.74 13,744
180
As stated in Table 3, the battery capacity appropriate for the chosen electric bus AER is 108 kWh.
181
In this case, the fuel efficiency is approximately 0.74 km/kWh. Using Equation (4), the battery capacity in
182
Table 3 was recalculated considering the DOD and was found to be 144 kWh when a DOD of 75%
183
was applied, as shown in Figure 2:
184
. (4)
185
4. Public-Sector Electric Bus Operating Environment Analysis 186
The operating environment of electric buses is the same as that of the existing CNG buses, but
187
battery charging time is required owing to the energy consumption during operation. Therefore, the
188
number of additional buses required to compensate for the battery charging time must be estimated
189
to maintain the same headway as that of the existing CNG buses. In this section, analyses of the charging
190
time and number of additional buses required according to the battery energy consumption, which
191
depends on the electric bus operating environment, are presented.
192
4.1 Energy Consumption Dependence on Electric Bus Operating Environment 193
The electrical energy consumed internally during electric bus operation can be obtained based
194
on the amount of battery discharge, as shown in Equation (5):
195
. (5) 196
In this case, the fuel efficiency accounts for the passenger and cooling/heating ratios at time t.
197
4.2 Electric Bus Charging Time 198
The electric bus charging time is defined as the time it takes to replace the electrical energy
199
consumed internally during operation and can be calculated based on the SOC at time t after
200
operation, as shown in Equation (6):
201
. (6)
202
4.3 Number of Additional Electrical Buses Required Considering Charging Time 203
When the electric bus charging time is longer than the headway, additional electric buses are
204
required to maintain the same operating environment as that of the existing CNG buses. The number
205
of additional electric buses required can be calculated using Equation (7):
206
. (7)
207
5. Public-Sector Electric Bus Economic Efficiency Analysis 208
5.1 Analysis Method 209
Economic efficiency analysis is employed to determine the feasibility of an investment project by
210
measuring its costs and benefits and calculating the resulting economic return. The quantities employed
211
in economic efficiency analysis include the benefit-cost ratio (B/C ratio), net present value (NPV), and
212
internal rate of return (IRR). Both the NPV and IRR are used to assess a project in which costs and
213
benefits occur in each time slot and have extremely similar ranges of use. Since the IRR cannot provide
214
theoretical background appropriate for making the final selection of an alternative while providing
215
results corresponding to various alternatives to the analyzer, the NPV is regarded as more appropriate
216
than the IRR in terms of project assessment. In this study, the economic efficiency of electric bus
217
operation was analyzed using the NPV, as shown in Equation (8):
218
. (8)
219
5.2 Cost Item Calculation 220
The cost for the economic efficiency assessment was calculated as follows:
221
. (9)
222
The total cost is given by the sum of the actual vehicle purchase and infrastructure construction
223
costs, which are the initial costs, and the maintenance and battery replacement costs, which are the
224
operating costs. As shown in Equations (10) and (11), the actual vehicle purchase cost can be
225
∙
m ax
∙
∙
determined by subtracting the vehicle subsidy from the vehicle purchase cost, and the maintenance
226
cost can be obtained by taking 8% of the infrastructure construction cost from the third year:
227
(10)eks159
228
and
229
. (11)
230
The overhead costs were assumed to be 18×103 $ per year in this study. The battery replacement 231
cost was determined according to the economic efficiency analysis period after the battery service life
232
was calculated using Figures 2 and 3.
233
5.3 Benefit Item Calculation 234
The total benefit is given by the sum of the energy and maintenance cost savings compared to those
235
of CNG buses and the profit from the fare, as shown in Equation (12):
236
. (12)
237
The benefit obtained from electric bus operation compared to CNG bus operation was calculated
238
as the energy cost saved, and the amount saved on periodic maintenance supplies, such as oil, was
239
calculated as the maintenance cost saved:
240
, (13)
241
, (14) 242
and
243
. (15) 244
The annual profit from the electric bus fare can be expressed as shown in Equation (16):
245
. (16)
246
6. Case Study 247
In this study, the battery capacity was calculated considering the battery DOD range and
248
degradation cost of public-sector electric buses. In addition, the number of additional electric buses
249
required beyond the number of existing CNG buses was analyzed considering the electric bus
250
charging time by performing energy consumption analysis according to the electric bus operating
251
environment. The optimal charging type was proposed based on the results, and economic efficiency
252
analysis of bus routes 518, 708, and Express 5 in Daegu City, South Korea, was performed for
253
verification. The economic efficiency analysis was conducted for plug-in, battery-swapping, and
254
wireless charging vehicles. The discount rate was set to 5.5%, and the analysis period was set to 20
255
years. As described in Section 3, the battery capacity was 144 kWh and the battery charging power
256
was 200 kW. In addition, the target electric buses achieved the average city bus velocity of 20 km/h.
257
Figure 4 provides a map of the three investigated bus routes, and Table 4 describes the operating
258
environment of each route. The analysis of the numbers of additional electric buses required beyond
259
the numbers of existing CNG buses considering the electric bus charging time based on these
260
operating environments indicated that routes 518 and Express 5 each required two additional vehicles
261
to maintain the same operating environment as that of the current CNG buses.
262
∙
∙
∙ ∙
∙ ∙
Figure 4. Map of routes 518, 708, and Express 5 in Daegu City, South Korea. 263
Table 4. Existing CNG bus operating environment by route. 264
Route No. of buses Operating distance [km] Operating time [min]
518 22 39.87 128
708 13 41.98 124
Express 5 28 40.81 114
265
The fuel efficiencies employed to determine the internal electrical energy consumption during
266
operation were recalculated considering the passenger and cooling/heating ratios at time t, as shown
267
in Table 5.
268
Table 5. Use rate and fuel efficiency by time slot. 269
Time Use rate Fuel efficiency [km/kWh] Time Use rate Fuel efficiency [km/kWh]
5:00 0.009 0.8822 14:00 0.053 0.5556
6:00 0.028 0.7722 15:00 0.062 0.4949
7:00 0.065 0.4735 16:00 0.072 0.4399
8:00 0.079 0.4071 17:00 0.077 0.4141
9:00 0.060 0.5065 18:00 0.090 0.3692
10:00 0.050 0.5821 19:00 0.060 0.5025
11:00 0.050 0.5878 20:00 0.045 0.6385
12:00 0.055 0.5458 21:00 0.047 0.6183
13:00 0.056 0.5364 22:00 0.038 0.7379
270
The energy consumption due to electric bus operation was calculated using Equation (5) and Table
5. Economic efficiency analysis was performed by determining the energy consumption, charging time,
272
and number of additional electric buses required according to the electric bus operating distance and
273
headway. The cost items by bus were defined as shown in Table 5. The annual benefit of each bus due
274
to the fare was found to be 2,880×103 $, and the annual energy and maintenance cost savings due to 275
electric bus operation were determined to amount to 473×103 $. The fare in Daegu City was then 276
calculated by reflecting the annual discount rate of 5.5%, as shown in Table 6.
277
Table 6. Cost items per bus by electric bus charging type. 278
CNG Plug-in Battery-swapping Wireless
Vehicle cost [×103 $]
Vehicle cost 220 450 480
Vehicle subsidy 120 200
Actual vehicle
purchase cost 120 250 280
Infrastructure construction cost [×106 $] 7 1.10 32 4
Operating cost [$/km]
Fuel cost 0.46 0.13
Engine oil cost 0.01 -
Tire wear cost 0.01
Maintenance cost 0.02 0.01
279
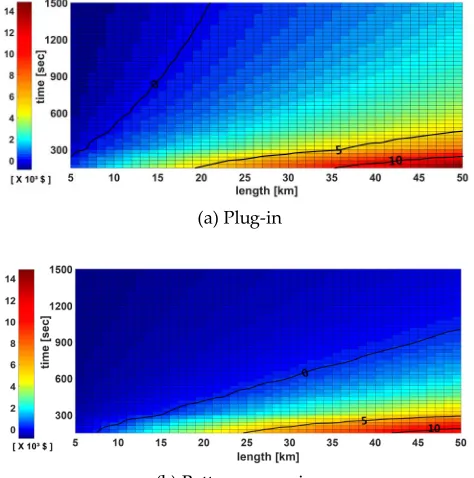
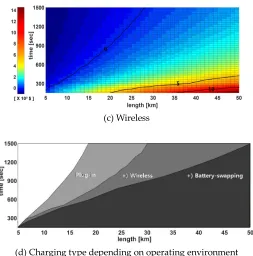
The analysis was conducted according to the driving distance and headway based on the
280
parameters suggested Table 4, Table 5. Additional electric buses were required depending on the
281
operating environment, and Figure 5 presents the NPV analysis results obtained considering this
282
factor. As shown in Figure 5(d), each charging type exhibits different NPV analysis results. The
283
charging types are not all economically efficient in operating environments in which the operating
284
distance is short and the headway is long.
285
286
(a) Plug-in 287
288
290
(c) Wireless 291
292
(d) Charging type depending on operating environment 293
Figure 5. NPV analysis according to operating distance and headway. 294
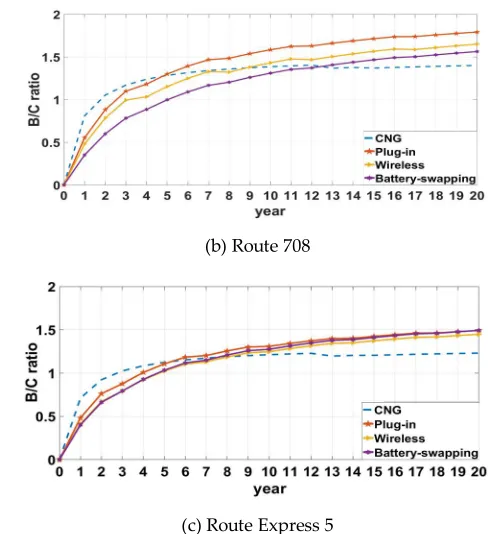
6.1 Economic Efficiency Analysis by Operating Route Based on Single Routes 295
Based on the actually operating single routes in Daegu City, South Korea, that are shown in
296
Figure 4, the economic efficiency of electric buses was analyzed according to the operating distance
297
and headway for each route by charging type, as shown in Figure 6. The CNT buses exhibit the
298
highest B/C ratios initially because only the infrastructure maintenance cost was considered upon
299
completion of infrastructure construction, unlike in the electric bus cases. However, with the total
300
analysis period of 20 years, the economic efficiency increases in the order of plug-in,
battery-301
swapping, and wireless vehicles for route 518. For route 708, the economic efficiency increases in the
302
order of plug-in, wireless, and battery-swapping vehicles. For route Express 5, which has more buses
303
and a shorter headway than route 708, the plug-in and battery-swapping vehicles show the same B/C
304
ratio, and the wireless charging vehicles exhibit high economic efficiency. As demonstrated by the
305
analysis results, plug-in vehicles are advantageous in operating environments with long headways,
306
while battery-swapping vehicles are preferable in operating environments with short headways.
307
However, the results confirm that electric buses are not economically efficient owing to the high initial
308
infrastructure construction costs for routes with short operating distances and long headways.
309
Therefore, the appropriate charging type differs even for the same electric bus operating environment
310
depending on various characteristics, such as the charging time, operating distance, and initial
311
infrastructure investment cost.
312
313
315
(b) Route 708 316
317
(c) Route Express 5 318
Figure 6. B/C ratio analysis per route. 319
6.2 Economic Efficiency Analysis by Operating Route Based on Composite Routes 320
This section presents the economic efficiency analysis conducted based on the actually operating
321
routes in Daegu City, for all of the routes operating at stop A in Figure 4. In this case, the operating
322
ratio is that of each route at stop A, and the characteristics of the routes operating at stop A are
323
summarized in Table 7.
324
Table 7. Operating environment by existing CNG bus route at stop A. 325
Route No. of buses Operating distance [km] Operating time [min] Operating ratio
156 19 25.58 96 0.1188
518 22 39.87 128 0.1375
651 19 32.73 114 0.1188
708 13 41.98 124 0.0813
808 12 35.73 106 0.0750
814 29 34.10 103 0.1813
849 5 13.12 85 0.0313
Express 5 28 40.81 114 0.1750
Bukgu 3 13 24.13 90 0.0813
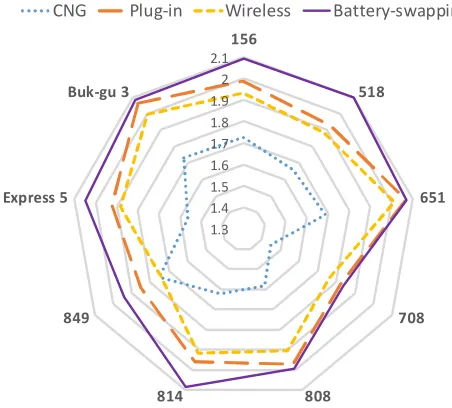
326
Using the operating ratios in Table 7, the economic efficiency of electric buses for 20 years was
327
analyzed based on composite routes according to the operating distance and headway for each route
328
by charging type. Figure 7 presents the results. Battery-swapping vehicles minimize the initial
329
infrastructure construction cost because the necessary infrastructure can be installed at the
330
construction cost of the battery-swapping vehicles, was applied to the operating ratio of each route at
332
stop A, and economic efficiency analysis was conducted for the composite routes. The
battery-333
swapping vehicles exhibit the highest economic efficiency for all of the routes at stop A. However, for
334
routes 651, 708, 808, and Bukgu 3, which have relatively lower operating ratios at stop A, the B/C
335
ratios of the battery-swapping vehicles are not significantly different from those of the plug-in
336
vehicles in spite of their high economic efficiency, as shown in Table 8.
337
338
Figure 7. B/C ratio analysis by composite route. 339
Table 8. B/C ratio analysis by composite route. 340
Route CNG Plug-in Wireless Battery-swapping
156 1.7280 1.9868 1.9336 2.0914
518 1.6606 1.9308 1.8841 2.0995
651 1.6859 2.0683 2.0122 2.0730
708 1.4487 1.8204 1.7623 1.8382
808 1.5816 1.9701 1.9043 1.9934
814 1.6212 1.9612 1.9184 2.0852
849 1.7540 1.8523 1.7432 1.9428
Express 5 1.5644 1.9222 1.8802 2.0491
Bukgu 3 1.7300 2.0624 1.9946 2.0832
341
In this section, the economic efficiency analysis of each route by charging type is presented for
342
single and composite routes. For the single routes, the plug-in vehicles with relatively lower initial
343
infrastructure construction costs provided the highest economic efficiencies. However, for Express 5,
344
which has a high operating ratio, the plug-in and battery-swapping vehicles yielded similar B/C ratios.
345
For the composite routes, the battery-swapping vehicles provided the highest economic efficiencies for
346
all of the routes, as determined by conducting economic efficiency analysis for 20 years, because the
347
initial infrastructure costs could be reduced according to the operating ratio of each route by installing
348
battery-swapping facilities at the intersections of multiple routes.
349
The charging type to be adopted differs depending on the operating environment of the route
350
1.3 1.4 1.5 1.6 1.7 1.8 1.9 2 2.1
156
518
651
708
808 814
849 Express 5
Buk-gu 3
in question, confirming that it is necessary to consider the electric bus operation routes when
351
designing electric bus charging infrastructure.
352
6. Conclusion 353
For the distribution of electric vehicles in the public sector, it is necessary to select appropriate
354
charging types and develop charging infrastructure according to the operating environment. For
355
electric buses, each charging type has different advantages and disadvantages, and the performance,
356
battery capacity, and operating environment of electric buses are mutually related parameters that
357
must be considered when introducing such vehicles. Accordingly, the operating environment must
358
be accounted for to determine the optimal charging type and thereby to enable the widespread use
359
of electric buses. Therefore, in this study, optimal charging type analysis was performed and charging
360
infrastructure construction plans were proposed according to the public-sector electric vehicle
361
operating environment.
362
The economic efficiency of each route for 20 years was analyzed, considering both single and
363
composite routes. For the single routes, the economic efficiency increased in the order of plug-in,
364
battery-swapping, and wireless vehicles according to the operating environment of the route. The
365
battery-swapping vehicles provided higher economic efficiencies than the plug-in vehicles for routes
366
with higher operating ratios. Meanwhile, for the composite routes, the initial infrastructure
367
construction costs could be reduced according to the operating ratio of each route by installing
battery-368
swapping facilities at the intersections of multiple routes. Accordingly, the battery-swapping vehicles
369
yielded the highest economic efficiencies for the composite routes. Therefore, the appropriate charging
370
type differed even for the same electric bus operating environment depending on characteristics such
371
as the charging time, operating distance, and initial infrastructure investment cost.
372
In the future, additional analysis of charging infrastructure construction plans according to the
373
operating environments of public-sector electric vehicles as well as analysis of the influences of the
374
power system and stabilization strategy are expected to contribute to the stable operation and
375
popularization of electric vehicles.
376
Acknowledgments:This research was funded by Korea Electric Power Corporation (grant number: R17XA05-47).
377
378
References
379
1. Marshall, B.M.; Kelly, J.C.; Lee, T.K.; Keoleian, G.A.; Filipi, Z. Environmental assessment of plug-in hybrid 380
electric vehicles using naturalistic drive cycles and vehicle travel patterns: A Michigan case study. Ener. Pol. 381
2013, 58, 356–370. 382
2. Jayakumar, A.; Chalmers, A.; Lie, T.T. Review of prospects for adoption of fuel cell electric vehicles in New 383
Zealand. IET Electr. Syst. Transp. 2017, 259–266. 384
3. Kim, J.G.; Lee, J.Y.; Ko, S.Y. Optimization of electric transit bus recharging stations in Jeju. J. Korean Urban 385
Geog. Soc. 2015, 18(2), 97–109. 386
4. Un-Noor, F.; Padmanaban, S.; Mihet-Popa, L.; Nurunnabi Mollah, M.; Hossain, E.; A comprehensive study 387
of key electric vehicle (EV) components, technologies, challenges, impacts, and future direction of 388
development. Energies, 2017, 10(8), 1217. 389
5. Wang, G.; Xu, Z.; Wen, F.; Wong, K.P. Traffic-constrained multiobjective planning of electric-vehicle 390
charging stations. IEEE Trans. Power Deliv. 2013, 28(4), 2363–2372. 391
6. Hajimiragha, A.; Canizares, C.A.; Fowler, M.W.; Elkamel, A. Optimal transition to plug-in hybrid electric 392
vehicles in Ontario, Canada, considering the electricity-grid limitations. IEEE Trans. Ind. Electron. 2010, 393
57(2), 690–701. 394
7. Lam, A.Y.S.; Leung, Y.W.; Chu, X. Electric vehicle charging station placement: Formulation, complexity, and 395
solutions. IEEE Trans. Smart Grid 2014, 5(6), 2846–2856. 396
8. Liu, Z.; Wen, F.; Ledwich, G. Optimal planning of electric-vehicle charging stations in distribution systems. 397
9. Sadeghi-Barzani, P.; Rajabi-Ghahnavieh, A.; Kazemi-Karegar, H. Optimal fast charging station placing and 399
sizing. Appl. Energy 2014, 125, 289–299. 400
10. Ministry of Trade, Industry and Energy. A study on the strategies to activate the electric vehicle in public 401
transport. 2016. 402
11. Lam, A.Y.S.; Leung, Y.W.; Chu, X. Electric vehicle charging station placement. In Proc. IEEE Int. Conf. Smart 403
Grid Commun. 2013, 510–515. 404
12. Su, C.L.; Leou, R.C.; Yang, J.C.; Lu, C.N. Optimal electric vehicle charging stations placement in distribution 405
systems. In Proc. 39th Annu. Conf. IEEE Ind. Electron. Soc. 2013; 2121–2126. 406
13. Baouche, F.; Billot, R.; Trigui, R.; El Faouzi, N.E. Efficient allocation of electric vehicles charging stations: 407
Optimization model and application to a dense urban network. IEEE Intell. Transp. Syst. Mag. 2014, 6(3), 33– 408
43. 409
14. Mehar, S.; Senouci, S.M.; An optimization location scheme for electric charging stations. In Proc. 2013 Int. 410
Conf. Smart Commun. Netw. Tech. (SaCoNeT), Paris, France, 2013; 17–19. 411
15. Pazouki, S.; Mohsenzadeh, A.; Haghifam, M.R.; Ardalan, S. Simultaneous allocation of charging stations 412
and capacitors in distribution networks improving voltage and power loss. Can. J. Electr. Comput. Eng. 2015, 413
38(28), 100–105. 414
16. Iversen, E.B.; Morales, J.M.; Madsen, H. Optimal charging of an electric vehicle using a Markov decision 415
process. Appl. Ener. 2014, 123, 1–12. 416
17. Dong, J.; Liu, C.; Lin, Z. Charging infrastructure planning for promoting battery electric vehicles: An 417
activity-based approach using multiday travel data. Transp. Res. Part C 2014, 38, 44–55. 418
18. Jaramillo, J.H.; Bhadury, J.; Batta, R. On the use of genetic algorithms to solve location problems. Comput. 419
Oper. Res. 2002, 29, 761–779. 420
19. Chan, J. A Feasibility Study on Introducing Electric Bus: Focused on Electric Bus in Seoul. University of 421
Seoul Graduate School: Traffic Engineering, Aug. 2013. 422
20. Ehsani, M. Modern Electric, Hybrid Electric, and Fuel Cell Vehicles Fundamentals, Theory, and Design, CRC Press, 423
2004. 424
21. Won, I.K.; Kim, D.Y.; Ko, A.Y.; Shin, C.H.; Hwang, J.H.; Kim, Y.R.; Won, C.Y. The prediction of total revenue 425
of V2G system considering battery wear cost. Journal of the Korean Institute of Illuminating and Electrical 426
Installation Engineers 2015, 29(4), 85–94. 427
22. Han, S.; Han, S.; Aki, H. A practical battery wear model for electric vehicle charging applications. Appl. 428
Ener. 2014, 113, 1100–1108. 429
23. Han, S.; Han S.H.; Economic feasibility of V2G frequency regulation in consideration of battery wear. 430
Energies 2013, 6(2), 748–765. 431
24. Bak, J.S.; Kim, S.Y.; Kim, D.M. A study on the economic analysis of introducing battery-based eco bus: Case 432