Type of the Paper (Article) 1
Applicability of Commonly Accepted Factors on
2preventing the Pit Latrines Correlated Ground Water
3Contamination in Kalpitiya Peninsula, Sri Lanka
4Ranjana U.K. Piyadasa1 & H.M.M. Sonali D. Herath 1 *
5
1 Department of Environmental Technology, Faculty of Technology,University of Colombo
6
* Correspondence: sonalidherath66@gmail.com; Tel.: +94-719799252
7
Abstract: The coastal dry zone areas of Sri Lanka mostly rely on ground water as the potable 8
drinking water source because pipe born water is rarely provided. Most of the domestic units 9
construct dug wells adjacent to houses where the ground water is exposed to fecal contamination 10
due to pit – latrines. There available standards and commonly accepted factors regulating the 11
construction of ground water extraction sources yet there is lack of evidence whether following 12
them effectively prevent ground water fecal contamination. This research focus on applicability of 13
commonly accepted factors on preventing the pit latrines correlated ground water contamination, 14
taking twenty (20) sampling locations of Kalpitiya Peninsula of Sri Lanka as the case study area. The 15
ground water was tested for Total coliform bacteria at 37 °C and E.Coil at 44 °C to identify the water 16
quality level related to fecal contamination. The depth of water table, gap of infiltration layer, depth 17
of latrine pit and distance between dug well and latrine pit were identified as the most commonly 18
considered factors. Accordingly, case specific and area specific reasons apart from the ‘commonly 19
accepted factors’ are highly influencing the pit latrines correlated ground water contamination in 20
Kalpitiya Peninsula, Sri Lanka. 21
Keywords: Ground Water; Pit Latrines; Fecal Contamination; Common factors 22
23
1. Introduction
24
Ground water is the extensively used water source in the developing countries of the world. 25
Especially Asian countries depend on this precious resource where Sri Lanka is not an exception. The 26
estimation of Sri Lankan ground water resources recorded as 7800 million m3 per year [7]. Shallow 27
dug wells and deeper tube wells serve as the drinking water source for more than 80% of the Dry 28
Zone coastal rural population of Sri Lanka [8]. Due to the vast utilization and less concern regarding 29
the hydrological cycle, ground water has become one of the fast diminishing resource. Available 30
ground water aquifers constantly threatened due to contamination caused futility. Among the 31
reasons of contamination, fecal matter contamination is one of the most hazardous reason [8]. Pit 32
latrines are the utmost popular method used in the rural coastal areas of the island for the disposal 33
of human excreta. Standards regarding the distance from human excreta disposal point and the 34
drinking water source which use ground water has been established in the country since Urban 35
Development Authority Act No 41 of 1978. Ever since it has been included in other laws such as Local 36
Authority laws and especially in the Public Health Inspector Manuals. Unlike in urban areas of the 37
country, land availability in rural areas lead these standards unintentionally followed in most cases. 38
Still, fecal matter contamination to the ground water highly considered as a matter which causes 39
waterborne diseases in rural coastal areas. The most high risk diseases namely ‘bacterial diarrhea’ 40
and ‘hepatitis A’ are the vastly recorded water borne diseases in Sri Lanka. These diseases are 41
considered as resultant due to usage of contaminated drinking water and accord for 12% of the 42
‘certain infectious and parasitic diseases’ caused deaths in year 2006 according to the records of 43
Department of Census & statistics. This rate has been doubled by the year 2012 where the number of 44
deaths were 403 in 2006 [1] and 705 in 2012 [16]. The figures indicate it is extremely important to 45
comprehend the reasons for ground water contamination due to fecal matter. This study focus on 46
opening a discussion to fill the gap on ‘does following the available regulations and standards matter 47
in lesser exposure to fecal contamination of ground water?’ The foremost objective of this paper is to 48
identify whether the commonly accepted factors on preventing the pit latrines correlated ground 49
water contamination are always applicable. 50
Ground water was vastly considered as filtered and purified by soil layers once the water entered to 51
the ground and while it flow through the soil. This fact later identified as not correct all the time since 52
microorganisms recognized as cultured in ground water same as they happen in surface water and 53
soil [6]. Even though there are particular bacteria in groundwater that convey favorable processes, 54
there are both bacteria and microorganisms which possibly cause diseases for human beings [3]. 55
Especially the pathogens that occur due to fecal contamination are considered as conveyers of deathly 56
diseases [16]. Basically, measuring the ground water quality related to fecal contamination carryout 57
using several laboratory tests for microbiology. The main parameters usually testing are Total 58
coliform, Fecal coliform, Enterococci, E. coli and Salmonella [2]. Among these the testing for Total 59
coliform count and E.coil test are considered as most important. Table (01) describes the Sri Lanka 60
standards 614 Part 2, 1983 which is valid up to present regarding the water quality measures related 61
to Total Coliform and E.coli availability in Ground water. 62
Table 1: Bacteriological Requirements for Potable Water (SLS 614 Part 2, 1983)
63
Source: Water Resources Board - Sri Lanka, 2016 [11] 64
The main source of ground water fecal contamination in developing countries has been identified as 65
pit latrines being in the proximity of drinking water source in number of studies [12]. Due to many 66
conditions and site specific reasons the pathogens cultured in pit latrines has been detected even 67
distant water sources more than 30 meters away from the latrine pit hence most of the regulations 68
and guidelines necessitate pit latrines to be 30 meters or more away from the water sources [12]. The 69
pathogens can transmit to ground water aquifers in two main ways. One is direct transmission where 70
the latrine pit directly contact with the ground water flow and the other is indirect transmission 71
where the pathogens diffuse with the seepage of latrine pit in to the saturated zone via soil layers 72
[10]. One of the vastly discussed reasons for both direct and indirect transmission of pathogens is the 73
distance between the dug/tube well and the pit latrine. Extreme distance a human excreta based 74
pathogen will transfer via a ground with favorable soil is as distant as the groundwater flows in ten 75
days in the particular area [5]. It is accepted that if the distance between wells and pit latrine is not 76
satisfactory, bacteria and microorganism pathogens can transfer from the latrine pit to the ground 77
water source [4]. When the parallel distance increases which the pathogens has to transmit into the 78
saturated zone from the pit latrine point, it is held over and the possibility of pathogen’s’ destruction 79
also increases [13]. This over and over proven factor has resultant guidelines to keep pit latrines and 80
the water sources apart. Table (2) indicates the guidelines used in Sri Lankan context compared with 81
the international guidelines. 82
83
Source of Water Total coliform count /100ml E.coil/100ml
Public water supply (Municipal supply, Water board supply)
3 Should be absent
Individual or small community supply (Wel / Tube well)
Table 2: Recommended setback distances for soakage pit
84
Source : (Werellagama and Hettiarachchi, 2004) [14] 85
Also the vertical separation between the latrine pit and the ground water table is considered as an 86
important factor which is considered as the ‘infiltration layer.’ When the infiltration layer is higher 87
additional time is added to the pathogens’ transmission procedure lowering the risk of ground water 88
contamination [13]. It is recommended that when the drinking water source is based on ground 89
water and a pit latrine is to be built in proximity, the well have to be dug higher than at least 15 meters 90
from the pit latrine [4]. The ground water level of a particular area is considered as another specific 91
reason for higher contamination exposure. If the ground water lens is in higher elevation level which 92
creates shallow aquifers or a higher ground water table, the risk factor to contamination arise due to 93
pit latrine is considerable [9]. According to Kimani & Ngindu (2003), commonly used guidelines in 94
most of the countries states that the pit latrine must be built at least 20 meters above the water table 95
[4]. To maintain these guidelines the pit latrine depth need to be decide wisely. Accordingly, this 96
literature review reveals that the distance between the ground water extraction source and the pit 97
latrine, infiltration layer, ground water level, elevation and latrine pit depth mainly accord for 98
availability of fecal contamination related pathogens in the ground water. There available different 99
guidelines in both local and international level to prevent the fecal contamination which has been 100
established upon various researches over time. Most of the studies in international context has proven 101
following the standards cause lesser risk of ground water contamination. Yet it is very rare to find 102
studies which has attempted to identify the effect of these guidelines in Sri Lankan context specially 103
the coastal dry zone where more than 90% of the population relying on ground water sources. Also 104
the standards provision in Sri Lanka is in half in figure when compared to the international figures. 105
Therefore it is very important to study pit latrines correlated ground water contamination in the 106
coastal dry zone of Sri Lanka. 107
2. Materials and Methods
108
Firstly the case study area was decided for the study as Kalpitiya peninsula which include in the 109
coastal dry zone of Sri Lanka. It was selected due to two main reasons. One is, Kalpitiya peninsula is 110
being included in the Shallow aquifer on coastal spits and bar type. Kapitiya peninsula is described 111
as a “compound spill” and it is shaped like a beckoning finger [8]. Second reason is unlike most areas 112
in the country, ground water is the only water source other than rain water in this area since no 113
surface fresh water sources available. Twenty (20) randomly picked sampling Dug Well locations 114
representing each portion of the peninsula were selected for the testing. Water samples were collected 115
using sterile glass bottles each tied with 3 to 5 meter lengthy threads. Two samples from each 116
sampling location were collected for Total coliform test and E.coli test. The samples were placed in a 117
container with ice as soon as collected and were transported to the laboratory within 8 hours. Two 118
days were spent for the sampling procedure due to the higher distance between the sampling 119
locations. GPS points were recorded in each point for identifying the position of the well and point 120
elevation of the place. In-situ measurements using tape measure were recorded regarding the 121
distance between nearest latrine pit to the sampling location, the depth of the sampling dug wells 122
and water level of the wells. The latrine users were consulted in order to get details regarding the 123
Standard Recommended Distance
PHI manual, Sri Lanka 15 m / 50 feet
Sri Lanka Standards (SLS) 745 18 m / 59 feet
USA (Federal regulations) 30 m / 98 feet
latrine pit depth and the conditions of latrine pit construction. In-situ observation regarding the 124
condition of the dug wells, land uses and the on-site situation were recorded regarding each location. 125
Number present in 100ml of sample where Total coliform bacteria at 37 °C and E.Coil at 44 °C was 126
the test method used in the laboratory in order to determine the presence of pathogens in the 127
Sampling Dug Well locations. Comparing the results with the Bacteriological Requirements for 128
Potable Water (SLS 614 Part 2, 1983), sampling dug well locations were put in to two categories as 129
‘Satisfactory’ and ‘Unsatisfactory’. The water levels of dug wells were subtracted from point elevation 130
from Mean Sea Level (MSL) measured using GPS. Since the peninsula is comprised with sandy soil 131
layers all the pit latrine users mentioned the latrine pit depth as around 1.5 meters. Therefore latrine 132
pit depth for all the 20 sampling locations were considered as 1.5 meters as an average value. By 133
subtracting the point elevation of latrine pit depth from water level of dug wells from MSL the length 134
of the infiltration layer was identified. All the unit measurement values were taken in meters. Since 135
the values of bacteria count are in larger figures and other values in small figures, all the figures were 136
converted in to base 10 logarithm values for the convenience of analysis. The Total coliform bacteria 137
and E.coli presence is compared with the standards of distance maintenance since the available 138
regulations indicate the distance between Ground water extraction point and the latrine pit as the 139
most important factor to prevent ground water fecal contamination. It was not possible to carryout 140
correlation or regression analysis due to the considered 20 sample size was not adequate. Therefore 141
relationship between the presence of Total coliform bacteria and E.Coil count in 100ml and the Water 142
levels of dug wells, Infiltration layer length and Pit latrine depth were attempted to identify using 143
cluster analysis using PASW statistics18. The results of laboratory tests were analyzed applying 144
inverse distance weighted (IDW) interpolation method in Arc.GIS10.3 in order to identify the spatial 145
distribution of Total coliform bacteria at 37 °C and E.Coil at 44 °C in the Kalpitiya peninsula. The 146
results of the analysis were logically compared with the in-situ observation records. 147
3. Study Area
148
Kalpitiya peninsula is located in North Western coastal belt of Sri Lanka which. It includes in the Dry 149
zone climatic region between79° 40 and 7° 50’– 8° 30’ latitudes. Kalpitiya belongs to Puttalam district 150
administrative boundaries of North Western province in Sri Lanka. Total population was recorded 151
as 98,470 in the year 2011 including 49,397 male population and 49,136 female population (DC & S, 152
2011). The area has a multi-ethnic population consisting of Sinhalese, Tamils, Burgher and Muslims. 153
The average annual rain fall of the study area recorded between 500 – 600 mm from the North East 154
monsoon between December and February. Highest rainfall values area recorded usually on October, 155
November and December. Average annual temperature of Kalpitiya area recorded as maximum of 156
31oC to minimum of 27oC. Humidity and evaporation is very high in this area according to the 157
records of the Meteorological Department of Sri Lanka. As a costal split, elevation of most parts of 158
the area do not surpass 10 meter. Kalpitiya peninsula includes in the Coastal Sand Aquifer and the 159
groundwater “lens” mainly recharged during the North -East Monsoon period. The seasonal crop 160
cultivations and coconut cultivations are the main land uses of the area. Lagoon and Marine fishing 161
and prawn cultivations are highly active fisheries sectors and agriculture is the second most 162
important income source. 163
4. Results and the Discussion
164
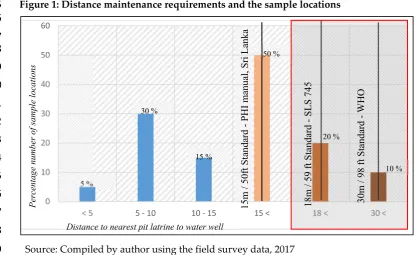
According to the field observations and tape measurement data 50% of the dug wells are situated full 165
filling the minimum available requirement of distance which is 15meter/50feet between the well and 166
latrine pit (Figure 01). Yet only 10 % of the locations meet the commonly acknowledged international 167
standard of 30meter/98 feet distance while 5% of the locations only maintain less than 5meter 168
distance. 30% of the wells and pit latrines owners are aware about the 15 meter/50feet requirement 169
between the ground water extraction point and the on-site excreta disposal point while even though 170
0 10 20 30 40 50 60
< 5 5 - 10 10 - 15 1 15 < 18 < 30 <
5m / 50ft St anda rd P H I m anual , S ri La nk a 1 8m
/ 59 ft
St anda rd SL S 74 5 3 0m
/ 98 ft
St anda rd WH O 5 % 30 % 15 % 50 % 10 % 20 %
Distance to nearest pit latrine to water well
Percen
tage number of sample lo
cations
20% 35%
80% 65%
40%
0%
30%
5%
(Count in log10 value) (Count in log 10 value)
(Unit = meters in log value) (Unit = meters in log value)
15
m
/ 50ft Standar
d PHI m anual, Sr i L anka 1 5m
/ 50ft S
ta nda rd - PH I m anual, Sr i L ank a
standards. They commonly have the knowledge passed through generations that do not hold any 172
scientific grounds regarding well must be away from the latrine. 173
174
Figure 1: Distance maintenance requirements and the sample locations
175 176 177 178 179 180 181 182 183 184 185 186 187 188
Source: Compiled by author using the field survey data, 2017 189
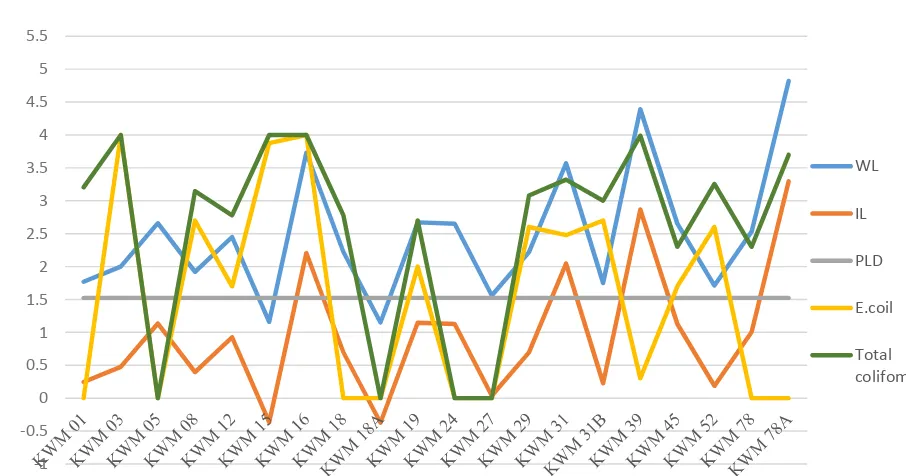
The distribution of laboratory results of the presence of Total coliform and E.coli in the locations is 190
illustrated in Figure (2) with reference to the minimum distance requirement of 15meters/50feet. 191
Figure 2: Total coliform & E.coli presence and the distance requirement
192 193 194 195 196 197 198 199 200 201 202 203
Source: Compiled by author using the field survey data and laboratory test results,2017
204
The illustrated figure (2) is compiled as taking all the Sampling locations which are similar or above 205
the minimum distance requirement standard of 15 meters/50 feet in to one category for the 206
convenience of interpreting the results. The pattern of Total coliform presence distribution indicate 207
that only 20% of the sampling locations bear the required water quality standard of potable water 208
source while 0% of the locations which reach the minimum distance requirement are recorded as 209
having the required water quality level. 35% of the sampling locations achieved the obligatory 210
standards for E.coli presence and 5% of those locations only included in the category of wells which 211
reach the minimum distance requirement. When considering the presence of Total coliform, 80% of 212
the wells which are within or the minimum distance requirement category. And also according to 214
the E.coli presence standards 65% locations are unsuitable as potable water and 30% of these 215
locations have met the minimum distance requirement. 216
Accordingly, only four (4) ground water extraction wells records satisfactory potable water quality 217
level which is only 20%. And 80% of the wells are with unsatisfactory potable water quality level. 218
Interestingly, all the four sampling locations which recorded the ‘Satisfactory water quality’ level 219
do not reach the minimum distance requirement for the nearest latrine pit as indicated in Table (3). 220
Only the sample well KWM05 is in 12meters distance from the nearest toilet. All the other wells are 221
in below 10 meter category while KWM18A and KWM 27 both are in below 5 meter category. And 222
also all the locations which are within the 20% of 18 meter distant requirement of PHI Manuel Sri 223
Lanka category and 10% of 30meter distance WHO standard requirement category has recorded 224
‘Unsatisfactory Water Quality’ Level. 225
Table 1: The sampling locations which recorded "Satisfactory Water Quality" level
226
No. Sample
Test Method:
Remarks
Distance to nearest toilets (unit = Meters)
Mean Water Level (Meters) Nmber present in
100ml of sample
Total coil from bacteria at 37 °C
E.Coil at 44
°C Toilet
1
Toilet 2
Toilet 3
1 KWM 05 Nill Nill Satisfactory 12 15< 15< 2.66
2 KWM
18A
Nill Nill Satisfactory 4 4 7 1.15
3 KWM 24 Nill Nill Satisfactory 7 8 15< 2.65
4 KWM 27 Nill Nill Satisfactory 5 15< 15< 1.56
Source : Compiled by authors, 2017 227
According to the literature review 80% of the precedent studies have identified a negative strong 228
co-relation of distance between the well and latrine pit and presence of Total coliform and E.coli. It 229
means when the distance between the two points increase the presence of pathogens decrease and 230
vice versa. Yet this case study do not express such relationship. The results reveals that 231
maintaining the ‘minimum distance requirement’ alone is not enough for preventing fecal 232
contamination of the ground water extraction sources. The relationship between the water level 233
(WL) and pit latrine depth (PLD) also express an unpredictable behavior pattern. For an example, 234
in the sample KWM15 ; Water level is below the Pit latrine depth , therefore the gap of infiltration 235
layer (IL) is low and the presence of Total coliform and E.coli is high. At the same time, , in the 236
sample KWM 16 ; Water level is very high above the Pit latrine depth , therefore the gap of 237
infiltration layer is longer but the presence of Total coliform and E.coli is high as same as in the 238
sample KWM15. This behavioral chaotic pattern is informatively illustrated in the figure (3). 239
Accordingly, these analysis results highlight the presence of associated case specific reasons in each 240
sample location are strongly significant for pit latrines correlated ground water contamination in 241
Kalpitiya peninsula 242
243
244
245
Figure 3. The behavioral chaotic pattern of Common Factors
247
248
249
250
251
252
253
254
255
256
257
258
259
260
Source : Compiled by authors, 2017 261
262
It was performed the cluster analysis using all the possible factors including the count of Total 263
coliform and E.coli, depth of the water table, gap of infiltration layer, depth of the latrine pit and the 264
distance between the dug well and latrine pit. The resulted Dendrogram plot is illustrated in figure 265
(4).The cluster analysis results reveals higher distance before two clusters were created which 266
express that the sample locations are with poor similar combinations between the factors considered 267
to form possible homogeneous clusters. Accordingly, even though the commonly considered factors 268
are continuously proven by scholars as immensely important for the fecal contamination of 269
groundwater related to pit latrines, this case study reveals there are case specific combination of 270
other factors which increase the pathogens’ contact with ground water. Therefore while focusing on 271
the common standards, the site specific reasons need to be identified to protect the ground water 272
table. 273
Figure 4: The results of the Cluster Analysis
274
275
276
277
278
279
280
281
282
283
284
285
Source : Compiled by authors, 2017 286
-1 -0.5 0 0.5 1 1.5 2 2.5 3 3.5 4 4.5 5 5.5
WL
IL
PLD
E.coil
The spatial distribution pattern of Total coliform and E.coli bacteria resultant from the interpolation 287
(IDW) of the count presence in twenty (20) sample locations is illustrated in figure (5). Areas around 288
Kandakuliya and Annawasala Grama Niladhari (GN) Divisions indicated the highest contamination 289
levels with both bacteria types. Especially the presence of E.coli bacteria indicate the possible threat 290
of fecal contamination from human excreta to the ground water table of the area. It indicate the 291
Northern portion of Kalpitiya peninsula is with higher possibility to be with contaminated ground 292
water. 293
Figure 5: Results of the Inverse Distance Weighted Interpolation Analysis ( IDW) – GN wise
294
Spatial pattern of Total Coliform and E.coli bacteria
295 296
297
298
299
300
301
302
303
304
305
306
307
308
309
310
311
312
313
314
Source : Compiled by authors, 2017 315
It is obvious that 80% of the sampling locations are exposed to fecal contamination and the 316
interpolation results indicate the contamination threat is spreading over the Northern portion of the 317
case study area. Pit latrines are the only fecal matter containing source yet the commonly accepted 318
factors related to pit latrines do not extend a help to identify the pattern of fecal contamination of 319
the area. Therefore the applicability of those factors as indicators of protecting ground water from 320
fecal contamination is proven to be in question by the results of this study. 321
5. Conclusions
322
Ground water is the most important water source for both domestic and agricultural practices in 323
Kalpitiya peninsula. Most of the population depend on this priceless resource as their only drinking 324
water source in the area. As a low lying coastal belt this area is experiencing with the tragic issue of 325
ground water contamination. Especially, fecal contamination of ground water has become a threat to 326
the hygiene of the inhabitants. Mostly practiced human excreta disposal method in this area is the 327
use of pit latrines. The pit latrines are evident to be the point pollution source of fecal contamination 328
whether the commonly accepted factors on preventing the pit latrines correlated ground water 330
contamination are always applicable with reference to the case study area. According to the literature 331
review it was identified that to evaluate the ground water of an area’s level of contamination with 332
fecal matter, the testing for Total coliform count and E.coil tests are considered as most important. 333
Therefore, twenty (20) randomly picked sampling dug well locations representing each portion of 334
Kalpitiya peninsula were selected and samples were collected considering all the necessary 335
conditions for the laboratory testing. Under the literature review it was identified that, the depth of 336
the water table, gap of infiltration layer, depth of the latrine pit and the distance between the dug 337
well and latrine pit are the most commonly considered factors in evaluating the reasons for pit 338
latrines related ground water contamination. Therefore the relevant data from all the sampling 339
location for each factor were collected and analyzed using PASW statistics18. According to the cluster 340
analysis results, there is very poor possible homogeneous pattern can be drawn between the 341
considered factors of the sampling locations and presence of pathogens in ground water. The results 342
of laboratory tests were analyzed applying inverse distance weighted (IDW) interpolation method in 343
Arc.GIS10.3 in order to identify the spatial distribution of Total coliform bacteria at 37 °C and E.Coil 344
at 44 °C in the Kalpitiya peninsula. The derived maps indicate the Northern portion of Kalpitiya 345
Peninsula is mostly exposed to the threat of ground water fecal contamination. Therefore the results 346
of this study highlights apart from the commonly accepted factors on preventing the pit latrines 347
correlated ground water contamination, it must consider case specific and site specific factors related 348
to this menacing issue. When considering the derived results, it can assume that the soil condition of 349
the area, condition of the latrine pit, condition of the ground water extraction point (Dug well/ Tube 350
well), adjacent land uses, pattern of the surface water flow and many other factors related to a 351
particular area may have association in accelerating or minimizing the rate of ground water fecal 352
contamination. Hence, it is high time to identify the case specific and area specific reasons apart from 353
the ‘commonly accepted factors’ on pit latrines correlated ground water contamination not only in 354
the case study Kalpitiya Peninsula, but also in the threaten areas mostly in the dry zone coastal belt 355
of Sri Lanka. 356
357
Acknowledgments:
358
This research study was carried out under the Indo Sri Lanka grant on Developing methods for 359
assessing island vulnerability to sea level rise and its effects on livelihood options provided through 360
Ministry of Science, Technology and Research of Sri Lanka. Authors would like to acknowledge the 361
following dignitaries on their immense helps throughout the study. 362
• Ms. R. Wijialudchumi, Secretary, Ministry of Science, Technology and Research of Sri Lanka
363
• Ms. Himali Athaudage, Director; Ministry of Science, Technology and Research of Sri Lanka
364
• Dr. S.Sreekesh, Jawaharlal Nehru University, India
365
Extended gratitude goes to Plnr. Gayani Ranasinghe, Department of Town & Country Planning, 366
Faculty of Architecture, University of Moratuwa on her support. 367
Author Contributions: Ranjana U.K. Piyadasa & Sonali D. Herath H.M.M. conceived and designed 368
the experiments. Ranjana U.K. Piyadasa performed the experiments; All Authors partaken in 369
analyzing the data and contributed reagents/materials/analysis tools; Sonali D. Herath H.M.M. 370
wrote the paper. 371
Conflicts of Interest: The authors declare no conflict of interest. 372
References
373
1. Census and Statistics data of 2012, Department of Census and Statistics as retrieved on
374
2. Frank, A., (2012) ,Impact of pit latrines on groundwater in some selected towns in the Tano 376
districts, Kwame Nkrumah University Of Science And Technology , College Of Science, 377
Department Of Theoretical And Applied Biology 378
3. Geldreich, E.E.,(1990), Microbiological quality of source waters for water supply (pg. 3-31) G.
379
A. McFeters (ed.) Drinking Water Microbiology: Progress and Recent Developments. 380
Springer-Verlag, New York. 381
4. Kimani Najimurage E. and Ngindu A.M (2003), Quality of Water the Slum Dwellers Use: the
382
Case of a Korgan Slum; Urban Health Journal, 2007 Nov; 84(6):829-38 383
5. Lewis, W. J., Foster, S.S. D & Drasar, B.S.,(1980), Risk of groundwater pollution by on-site
384
sanitation in developing countries; a literature review. by the International Reference Centre 385
for Wastes Disposal 386
6. Madsen, E. L. and W. C. Ghiorse, (1993), Groundwater microbiology: subsurface ecosystem
387
processes. (pg 167-214 ) T.E. Ford (ed.) Aquatic Microbiology. Blackwell Scientific 388
Publications, Boston. 389
7. Nandalal, K.D.W., (2010) Groundwater Resources; Proceedings of the National Forum on
390
‘Water Research Identification of Gaps and Priorities’, Colombo, Sri Lanka. September, 16-391
17, 2010. Published by National Science Foundation, Sri Lanka; (pg 99-117)ISBN:978-955-392
590-109-3, Retrieved on 393
http://slwater.iwmi.org/sites/default/files/DocumentRoot/H043233.pdf#page=106 394
8. Panabokke, C.R., (2007), Groundwater conditions in Sri Lanka ; Published by National
395
Science Foundation of Sri Lanka: ISBN 978-955-590-079-9, Retrieved on 396
http://dl.nsf.ac.lk/bitstream/handle/1/5392/NA333.pdf?sequence=2&isAllowed=y 397
9. Parry-Jones S. (1999), On-Site Sanitation in Areas with a High Groundwater Table; Sandy
398
Caimcross; Well Factsheet. 399
10. Piyadasa, U.K.R., Weerasinghe K.D.N., Wijayawardhana, L.M.J.R., & Liyanage (2008),
400
Ground water contamination due to sanitation problems and its’ relation to soil 401
characteristics (Case study in Denipitiya, Sri Lanka), 402
11. Sri Lanka Standards for potable water – SLS 614:1983
403
12. Still D.A. & Nash S.R., (2002), Groundwater Contamination Due To Pit Latrines Located In
404
A Sandy Aquifer: A Case Study From Maputaland; Paper presented at the Biennial 405
Conference of the Water Institute of Southern Africa (WISA) 19 – 23 May 2002, Durban, South 406
Africa www.wisa.co.za ISBN Number: 1-86845-844-X CD-ROM produced by: Water 407
Research Commission (WRC), www.wrc.org.za 408
13. Sugden S., (2006), The Microbiological Contamination Of Water Supplies, Sandy
409
14. Warellagama, D. R. I. B. and M. Hettiarachchi (2004). Safe Distance between a Dinking Well
410
and a Fecal Pollution Source for Sri Lanka, Annual Research Symposium, National Water 411
Supply & Drainage Board, Sri Lanka. 412
15. Werellagama, D. R. I. B., G. Herath, M., Hettiarachchi and S. Basnayake (2003). Report on
413
Pollution Source and a Drinking Well in Sri Lanka, Environmental Engineering Laboratory, 415
Faculty of Engineering, University of Peradeniya, Sri Lanka. 416
16. World Health Organization (WHO) (2014), World Health Statistics, ISBN 978 92 4 156471 7
417
ISBN 978 92 4 069267 1 (PDF) (NLM classification: WA 900.1); Retrieved on 418