Spatial analysis and identi
fi
cation of environmental risk factors affecting the
distribution of
Indoplanorbis
and
Lymnaea
species in semi-arid and irrigated
areas of Haryana, India
A.K. Sangwan
a,⁎
, B. Jackson
b, W. De Glanville
b, D.U. Pfeiffer
b, K.B. Stevens
b aDepartment of Veterinary Parasitology, Lala Lajpat Rai University of Veterinary and Animal Sciences, Hisar, IndiabVeterinary Epidemiology and Public Health Group, Department of Veterinary Clinical Sciences, Royal Veterinary College, University of London, London, United Kingdom
a r t i c l e i n f o
a b s t r a c t
Article history:
Received 27 December 2015 Received in revised form 24 May 2016 Accepted 25 May 2016
Available online xxxx
Fasciolosis, amphistomosis and schistosomosis, transmitted by the freshwater snail species IndoplanorbisandLymnaea, are important snail-borne diseases in India as they affect the entire spectrum of domestic animals causing substantial mortality and economic loss. Identifying any heterogeneity in the spatial distribution of these snail-borne diseases will allow for targeted disease control and efficient use of resources. The objectives of this study were threefold: (i) to describe and explore the spatial distribution ofIndoplanorbisandLymnaeain Rohtak and Jhajjar districts of Haryana, India (ii) to identify factors associated with occurrence of these freshwater snail species and (iii) to produce a map showing the predicted risk of occur-rence ofLymnaeaandIndoplanorbisspp. in the study area. Snails were collected from water bodies of 99 settlements out of a total of 453 in the study area. Kernel smoothing was used to generate a kernel ratio map while Kulldorff's spatial scan statistic was used to detect clusters of settlements with a high/low risk. Multivariable logistic regression showed that snails were almost ten times more likely to be present in rice-growing areas than in those not growing rice (OR 9.24) and that snails were less likely to be present with each 1 km increase in distance from a canal (OR 0.86). The regression model was used to produce a map illustrating the pre-dicted risk of snail occurrence. Since the distribution of vector snails mirrors the distribution of borne parasitic diseases, such spatial analysis helps to determine the relative risk of snail-infestation as well as snail-borne diseases' distribution and planning of control activities.
© 2016 Published by Elsevier Ltd on behalf of World Federation of Parasitologists. This is an open access article under the CC BY-NC-ND license (http://creativecommons.org/licenses/by-nc-nd/4.0/). Keywords: Lymnaea Indoplanorbis Spatial analysis Risk factor Haryana India 1. Introduction
IndoplanorbisandLymnaeaare common freshwater snail species in India which act as intermediate hosts of various trematode species causing fasciolosis, amphistomosis and schistosomosis in livestock. These diseases are important as they are widespread in India and affect livestock sector by causing substantial mortality and economic loss (Gupta and Singh, 2002; Dutt, 1980; Agrawal, 2012). Based on the 2012 livestock census, India has a livestock population of 190.90 million cattle, 108.70 million buffaloes, 65.06 million sheep and 135.17 million goats in addition to other minor species. These animals are reared under diverse agro-climatic and management conditions. There are numerous reports on the prevalence of the snail-borne trematode disease in ruminants
Parasite Epidemiology and Control xxx (2016) xxx–xxx
⁎ Corresponding author.
E-mail address:Sangwan_arun@hotmail.com(A.K. Sangwan).
http://dx.doi.org/10.1016/j.parepi.2016.05.005
2405-6731/© 2016 Published by Elsevier Ltd on behalf of World Federation of Parasitologists. This is an open access article under the CC BY-NC-ND license (http://creativecommons.org/licenses/by-nc-nd/4.0/).
Contents lists available atScienceDirect
Parasite Epidemiology and Control
from different parts of India (Yadav et al., 2008; Garg et al., 2009; Yadav et al., 2007; Velusamy et al., 2004; Galdhar and Roy, 2005; Hassan et al., 2005; Satyanarayana et al.; Tariq et al., 2008; Varma et al., 1989; Agrawal, 2012) and on the prevalence of trematode infections in snails (Tigga et al., 2014; Jithendran and Krishna, 1990; Singh et al., 2009). However, prevalence of the snails and snail-borne diseases vary throughout India depending upon the suitability of the location for snail habitation.
The Haryana state, situated in north India, is mainly semi-arid, irrigated, agriculture based rural economy. The main freshwater snails found in the area areIndoplanorbis(Indoplanorbis exustus) andLymnaea(L ymnaea luteola,Lymnaea acuminataandLymnaea auricularia) among others (Gupta et al., 1987; Chaudhri et al., 1982). The snail-borne diseases, particularly amphistomosis and fasciolosis are endemic in Haryana (Chaudhri et al., 1993; Gupta et al., 1985). The central areas of Haryana, composed of Rohtak and Jhajjar districts, represent regions with development-induced changes such as canal irrigation, rice cultivation and patches of water logging leading to spread of freshwater snails in these areas. These areas experience a sub-tropical, semi-arid, continental, monsoon climate characterized by hot summers, cool winters and a short rainy season. Annual rainfall for the area is approxi-mately 450 mm with 80% of this falling during the rainy season (July to end of September). Due to its saucer-shaped topography, the area is prone toflooding despite its low rainfall. The area is mainly alluvial plain with soil texture varying fromfine loam to sand. As the annual rainfall is low and of short duration, agricultural activities in these regions rely largely upon canal and tube-well irrigation. The ruminant livestock population of the area consists of approximately 515,000 buffaloes, 95,000 cattle, 51,000 sheep and 24,000 goats. However, based on anecdotal evidence, the distribution of both the trematode parasites and their vector snails is patchy suggesting that the parasite distribution is influenced by one or more environmental or agro-ecological factors. Therefore, this region was chosen as study area to represent semi-arid, irrigated landscape of Haryana having varying distribution of snails and snail-borne livestock diseases.
Parasites are found in specific locations where there are suitable environmental conditions for the host and vector or interme-diate host. However, their distribution boundaries are notfixed in space and time and mayfluctuate within and between years (Stensgaard et al., 2006). Various studies using geographic information systems (GIS), remote sensing (RS) and spatial analysis have been conducted (Rinaldi et al., 2006; Simoonga et al., 2009; Fuentes, 2006; Yang et al., 2005; Brooker, 2002) to enhance the understanding of the distribution of snails and snail-borne diseases. Mapping environmental features allows for the determi-nation of risk factors associated with the parasites and identification of areas potentially at risk.Cringoli et al. (2004)utilized en-vironmental features such as normalized difference vegetation index (NDVI), land cover, elevation, slope, aspect, and total length of rivers to predict the distribution of paramphistomosis in sheep in the southern Italian Apennines. Similarly, a GIS model for mapping the risk of fasciolosis in cattle and buffaloes in Cambodia was developed using subjectively weighted determinants of inundation, proximity to rivers, land use, slope, elevation, and the density of cattle and buffaloes (Tum et al., 2004). The model estimated that 28% of Cambodia's land area was potentially at risk of fasciolosis with areas of high and moderate risk concentrated in southern and central Cambodia. Temperature and rainfall data, together with soil conditions including ground water and forest cover were used to demonstrate the relative risk of transmission ofFasciola hepaticain Switzerland (Rapsch et al., 2008) while Zhang et al. (2008)developed a model to predict density of the snailOncomelania hupensis, the intermediate host ofSchistosoma japonicum, taking into account different environmental factors such as elevation, air and soil temperature, type of vegetation, mean height of preponderant vegetation and soil humidity. In such instances mapping the distribution of the vector (intermediate host) based on its climatic and environmental requirements provides a proxy risk map for disease distribution as the distribution of snail-borne parasitic diseases depends largely on the spatial distribution of suitable intermediate host snails (Stensgaard et al., 2006).
A major aim in the design of any disease control programme is to identify areas of high disease risk as targeting control efforts in these areas would have the greatest impact as well efficient use of resources. The objectives of this study were therefore three-fold: (i) to describe and explore the spatial distribution ofIndoplanorbisandLymnaeain Rohtak and Jhajjar districts of Haryana, (ii) to identify environmental factors associated with occurrence of the snail species and (iii) to produce a map showing the pre-dicted risk of occurrence ofLymnaeaandIndoplanorbisspp. in Rohtak and Jhajjar districts.
2. Methodology
2.1. Study design and study area
The study area comprised two districts of central Haryana in North India—Rohtak and Jhajjar (Fig. 1), covering a total area of 3652 km2and containing 453 villages and small towns (hereafter known as settlements). A cross-sectional study was performed using settlements as the epidemiological unit for assessing presence or absence of snails. A convenience sample of 99 settlements (22%), all approachable by a metalled road and evenly distributed throughout the study area, was selected for further investiga-tion. The spatial scan statistic was used to assess whether or not sampled villages were randomly distributed throughout the area. The 99 sampled settlements were defined as the‘cases’and the remaining 354 unsampled settlements were defined as‘controls’. The scan statistic was performed using a Bernoulli probability model with 999 permutations and a circular scanning window.
2.2. Data collection
2.2.1. Snails
(1965). Multiple permanent water bodies, including ponds, canals, ricefields, lakes and water-logged areas, within the perimeter of each settlement, were searched at several points for snails of speciesIndoplanorbisorLymnaea. At least 10 locations of the each water body were searched before accepting it as snail free. If at least one snail, of eitherIndoplanorbisorLymnaeaspecies, was collected from a water body, the settlement was considered positive for snails; settlements containing neither species were con-sidered snail-free. To minimize the chances of false positive and negative sites, snail collection was only performed during the snail season when they are found in abundance being prolific breeders. Both species are easily identified by the naked eye and are sedentary in nature, all of which combines to minimize the possibility of false negative settlements.
2.2.2. Environmental (geographical and climatic) data
GIS layers of the study area boundary and settlement locations were obtained from the Haryana Space Application Centre (HARSAC), Hisar. Settlements were represented as points based on their centroid. Environmental variables which have been shown or hypothesized to influence freshwater snail distribution, and which varied within afine spatial scale, were included in the model. In this study afine spatial scale was defined as one which allowed variations in the different environmental variables to be identified at landscape level. Variation in landscape factors or variables discernible at landscape level may give rise to local variability in host or vector distributions, transmission patterns and disease risk.
GIS layers showing the location of all major canals and mean annual rainfall of the area were obtained from theResource Atlas of Haryana (2004). Euclidean distance to the nearest canal was calculated as a raster map and the continuous variable rainfall was divided into three categories: 301–400 mm, 401–500 mm and 501–600 mm. The rainfall categories and cut-off values were pre-determined by the Resource Atlas of Haryana and based on the long-term average rainfall of Haryana state. Layers showing areas of rice cultivation, soil physiography andflood prone areas were obtained from the Haryana Remote Sensing Application Centre, Hisar, India. Areas of rice cultivation were extracted from the Linear Imaging Self Scanning Sensor (LISS-III) data of the Indian Re-mote Sensing (IRS) satellite P-6 (ResourceSat; spatial resolution 23.5 m), acquired during the rice-growing season of 2008. A 500 m buffer was created around all rice-growing areas in order to identify settlements within rice-growing areas as settlements were never inside the ricefields. A raster map of soil physiography was extracted from the Advanced Wide Field Sensor (AWiFS) data of IRS-P6 (ResourceSat; spatial resolution 56 m, date of pass: 13 November 2004). The main soil physiography in the area included old alluvial plains, aeo-fluvial plain,fluvio-aeolian plain and aeolian plain. Flood-prone areas were identified from The-matic Mapper TM data of Landsat 5 (date of pass: 24 September 1995), delineated based on the sharp contrast between water
spread and adjacent areas 20 days after initialflooding on 5th September 1995. This was the worstflood in the area since satellite images become available for such studies. Any settlement falling within a 500 m buffer zone of the 1995flooded area was con-sidered to lie within aflood-prone area. Spatial distributions of the environmental risk factors in the study area are shown in Fig. 2. Environmental variables such as land surface temperature were not included in this study as they did not vary substantially within the study area.
2.3. Spatial analysis and modelling
2.3.1. Kernel-smoothed and kernel density ratio maps
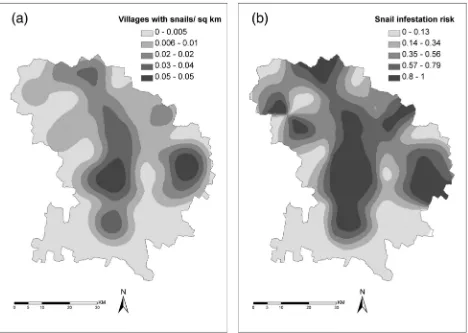
All maps were produced in ArcGIS 9.3 (ESRI, Redlands, CA, USA). Kernel smoothing was used to map the density of snail-positive settlements and a kernel ratio map, illustrating the proportion of snail-snail-positive settlements within a square kilometre, was created by dividing the kernel-smoothed surface of snail-positive locations by the kernel smoothed surface of all locations sampled. A bandwidth of 10 km and an output cell size of 250 m2were used to create all kernel-smoothed maps.
2.3.2. Cluster detection
Kulldorff's spatial scan statistic (Kulldorf, 1997; Kulldorf, 2009) was used to detect clusters of settlements with a high or low risk of being positive for snails. The statistic was implemented in SaTScan v8 (www.satscan.org) using a Bernoulli probability model with 999 permutations. An elliptical scanning window, set to contain a maximum of 50% of the population at risk, was used to simultaneously scan for clusters of settlements with either a high or low risk of snail presence.
2.3.3. Identification of risk factors and creation of risk map
All statistical analyses were conducted using SAS 9.2 (SAS Institute Inc., Cary, NC,
USA). The locations of all sampled settlements were superimposed on the raster maps of thefive environmental variables (mean annual rainfall, distance to nearest canal, soil physiography, and being within rice-growing orflood-prone areas) and the relevant environmental data extracted for each location using the intersect-point tool available as part of Hawth's Analysis Tools for ArcGIS (http://www.spatialecology.com/htools/tooldesc.php). The proportion of settlements positive and negative for snails was determined for all levels of categorical variables, together with the mean (±standard deviation) distance to canal.
A mixed-effects multivariable logistic regression model, with district as a random effect and an exponential spatial covariance structure, was used to investigate associations between snail presence and thefive environmental variables. A backward stepwise approach was implemented and each variable was removed in turn starting with the variable with the highest p-value until only
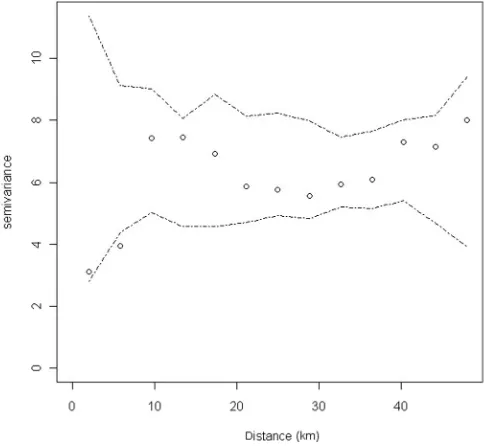
those with p-values≤0.05 remained. The effect of removing each variable was considered by examining the change to the esti-mates, standard errors and p-values of the remaining variables. The stability of thefinal model was assessed by returning elim-inated variables to the model individually and examining the change to the estimates, standard errors and p-values of thefinal model variables. In order to determine whether there was any small-scale (second-order) spatial variation in the data a semivariogram of the model residuals, with a simulation envelope based on 99 Monte Carlo permutations, was produced using R software together with the geoR and geoRglm packages (Ribeiro et al., 2003). The semivariogram was visually appraised to de-termine the existence of significant spatial dependency between settlements and the distance up to which snail-positive settle-ments were correlated. Thefinal regression model equation was applied to the relevant environmental layers to generate a map of the predicted risk of snail presence in the study area.
3. Results
3.1. Distribution of sampled settlements
The spatial scan statistic showed the 99 sampled settlements to be randomly distributed throughout the study area (pN0.05).
3.2. Prevalence of settlements with snails
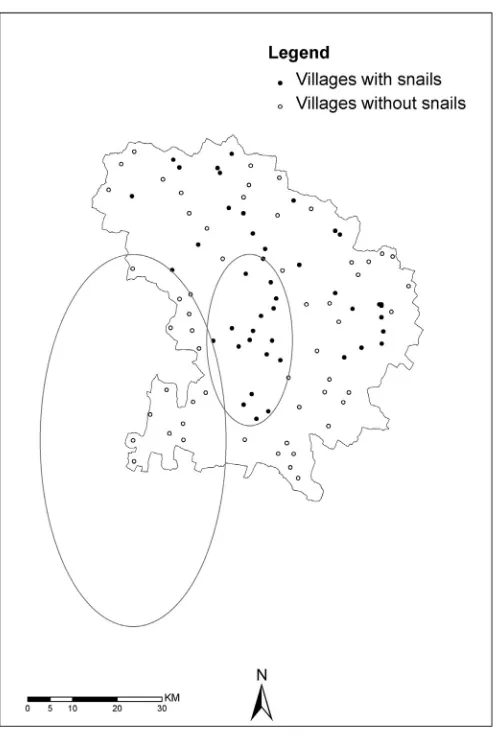
Forty-four of the 99 settlements sampled (Fig. 3) were found to be infested withIndoplanorbis,Lymnaeaor both species resulting in a prevalence of settlements with snails of 44% (95% CI = 35–53%). There were significant differences in the charac-teristics of settlements with and withoutIndoplanorbisand/orLymnaeaspp. (Table 1). In general, snail-positive settlements re-ceived between 400 and 600 mm of rainfall annually, were located on aeofluvial soils, within 4.1 km of a canal and within rice-growing areas or areas prone toflooding.
3.3. Density of snail-positive settlements
A kernel-smoothed map showed areas with the highest density of settlements with snails present were in the centre and east of the study area (Fig. 4(a)), while the kernel ratio map (Fig. 4(b)) identified a more extensive high-risk area in the centre of the region, together with small areas in the east and northern regions of the study area.
3.4. Clusters of settlements with snails
A high-risk cluster of snail-positive settlements was detected in the centre of the study area (relative risk = 3.12; p = 0.001) and a low-risk cluster in the south-west of the region (relative risk = 0; p = 0.029). The locations of these clusters are mapped in Fig. 5and their characteristics presented inTable 2.
3.5. Identification of risk factors for snail-positive settlements
Thefinal multivariable logistic regression model (Table 3) contained two variables: rice cultivation (pb0.0001) and distance from canal (p = 0.025). The corresponding odds ratios showed that snails were almost ten times more likely to be present in rice-growing areas compared to non-rice-growing areas (OR = 9.24, 95% CI 3.40–25.09) and that snails were less likely to be
Table 1
Characteristics of settlements in Haryana, India with and withoutIndoplanorbisand/orLymnaeaspp.
Variable Frequency of snail sampled settlements p-Value
Positive for snails (n (%)) Negative for snails (n (%))
Soil physiography b0.0001
Old alluvial 6 (33.3) 12 (66.6)
Aeo-fluvial 37 (56.9) 28 (43.1)
Fluvio-aeolian 1 (9.1) 10 (90.9)
Aeolian 0 (0) 5 (100)
Rainfall (mm) b0.0001
300–400 1 (12.5) 7 (87.5)
400–500 25 (44.6) 31 (55.4)
500–600 18 (51.4) 17 (48.6)
Flood status b0.0001
Flood-prone area (based on the last worstfloods in 1995) 33 (66.0) 17 (34.0)
Area not prone toflooding 11 (22.4) 38 (77.6)
Land use b0.0001
Rice-growing area 32 (76.2) 10 (23.8)
Non-rice growing area 12 (21.1) 45 (78.9)
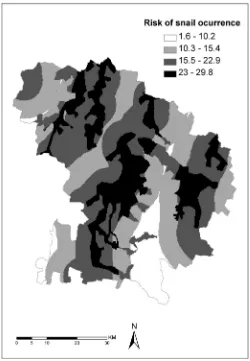
present with each 1 km increase in distance from the nearest canal (OR = 0.86, 95% CI 0.75–0.98). In addition, there was no ev-idence of significant spatial dependency among the model residuals (Fig. 6). The risk map (Fig. 7) generated from thefinal logistic regression model showed areas with the highest risk of snails being present to be in the centre, east and north-north-west of the study area.
4. Discussion
Spatial distribution of freshwater snails is determined largely by environmental factors which influence the abundance of water in an area, such as proximity to water bodies, soil texture, temperature and rainfall, land use, vegetation andflood risk. Such landscape factors generally vary at afiner spatial scale and give rise to local variability in host and vector distributions, trans-mission patterns and disease risk. This study showed that, within the Haryana districts of Rohtak and Jhajjar, the freshwater snail species,IndoplanorbisandLymnaea, are more likely to be present in areas growing rice compared to areas where rice is not grown (OR = 9.24) and that snails are less likely to be present with each 1 km increase in distance from the nearest canal (OR = 0.86). Both extraction and risk mapping showed the central, eastern and north-north-eastern regions of the study area had both the highest actual and predicted risk of snail occurrence. In addition, a cluster of settlements with a high risk of snail occurrence was identified in the centre of the study area. Conversely, the south-west and south-east corners of the study area had a low risk of snail occurrence. The fact that a high risk cluster of snail-positive settlements occurred in an area estimated to be high risk by the mixed-effects multivariable logistic regression model provides a form of validation for the accuracy of the model. How-ever, just because clusters were not identified in the other smaller areas predicted to be high risk does not render the model in-accurate. Areas predicted to be high risk may in fact never develop clusters of snail-positive settlements for one or more reasons including human interventions and short-termfluctuations in the population dynamics of snails. Instead, identification of these areas by the model allows control measures to be put in place in order to prevent any disease clusters occurring there.
The low-risk area identified in the south-western region (Fig. 5) consists mainly of aeolian andfluvio-aeolian plains with sand dunes making it unsuitable for rice cultivation through canal irrigation. The low-risk area in the south-east (Fig. 4(b)) is unsuit-able for rice-growing due to its paucity of quality irrigation water. All these factors contribute towards these areas being
unsuitable as snail habitats. Conversely, the central area is a suitable habitat for snails as the soil physiography, and presence of irrigation canals and rice paddies in the centre of Rohtak and Jhajjar districts make this area more suitable for snails.
Most of the earlier studies predicting spatial distribution of snails and snail-borne diseases (Yilma and Malone, 1998; Brooker et al., 2001; Malone et al., 2001; Stensgaard et al., 2006; Fuentes, 2006; Rapsch et al., 2008) covered wider areas than the current study and used a range of environmental, climatic and geographical variables. However, this study used local details such as use patterns of rice-growing areas and location of irrigation canals to characterize the risk of snail infestation. Variations in land-scape factors may give rise to local variability in host or vector distributions and transmission patterns and ultimately in disease risk. Thus, studying variables at a local scale allows for more accurate identification of small changes in risk.
The possibility of sampling bias arose in this study as choice of sampling sites was based on accessibility and geographical cov-erage of the entire area. Ninety-nine settlements were sampled from a total of 453 settlements (i.e. 22%). If this selection process had resulted in a study population that was not randomly distributed in space, the results of the study would not be applicable to other areas. However, the results of the spatial scan statistic showed there were no significant clusters of the sampled settlements and thus, the sampled settlements are assumed to be spatially representative of all settlements in the area.
Although only 22% (99/453) of settlements were sampled, this number was limited by logistical considerations. The two dis-tricts under investigation - Rohtak and Jhajjar - covered a total area of 3652 km2and, owing to the distances travelled between settlements, driving conditions in these regions to reach water bodies and the time spent sampling, only a few settlements could
Fig. 5.Location of significant (pb0.05) elliptical clusters of settlements with a high risk (small ellipse) or low risk (large ellipse) ofIndoplanorbisand/orLymnaea
spp. occurrence.
Table 2
Details of the significant (pb0.05) spatial clusters identified by the elliptical spatial scan statistic illustrated inFig. 4.
Cluster Observed cases Expected cases Total settlements in cluster Relative risk p-Value
High risk cluster 18 8 18 3.12 0.001
be visited and sampled in a day. In addition, we were restricted to the snail season of August to early December. A greater number of settlements could have been sampled if we had chosen to visit ones close together but this would have introduced sampling bias and increased the probability of the sampled settlements being clustered rather than distributed throughout the study area. As a result of choosing to have a smaller sample that was evenly distributed throughout the study area and representative of all environmental conditions in the region rather than a large sample which was clustered, we have ensured that our results can be generalized to other regions.
The sensitivity and specificity of detecting and identifying the snails are important issues in such studies. For general surveys of snails like this one, the emphasis is on a widespread and intensive search, and there is no reason to determine the snail pop-ulation densities or to make any other quantitative measurement. Consequently, no specific collection techniques need be used (WHO, 1965). The method usually involves a visual search. However, the issues of sensitivity, specificity and validity are very im-portant when specific snail collection methods (e.g. scooping or snail collection per square metre) are used to determine snail density in a water body, study the natural history or population dynamics of snails or evaluate the efficacy of snail control mea-sures. This survey consisted of gross collection and visual identification of snails. Although, both species are abundant during snail season (August to early December), easily identified by the naked eye and measure more than a centimetre in length, a number of precautions were taken to improve the validity of snail collection and identification. For example, the survey was conducted only during the snail season because these snails are prolific breeders and unlikely to be missed during this season. However, during other seasons they may less numerous or undergo hibernation or aestivation and thus can be missed by visual appraisal. Even though identification ofIndoplanorbisandLymnaeaup to genus level is simple and undemanding, as the correct identification of common snails of the study area can be more complex, an experienced parasitologist conducted all surveys, thus minimizing the risk of misclassifying the snail species.
The results from this study can assist in the cost effective planning and execution of a regionally-adapted snail control or snail avoidance strategy. Improved diagnostic facilities and prompt chemotherapy treatment in the high-risk areas will help to reduce the harmful effects of the parasites on livestock health. This model can be applied to larger areas with similar environmental con-ditions thus extending the benefits of such a study. However, limitations and biases of the study should be kept in mind when applying this model. For example, settlements with and without snails were identified on the basis of a single visit and the inves-tigation of one or more water bodies within the settlement; not all water bodies within a settlement were checked as these set-tlements are dotted with small ponds. Furthermore, since the distribution and density of snails depends on a location's status in preceeding years, temporal effects should also be considered (Yang et al., 2008). In addition to the environmental variables
Table 3
Variables associated with the occurrence ofLymnaeaandIndoplanorbisspecies in water bodies within settlements in the districts of Rohtak and Jhajjar in the state of Haryana in India.
Variable Odds ratio (OR) 95% CI p-Value
Rice-growing area 9.24 3.44–25.09 b0.0001
1 km increase in distance from canal 0.86 0.75–0.98 0.025
considered in this study, other variables such as human intervention, the presence of snail-suitable water vegetation, groundwater quality and availability, and socio-economic factors should be taken into account in the prediction of snail distribution. Due to the project limitations, the model was not evaluated by furtherfield surveys that would have been still better than the present reli-ance on the other evidences like extract mapping using kernel density ratio map as well as cluster detection by spatial scan sta-tistic. However, the matching of actual and predicted risk of snail occurrence along with the detection of high risk cluster of snail-positive settlements in the area estimated to be high risk by the regression model support the accuracy of the model for prediction.
5. Conclusion
This study showed that within the semi-arid and irrigated districts of Rohtak and Jhajjar, India, freshwater snails are more like-ly to be present in areas growing rice compared to areas where rice is not grown (OR = 9.24) and are also less likelike-ly to be pres-ent with increased distance from the nearest canal (OR = 0.86). The cpres-entral, eastern and north-north-eastern parts of the two districts were shown to have the highest risk of snail occurrence with the south-west and south-east having the lowest risk. Spa-tial scan statistics and visualization by the kernel density estimation also highlighted this heterogeneity in the snail distribution. Since the distribution of snail vectors mirrors the distribution of snail-borne parasitic diseases, information from studies such as this one can assist in the planning and implementation of both snail and snail-borne diseases control activities.
Acknowledgements
The authors would like to thank the Commonwealth Scholarship Commission for providing a Commonwealth Academic Staff Fellowship to the senior author AKS and CCS Haryana Agricultural University, Hisar, for the necessary permission to avail it. Thanks also go to Haryana Space Application Centre (HARSAC) Hisar for providing several of the GIS layers used in the analysis.
References
Agrawal, M.C., 2012.Schistosomes and Schistosomiasis in South Asia. Springer. Brooker, S., 2002.Schistosomes, snails and satellites. Acta Trop. 82, 209–216.
Brooker, S., Hay, S.I., Issae, W., Hall, A., Kihamia, C.M., Lwambo, N.J.S., et al., 2001.Predicting the distribution of urinary schistosomiasis in Tanzania using satellite sensor data. Tropical Med. Int. Health 6, 998–1007.
Chaudhri, S.S., Gupta, R.P., Yadav, C.L., 1982.A note on the bionomics of some aquatic snails of Haryana State. Haryana Vet. 21, 60–64.
Chaudhri, S.S., Gupta, R.P., Kumar, S., Singh, J., Sangwan, A.K., 1993.Epidemiology and control ofFasciola giganticainfection of cattle and buffaloes in eastern Haryana, India. Indian J. Anim. Sci. 63, 600–605.
Cringoli, G., Taddei, R., Rinaldi, L., Veneziano, V., Musella, V., Cascone, C., et al., 2004.Use of remote sensing and geographical information systems to identify environ-mental features that influence the distribution of paramphistomosis in sheep from the southern Italian Apennines. Vet. Parasitol. 122, 15–26.
Dutt, S.C., 1980.Paramphistomes and Paramphistomiasis of Domestic Ruminant in India. PAU Press, Punjab Agricultural University, Ludhiana, India.
Fuentes, M.V., 2006.Remote sensing and climate data as a key for understanding fasciolosis transmission in the Andes: review and update of an ongoing interdisci-plinary project. Geospat. Health 1, 59–70.
Galdhar, C.N., Roy, S., 2005.Studies on prevalence of bovine paramphistomiasis in Chattisgarh state. Indian Vet. J. 82, 938–940.
Garg, R., Yadav, C.L., Kumar, R.R., Banerjee, P.S., Vatsya, S., Godara, R., 2009.The epidemiology of fasciolosis in ruminants in different geo-climatic regions of north India. Trop. Anim. Health Prod. 41, 1695–1700.
Gupta, S.C., Singh, B.P., 2002.Fasciolosis in cattle and buffaloes in India. J. Vet. Parasitol. 16, 139–146.
Gupta, R.P., Chaudhri, S.S., Ruprah, N.S., Yadav, C.L., 1985.Epizootiology of paramphistomiasis in Haryana State. Indian J. Anim. Sci. 55, 14–19.
Gupta, R.P., Yadav, C.L., Ruprah, N.S., 1987.Studies on the bionomics of some aquatic snails and their cercarial fauna of Haryana State. Indian Vet. Med. J. 11, 77–84. Hassan, S.S., Kaur, K., Joshi, K., Juyal, P.D., 2005.Epidemiology of paramphistomosis in domestic ruminants in different districts of Punjab and adjoining areas. J. Vet.
Parasitol. 19, 43–46.
Jithendran, K.P., Krishna, L., 1990.Fresh water aquatic snails with larval trematodes in Kangara Valley, Himachal Pradesh. J. Vet. Parasitol. 4 (2), 51–53. Kulldorf, M., 1997.A spatial scan statistic. Commun. Stat. Theory Methods 26, 1481–1496.
Kulldorf, M., 2009. SaTScan V 8.0: Software for the Spatial and Space–Time Scan Statistics. Information Management Services, Inc. (Available from:http://www.satscan. org).
Malone, J.B., Yilma, J.M., McCarroll, J.C., Erko, B., Mukaratirwa, S., Zhou, X.N., 2001.Satellite climatology and the environmental risk ofSchistosoma mansoniin Ethiopia and east Africa. Acta Trop. 79, 59–72.
Rapsch, C., Dahinden, T., Heinzmann, D., Torgerson, P.R., Braun, U., Deplazes, P., et al., 2008.An interactive map to assess the potential spread ofLymnaea truncatulaand the free-living stages ofFasciola hepaticain Switzerland. Vet. Parasitol. 154 (3–4), 242–249.
Resource Atlas of Haryana, 2004.State Natural Resource Data Management System (NRDMS) Centre. Haryana State Council for Science & Technology, Chandigarh, India.
Ribeiro, P.J., Christensen, O.F., Diggle, P.J., 2003.geoR and geoRglm: Software for model-based geostatistics. Proceedings of the 3rd International Workshop on Distrib-uted Statistical Computing (March 20-22; Vienna, Austria).
Rinaldi, L., Musella, V., Biggeri, A., Cringoli, G., 2006.New insights into the application of geographical information systems and remote sensing in veterinary parasi-tology. Geospat. Health 1, 33–47.
Satyanarayana, A., Babu A.P., Kumar, U., Rao, P., 2016.A prevalence of paramphistomes in the coastal area of Andhra Pradesh. Indian Vet. J.
Simoonga, C., Utzinger, J., Brooker, S., Vounatsou, P., Appleton, C.C., Stensgaard, A.S., et al., 2009.Remote sensing, geographical information system and spatial analysis for schistosomiasis epidemiology and ecology in Africa. Parasitology 136, 1683–1693.
Singh, A., Srivastava, S., Shekhar, C., Singh, J., 2009.Prevalence of trematodes in bovines and snails. Indian Vet. J. 86, 206–207.
Stensgaard, A.S., Jorgensen, A., Kabatereine, N.B., Rahbek, C., Kristensen, T.K., 2006.Modeling freshwater snail habitat suitability and areas of potential snail-borne dis-ease transmission in Uganda. Geospat. Health 1, 93–104.
Tariq, K., Chisti, M.Z., Ahmad, F., Shawl, A.S., 2008.The epidemiology of paramphistomosis of sheep (Ovis ariesL.) in the north west temperate Himalayan region of India. Vet. Res. Commun. 32, 383–391.
Tigga, M.N., Bauri, R.K., Deb, A.R., Kullu, S.S., 2014.Prevalence of snail's intermediate host infected with different trematodes cercariae in and around Ranchi. Vet. World 7 (8), 630–634.
Tum, S., Puotinen, M.L., Copeman, D.B., 2004.A geographic information systems model for mapping risk of fasciolosis in cattle and buffaloes in Cambodia. Vet. Parasitol. 122 (2), 141–149.
Varma, T.K., Prasad, A., Malviya, H.C., Dwivedi, P., 1989.Incidence of paramphistome infections in ruminants at Bareilly. Indian J. Anim. Sci. 59 (2), 231–234. Velusamy, R., Singh, B.P., Gupta, S.C., Chandra, D., 2004.Prevalence ofFasciola giganticainfection in buffaloes and its snail intermediate host at Bareilly. J. Vet. Parasitol.
18, 171–173.
WHO, 1965. Snail Control in the Prevention of Bilharziasis. Monograph Series Vol. No. 50. World Health Organization, Geneva, p. 200 (Accessible at:http://whqlibdoc. who.int/monograph/WHO_MONO_50_%28part5%29.pdf).
Yadav, C.L., Garg, R., Kumar, R.R., Banerjee, P.S., Godara, R., 2007.Seasonal dynamics ofFasciola giganticainfection in cattle and buffaloes in Uttaranchal, India. Indian J. Anim. Sci. 77, 133–135.
Yadav, C.L., Garg, R., Kumar, R.R., Vatsya, S., 2008.Prevalence of fasciolosis in ruminants in national capital region, Delhi. Indian J. Anim. Sci. 78, 269–271. Yang, G.J., Vounatsou, P., Zhou, X.N., Utzinger, J., Tanner, M., 2005.A review of geographic information system and remote sensing with applications to the
epidemi-ology and control of schistosomiasis in China. Acta Trop. 96, 117–129.
Yang, K., Wang, X.H., Yang, G.J., Wu, X.H., Qi, Y.L., Li, H.J., et al., 2008.An integrated approach to identify distribution ofOncomelania hupensis, the intermediate host of
Schistosoma japonicum, in a mountainous region in China. Int. J. Parasitol. 38, 1007–1016.
Yilma, J.M., Malone, J.B., 1998.A geographic information system forecast model for strategic control of fasciolosis in Ethiopia. Vet. Parasitol. 78, 103–127. Zhang, Z., Ong, S., Peng, W., Zhou, Y., Zhuang, J., Zhao, G., et al., 2008.A model for the prediction ofOncomelania hupensisin the lake and marshland regions, China.