SAGE Research Methods Case
Education Submission for
Consideration
Case Title
Student-led tutorials and their implications on learning and teaching: Findings from a mixed methods study
Author Name(s)
Curtis E. Ziniel and Asad K. Ghalib
Author Affiliation & Country of Affiliation
Liverpool Hope Business School, Liverpool Hope University. Liverpool, United Kingdom
Lead Author Email Address
Email: [email protected] and [email protected]
Discipline:
D2 [please do not alter]Sub-discipline
Teaching Methods and Learning Styles [SD-Edu-21]
Academic Level
Contributor Biographies
Dr. Curtis Ziniel is a lecturer in research methods. Originally from North Dakota in the United States, he earned his PhD from the University of California, Riverside in 2009. His previous experience includes a 15 month Visiting Fellowship at Harvard University and a one year Visiting Assistant Professorship at the University of Oregon. He started teaching at Hope University in 2010. His teaching experience includes lecturing in research methods, communication, politics, education, and business. He is a Fellow of the Higher Education Academy (FHEA). His teaching at the Liverpool Hope Business School focuses on research methods for both undergraduates and postgraduates.
Dr. Asad Ghalib earned a Doctorate in Development Policy and Management and a Masters in Management from the Global Development Institute (GDI), School of Environment, Education and Development, University of Manchester. He has been associated with a number of institutes and organisations around the world in the academic, development, research, not-for-profit, financial and banking services industry. He holds Fellowships of the Higher Education Academy (FHEA) and the Royal Society of Arts (FRSA) and is a member of the European Survey Research Association (ESRA), Mixed Methods International
Research Association (MMIRA) and Development Studies Association (DSA).
Abstract
Student-led tutorials were introduced at the Liverpool Hope Business School after some issues arising in the existing ‘teacher-led’ model. It was felt that these tutorials were
becoming just another form of mini-lectures with the lecturers going through tutorial readings in class with minimal student participation and engagement. The new model was designed to engage students. They were awarded marks for attendance and engagement, including submitting a one-page summary of the reading. Twice a year individual students were responsible for presenting the material with the aid of PowerPoint slides and subsequently leading the discussion around the topic.
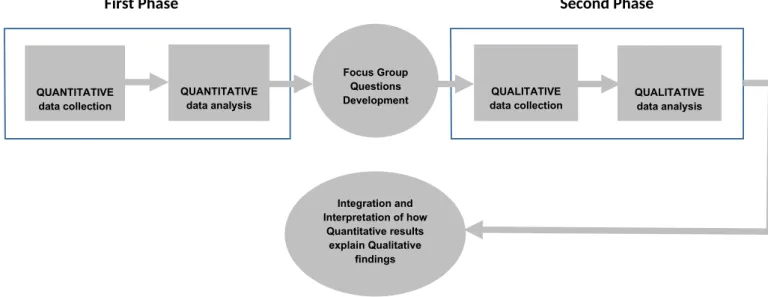
An explanatory sequential mixed-methods design was used to capture student feedback and assess the model’s effectiveness and value for students. The first phase comprised a
used to draw up questions for discussion in the second phase, which gathered qualitative data during focus group discussions. Inferences were finally drawn by mixing data from both phases.
Study findings revealed that first year students were largely appreciative of the model and stated that the presentations had enabled them to be more confident in standing up and speaking in front of the class. There were mixed responses; however from second year students as they had followed the previous system in which they had got an ‘easy ride’ by just sitting idly in tutorials as they were not being assessed. They did, however, admit in the focus group discussions that their presentation skills and confidence had improved in the new model, where they had to present to the class as well as actively participate in the ensuing discussion.
Learning Outcomes
By the end of this case students should be able to
appreciate the use of both quantitative and qualitative methods to arrive at and
form a more holistic judgement and understanding of the study question(s);
have a good understanding of when and why mixed methods are used;
understand the limitations faced by using either quantitative or qualitative
methods on their own;
gain a basic understanding of mixed methods and practical knowledge of how
the explanatory sequential mixed methods design is applied
Case Study
Project Overview and Context: Student-led Tutorial groups
The Business School at Liverpool Hope University places great emphasis on preparing its students for the real world. The tutorial system was introduced, among other steps taken towards tailoring and developing pedagogical tools and approaches to meet this objective. The model comprises small groups of students of around ten per group. They are held in
delivering material. These tutorials are established to encourage active student engagement in the education process as well as to improve students’ communication and presentation skills and overall confidence. As such, each student delivers a presentation and subsequently leads the discussion for two tutorial sessions. The first of the two presentations is delivered in pairs, while the second one is done individually.
Reading material for the sessions is made available at least four weeks in advance to give students enough time for preparation. Presenters are expected to start with a brief (5 to 10 minute) presentation of the reading material for that session. It should clearly explain the reading material and cover aspects such as:
What was the purpose of the reading? What points were made?
Why is this information important?
What arguments or evidence did the author(s) use to make their points? Were the
arguments and evidence convincing? Why or why not?
The students are also expected to connect the material to a wider context:
How does the material relate to previous course readings or lecture/seminar content?
How does the material relate to current news events or happenings in the real world?
Finally, a good presentation is expected analyse the material and make critical evaluations:
Were there points you disagreed with? Why?
How would other authors or theorists react to the arguments made in the reading?
independence as their confidence builds up. Each year, every student presents in the form of a pair and subsequently on his/her own.
The presentation is the starting point for the student discussion during the rest of the tutorial time. As part of their presentation mark, students are also expected to lead the discussion of the reading and be prepared to ask their fellow students discussion questions to trigger a discussion around the reading. Each presenting student is expected to come prepared with several (15 or more) discussion questions so that the class has plenty to discuss. In order to sustain quality, students are reminded that they are also marked on how well they lead the discussion and engage fellow tutorial group members.
Finally, students are encouraged to be creative and innovative with their presentations. PowerPoint slides do not need to fit a generic format (they do not need to imitate the structure of previous presentations). Students are also encouraged to hold and sustain the discussion with creative questions as well as any other activities that can be developed to encourage active participation from peers.
Tutorial Attendance and Active Participation
Participation in the course is not about simply showing up. Students are expected to be active contributors to the class discussion. These tutorials require them to engage with the material, with tutors, and especially with each other in an active way. It also helps those students who are presenting if they attend sessions regularly and actively engage with the material.
Students are given certain guidelines to help them make the most of this model, some of which are:
To come to the tutorials prepared by reading through the material thoroughly
Take notes as they go through the reading
Come prepared to discuss their thoughts on the reading
Have questions prepared about anything that was confusing or how material relates to
other course content
Make attempts to read widely, if time permits, so that they can place the reading
Tutorial Marking and Scoring
The tutorials are assessed and each student’s mark comprises three elements: attendance, summary and participation. These are elaborated further below:
Attendance and general engagement in class (not distracting: side conversations, using mobile phones, etc.) – One mark
Summary of reading presented before the tutorial begins. This needs to be referenced and of a passable standard (i.e. 40% +) – One mark
Participation in the discussion – a maximum of three marks
No engagement in discussion – zero marks
Basic understanding demonstrated: little evidence to show reading was
undertaken. Generally, un-informed discussions/questions – one mark
Good understanding demonstrated: Evidence of reading. Generally, well informed
discussion/questions. Arguments generally supported – two marks
Excellent understanding demonstrated: Clear evidence of reading. Highly
informed, going beyond the reading brief, making wider connections to theory or
practice. Arguments supported – three marks
If not presenting, students are marked on the basis of the written summary, participation and attendance.
Research Practicalities: carrying out a student survey
who had previously been through the relatively ‘easy’ tutorial model where the tutor was expected to present as well as lead the discussion. Hence, their responses were actually a comparison of the two models. In the second round, second year students filled out the same questionnaire that they had completed during the first year (during the 2014/15 session), whereas the first year students had the opportunity to participate in the survey only once (in the 2015/16 session).
The questionnaire was designed to capture a number of dimensions across the new student-led tutorial model. These related to overall student satisfaction, pedagogical value,
intellectual stimulation, organisation, effectiveness of learning, enjoyment, marking,
feedback, comments from the tutor, help towards understanding topic, contribution towards critical thinking ability, improvement of time management, development of confidence in standing up and speaking in front of an audience, improvement of presentation skills and learning new PowerPoint tools and techniques, etc.
The survey instrument was administered towards the end of the academic session in the form of printed questionnaires. These were distributed and collected during tutorial sessions by the relevant tutors. Complete confidentiality and anonymity were guaranteed as no student details were captured. Moreover, the tutor left the room to return towards the end to offer privacy.
The quantitative data collected was input to a dataset and was subsequently analysed across a number of dimensions. The analysis that ensued lead to the formulation of a number of follow-on questions that we used later during our focus group discussion sessions with the students.
Research Design
Given that we wanted to obtain a holistic view of how and what the students felt about the new model, we felt it necessary to design it based on the mixed methods approach. This approach to inquiry investigates from more than one standpoint by combining both qualitative and quantitative forms of data. John Creswell and Vicky Plano Clark (2011) assert
that this method resides in the ‘middle of the continuum’ because it incorporates elements of
applying either approaches alone, thus offsetting the weaknesses of each research technique used separately.
For our study, we used the structured questionnaires as instruments to capture the quantitative element, whereas the focus groups led to the generation of qualitative data.
Creswell (2015) proposes three basic designs for carrying out mixed methods research: parallel convergent, explanatory sequential and exploratory sequential designs. In the parallel convergent design, both quantitative and qualitative data are collected and analyzed
separately. Once this is done, analyses from both types of data are merged to arrive at the interpretation. In the other two designs, only one type of data is collected and analyzed first,
followed by the other. The exploratory sequential design, for instance, in the first phase
examines a problem by initially collecting and analyzing qualitative data. Once this is done, another (quantitative) survey instrument is designed, based on the results thus obtained. In the second phase, this instrument is tested and implemented and data is collected and analyzed. The final interpretation is done by mixing data and analyses from both phases.
For the purposes of carrying out this research, we based our design on the third type, the
‘Explanatory Sequential Design’. According to Creswell (2015 p. 38) ‘the intent of this design is to study a problem by beginning with a quantitative strand to both collect and analyse data, and then to conduct qualitative research to explain the quantitative results’. The first phase of the study led to quantitative data, which when interpreted by averages and percentages, led us to a number of general outcomes of the study problem. These quantitative
results and interpretations, however, did not tell us how they occurred and what the
circumstances that led to them were. The second qualitative strand was conducted in the form of focus groups that helped us to explain these quantitative findings. A clear advantage of focus groups is that they tend to generate rich data and information through direct interaction between participants themselves and also the researcher. Moreover, the views expressed are spontaneous and participants are able to build on one another’s responses and react
accordingly if they agree or disagree with what others are saying.
The Structured Survey and Focus Groups in Action
The first phase:
a) Collection of quantitative data by administering a survey and its subsequent analyses
The structured questionnaires were drawn up and distributed in class by the relevant tutors. They were collected on the same day and handed over for entry. Data was analysed once all the tutors had returned their respective completed forms.
b) Determining what to explore further by focus groups
The results were examined in depth in order to determine which findings would need further investigation and exploration in the second qualitative phase of the study. The results were also examined to draw up a list of those questions that we would be asking focus group participants during this second qualitative phase.
The second phase:
a) Collection and analyses of qualitative data captured through focus groups
The second phase involved us conducting four focus groups. The questions that we asked the students led to ‘triggering’ a discussion among them along the lines of these questions (or more appropriately, prompts) which were primarily drafted after carrying out quantitative data analyses in the first phase of the research.
b) Inferences drawn after using data from focus groups to explain survey results
The focus groups generated a lot of rich qualitative data. This data was used to draw
significant inferences by explaining the quantitative data that was collected and analysed via a structured questionnaire administered during the first phase.
Figure 1: Phases that constitute our Explanatory Sequential Mixed Methods Design
Student Evaluation Survey Data and Analysis: Practical Lessons Learned
Structured questionnaire – data and analysis
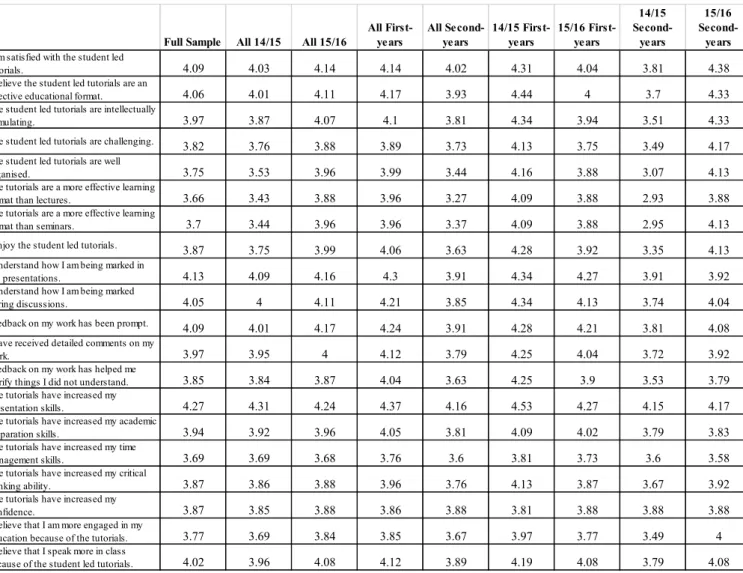
We asked several questions when we surveyed students about the student-led tutorials. However, the most notable finding after the first academic year of having students lead the tutorials was that the first-year students were much more satisfied with the tutorials than second-year students. This finding was consistent whether the question was about the tutorials being generally effective, intellectually stimulating, or even if they helped develop students’ presentation skills. Across 20 questions investigating the quality of the new tutorial format, second year students had more negative opinions than the first year students on all 20 questions. We suspected that this was due to second-year students experiencing a different tutorial format in their first year (tutorials that required less effort for higher marks) and thus were less open to the new format; even though the majority of the second-year students surveyed acknowledged the benefit of the tutorials to their academic growth, engagement, presentation skills, critical thinking, and confidence.
Second Phase
Focus Group Questions Development
Integration and Interpretation of how
Quantitative results explain Qualitative
findings QUANTITATIVE
data collection
QUANTITATIVE data analysis
First Phase
QUALITATIVE data collection
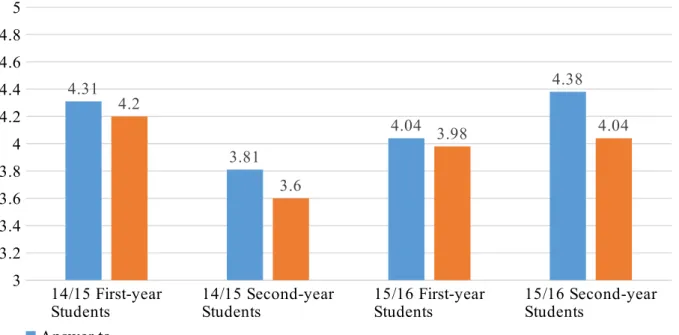
The difference in reaction between the first-year and second-year students was quite stark and can easily be seen in the quantitative data as well. Figure 2 presents a data summary of students’ general reaction to the tutorials. We did find more detailed examination of the data by question helpful for our own purposes (please see Table 1 for a full breakdown). For example, students were more impressed with the tutorials as a means to develop presentation skills and to engage more during class than as a way to develop their time management skills. Students also had more confidence in the presentation and participation marking in the second year the tutorials ran as opposed to the initial year, which we believe is down to the natural development of both tutors and students becoming more comfortable with the system over time. But the most interesting finding was the stark difference between second-year students in the initial year and the other cohorts.
We could only speculate that the cause of the students’ differing reaction was due to the second-year students having experienced a different tutorial format and thus having different expectations. The difference may have simply been a difference in general attitude among the cohorts or a difference in how tutors implemented the tutorials. But we found evidence supporting our initial presumption when we replicated the data gathering with students the following year. In our second year of implementation the second-year students evaluated the tutorials much more positively. This could still be a cohort effect, this time the second-year students were more positive than the first-year students, but the 2015/16 first-year students were also generally positive, suggesting that the negativity of the second-year student cohort from the initial trial year of the tutorials was a result of their previous tutorial experience.
But our speculation was further supported by our qualitative data.
Focus Group Data and Analysis
subjectivity and how some tutors may mark differently than others. Students were rightfully concerned that some tutors may be stricter or more forgiving in their marking. As one student noted,
“Tutors having different expectations, no matter how much you try to standardise it. Some tutors are better at being subjective while others are being objective or the other way around. Some things you just can’t fix.” (2015/16 second-year student)
The students acknowledged that some difference in tutor marking is inevitable, but as educators we understand that marking needs to be as fair as possible. As such, we will continue to work on tightening up our marking process so that it is as consistent as possible. One suggestion for this was identified by another student,
“I can understand, moderation is hard. But even two tutors in a room isn’t going to do it. I think every presentation needs to be videoed so that all the tutors can do it.”
(2015/16 second-year student)
This is a good suggestion, which he possibly heard from a tutor as the School was already discussing the option of video recording all presentations. But regardless of the source, students are clearly keen to have the process be as consistent as possible.
There were many diverse suggestions throughout the focus groups; too many for a full description in this space. Students who were quite engaged in the process suggested that students who did not engage should face stronger consequences. Those students who were less engaged talked about the difficulty of engagement for students who are shy or
Students also had many positive comments about the process. Students almost completely agreed that the presentations helped with their public speaking skills, subject knowledge, and participation during class. As one student noted,
“It’s a real life skill isn’t it? We’re going to have to go out and do this all ourselves. It’s something we’re going to use, so, it’s good we get used to it now.” (2015/16 second-year student)
There was some discussion around confidence as a few students felt they understood what makes a good presentation, but that understanding the difficulty of a presentation could lead to more anxiety. But the format itself was something students acknowledged was a positive. Having the tutorials in small groups (8-12) with the same classmates over the year meant less anxiety for most.
“We get used to it. I’ll say anything in front of these now (meaning his tutorial group).” (2014/15 first-year student)
“It’s more, like, fun.” (2015/16 first-year student)
Overall, the comments in the focus groups were more positive than negative. Even when describing a negative or something to be improved, students would often acknowledge the positives as well. We expected positive comments from most groups. But we did not expect this for our 2014/15 second-year students, as they had lower survey scores and generally complained about the process more during the year. However, our focus groups produced surprising results. These students were broadly consistent with the other groups in their evaluations of the process. They had negative comments and critiques, but similar to other students they acknowledged the positive attributes of the process. The quotations that follow demonstrate some of the discussion points during the 2014/15 second-year student focus groups. These students were similar to the other groups in that they thought the overall process was solid,
They also found the discussion helpful,
“You get used to challenging other students’ ideas. That’s not something we would do before. I would just always agree.” (2014/15 second-year student)
“Some people don’t really speak, but you get more and more comfortable.” (2014/15 second-year student)
And as one student noted (to which the other students in the group agreed),
“Yeah, I’m glad we did them, now that they’re over.” (2014/15 second-year student)
Overall, we did not find major differences in the tutorial evaluations of the 2014/15 second-year students. While this somewhat contradicts the survey results, we believe it is a very important finding. It is possible that our focus group sample produced a biased result. But having sat through the discussions, we believe that these students were more unhappy with the new tutorial format because their experiences in their first year gave them different expectations. This unhappiness came through in the survey results. But the students were still able to objectively evaluate the positive elements and benefits of the new process and a more thoughtful discussion, which occurred in the focus groups, brought these thoughts to the surface. This finding highlights the importance of using multiple sources of data gathering. The survey results alone demonstrated a dissatisfied student cohort, especially when
Figure 2. Student evaluations of the student tutorials by academic year and student cohort.
14/15 First-year
Students 14/15 Second-year Students 15/16 First-year Students 15/16 Second-year Students 3
3.2 3.4 3.6 3.8 4 4.2 4.4 4.6 4.8 5
4.31
3.81
4.04
4.38 4.2
3.6
3.98 4.04
Answer to
Table 1: Averages across all questions and groups regarding the quality of the student-led tutorials.
Full Sample All 14/15 All 15/16
All First-years All Second-years 14/15 First-years 15/16 First-years 14/15 Second-years 15/16 Second-years
I am satisfied with the student led
tutorials. 4.09 4.03 4.14 4.14 4.02 4.31 4.04 3.81 4.38 I believe the student led tutorials are an
effective educational format. 4.06 4.01 4.11 4.17 3.93 4.44 4 3.7 4.33 The student led tutorials are intellectually
stimulating. 3.97 3.87 4.07 4.1 3.81 4.34 3.94 3.51 4.33 The student led tutorials are challenging. 3.82 3.76 3.88 3.89 3.73 4.13 3.75 3.49 4.17 The student led tutorials are well
organised. 3.75 3.53 3.96 3.99 3.44 4.16 3.88 3.07 4.13 The tutorials are a more effective learning
format than lectures. 3.66 3.43 3.88 3.96 3.27 4.09 3.88 2.93 3.88 The tutorials are a more effective learning
format than seminars. 3.7 3.44 3.96 3.96 3.37 4.09 3.88 2.95 4.13 I enjoy the student led tutorials. 3.87 3.75 3.99 4.06 3.63 4.28 3.92 3.35 4.13 I understand how I am being marked in
the presentations. 4.13 4.09 4.16 4.3 3.91 4.34 4.27 3.91 3.92 I understand how I am being marked
during discussions. 4.05 4 4.11 4.21 3.85 4.34 4.13 3.74 4.04 Feedback on my work has been prompt. 4.09 4.01 4.17 4.24 3.91 4.28 4.21 3.81 4.08 I have received detailed comments on my
work. 3.97 3.95 4 4.12 3.79 4.25 4.04 3.72 3.92 Feedback on my work has helped me
clarify things I did not understand. 3.85 3.84 3.87 4.04 3.63 4.25 3.9 3.53 3.79 The tutorials have increased my
presentation skills. 4.27 4.31 4.24 4.37 4.16 4.53 4.27 4.15 4.17 The tutorials have increased my academic
preparation skills. 3.94 3.92 3.96 4.05 3.81 4.09 4.02 3.79 3.83 The tutorials have increased my time
management skills. 3.69 3.69 3.68 3.76 3.6 3.81 3.73 3.6 3.58 The tutorials have increased my critical
thinking ability. 3.87 3.86 3.88 3.96 3.76 4.13 3.87 3.67 3.92 The tutorials have increased my
confidence. 3.87 3.85 3.88 3.86 3.88 3.81 3.88 3.88 3.88 I believe that I am more engaged in my
education because of the tutorials. 3.77 3.69 3.84 3.85 3.67 3.97 3.77 3.49 4 I believe that I speak more in class
because of the student led tutorials. 4.02 3.96 4.08 4.12 3.89 4.19 4.08 3.79 4.08
n=151
Exhibit 1 below shows the procedures and products of each phase of the explanatory
sequential deign that was used to collect and analyse quantitative and qualitative data for this study.
Phase Procedure Product
Structured questionnaire distributed physically to students (N = 151)
Data entry and screening Handling missing data Frequencies
Averages Percentages
Development of focus group discussion questions
Invitation to students to participate in focus group discussions
Focus groups held Discussion initiated with
questions developed in previous stage
Further probing questions asked for explanatory purposes
Notes taken throughout the process
Classifying qualitative data according to themes Thematic analysis and
integration
Cross-thematic analysis
Interpretation, comprehension and explanation of both
Quantitative and Qualitative data
Numeric data
Descriptive statistics
Trends obtained by means of averages and percentages
Focus groups conducted (N = 4)
Textual data obtained in the form of recorded notes during focus group discussions
Broader thematic knowledge emerges
Overall picture formed of subjects’ thoughts and feelings
Discussion of results
Implications of new model on students’ learning
Exhibit 1: Diagram showing the various procedures and products for each step of the explanatory sequential design (adapted from Ivankova & Stick 2007)
Conclusions
The tutorial system that we had in place at the Business School was not working. The model was a bit too similar to the seminars that was already in place (except that seminars ran for two hours and involved more in-depth activity or case studies). Attendance was poor and students’ interest and engagement was declining. It was observed that they would only attend assessed sessions and had no interest in showing up for those sessions that were not assessed. The tutorial portfolio activities were too easy, the readings would not challenge them, most students never bothered to read and prepare before coming to class, if they decided to turn up in the first place. They would somehow assume that the tutor would go through the material and explain it to them. If asked a question, they would simply draw a blank. Tutorials were gradually taking the shape of mini-lectures. The current model was clearly failing.
The model was completely revamped. The underlying change nested on two axes: one was to hand the ownership over to students and second, allocate assessed marks to each aspect, from attendance to participation to presentations. The changes were substantial, significant and across the board. Attendance improved and students started to take interest in the readings. There were marks to be earned for which they had to participate and engage with enthusiasm.
We decided to ask students for feedback. After all, they were the ‘end consumers’ and principal stakeholders in the new model. It was important to understand and appreciate what they have to say and how they felt. In order to carry out the study, the explanatory mixed methods design was used. Creswell (2015) argues that the strength of this design is that two phases of this model build upon each other so that there are distinct as well as easily
recognisable. The two phases, as explained above, comprised a quantitative survey administered through a structured fixed choice liker-based questionnaire, followed by qualitative data collected by means of focus groups.
increased their confidence in facing the audience, in preparing and delivering PowerPoint presentations and in gaining a deeper understanding by having to deliver and take control of the subject matter. This aspect was something that the questionnaire alone did not reveal, but only came to surface during the qualitative data collection phase, i.e. the focus group
discussions. As argued by Creswell and Plano Clark (2011), this method seems to have strengths which are greater than the individual methods (qualitative and quantitative) being applied on their own. Mixed methods thus provides a more comprehensive and rigorous approach towards studying a research problem. As we have seen in this study, using this method helped us build a more robust and accurate picture that enabled us to understand the situation in a more holistic manner.
Exercises and Discussion Questions
1. Which research method(s) did we use for this study, and why do you think we selected them for this particular research?
2. Given that we were conducting a survey on a model that had been recently implemented, what do you think would have been the consequences of using either qualitative or quantitative methods alone to collect data?
3. The case mentions a specific mixed-method design. Why do you think we considered it to be the most appropriate for this study?
4. We have mentioned the benefits of using mixed methods. Can you think of any disadvantages that this method might have? You can use any study as an example to illustrate your point.
Further Readings
Creswell, J. W. and V. L. Plano Clark (2011). Designing and Conducting Mixed Methods Research. California, Sage Publications, Inc., USA
Plano Clark, V.L. and Nataliya, I.A. (2016). Mixed Methods Research – A guide to the field. Mixed Methods Research Series. California, Sage Publications, Inc., USA
References
Creswell, J. W (2015). A Concise Introduction to Mixed Methods Research. California, Sage Publications, Inc., USA
Creswell, J. W. and V. L. Plano Clark (2011). Designing and Conducting Mixed Methods Research. California, Sage Publications, Inc., USA