A STUDY ON RAILWAY EMPLOYEE PERCEPTION TOWARDS QUALITY OF
WORK LIFE
Dr.M.MANIMEKALAI
Assistant Professor, PG and Research Department of Commerce,
Srimad Andavan Arts and Science College (Autonomous),
T.V.Kovil, Nelson Road, Trichy -05
Abstract
Quality in the workplace comes from
understanding and then fully meeting, the
needs of all the internal and external
customers, now and into the future and in
doing so to ensure continual improvement in
efficiency and effectiveness. QWL refers to
the favorableness or un – favorableness of a
total job environment of the people. The
basic purpose is to develop jobs and working
conditions that are excellent for people as
well as for the economic health of the
organization. QWL provides a more
humanized work environment. It attempts to
serve the higher – order needs of workers as
well as their more basic needs. It seeks to
employ the higher skills of workers and to
provide an environment that encourages
improving their skills.
Key Words: Quality of Work Life, Human
Resource Development, Organizational
Behavior, Quality Circle.
Introduction
Quality of work life has gained deserved
prominence in the Organizational Behavior
as an indicator of the overall of human
experience in the work place. It expresses a
special way of thinking about people their
work and the organizational in which careers
are fulfilled.
QWL can be assessed by combining the
amount and the degree of stress and the
degree of satisfaction experienced by the
individual within his/her occupational role.
The most common assessment of QWL is
the individual attitudes. This is because
individual work attitudes are important
indicators of QWL. The ways that people
respond toothier jobs have consequences for
their personal happiness, the effectiveness of
their work organizations and even the
stability of society. Individuals selectively
perceive and make attributions about their
jobs in accordance with the expectations they
bring to the workplace. While the
considered to be important influences on
work attitudes, the past decades of 1970s and
1980shave witnessed much greater attention
to aspects of the organizational context in
which the job is performed.
Significance of the study
Quality of work life covers various aspects
under the general umbrella of supportive
organizational behavior. Thus, the QWL
should be broad in its scope. It must be
evaluate the attitude of the employees
towards the personnel policies. The research
will be helpful in understanding the current
position of the respective company. And
provide some strategies to extent the
employee’s satisfaction with little
modification which is based on the internal
facilities of the company. This research can
be further used to evaluate the facilities
provided by the management towards the
employees. This study also helps in
manipulating the basic exception of the
employees.
Objectives of the study
To know about the goods shed
employee’s quality of work life
evaluation.
To know the existing working
conditions, Industrial Health and safety
help to improve the quality of work life.
To know how the various welfare
activities and other benefits helps to
bring a better quality of work life.
Hypotheses of the study
The subsystems of Human Resource
Development and their effectiveness are
independent of personal profile of
employees.
The impact of employee’s safety and their acceptance of suggestion by their
superior are significant.
Limitations of the Study
1. Converting qualitative data into
quantitative data may often lead to
inaccurate results.
2. The respondents may not have
expressed them strong negative feelings
about the policies, which results in the
error of central tendency.
3. Few respondents were reluctant while
answering the questions.
4. Sample Size is limited to 200
respondents only which may not be
representatives of universe.
5. Time available at the disposal was not
enough.
Review of Litrature
Taylor, 1977; Taylor, 1978; Donald, 1997
have generally established that QWL is
positively associated with job satisfaction
implication of this finding for management is
the need to consider the type of intrinsic and
extrinsic factors highlighted by the four
aspects of QWL that comprise the
motivational reward-incentive system used
in organizations.
Kirkman (1989) suggests that in the future
work society; the drive for more
humanitarian treatment both in and out of
work will increase.
Cheng S (2001) in his paper QWL through
employee participation in Singapore has
discussed the following four different
approaches to QWL Employee share option
scheme, Joint management consultation,
Quality circle and Industrial relations circle.
Worrall and Cooper (2006) found in their
recent survey that a low level of well-being
at work may cost dear to an organization
resulting in a loss of about 5-10% of Gross
National Product per annum.
Syed Mehdi Hosseini (2010) argues that
career satisfaction, career achievement and
career balance are not only the significant
variables to achieve good quality of work
life.
Research Methodology
The objective of study was to ascertain the
quality of work life of the employees in
specific work environment relationship. For
this best suited method was survey method.
Hence a questionnaire method is chosen
which is free from bias of the interviewer
and large sample can be made use of and
thus the result can be more dependable and
reliable.
Sampling size
The sample size selected for the study was
200 respondents of “Tiruchirappalli Division
Goods shed employees”.
Construction of the Tool
The data collected are classified, analyzed
and calculated. The statistical tools are
applied for the analysis of the data. The tools
used are Percentage analysis, weighted
average method and Chi – square test.
Percentage of Respondents = No. of respondents * 100 Total no. of respondents
Weighted average method = (X1W1 + X2W2 + X3W3 +……..) N
Chi ‐ Square test = Σ (O ‐ E)2 / E
E = R*C/N
Where R = sum of row total O = Observed frequency
Analysis and Interpretation
Analysis by using Percentage Test
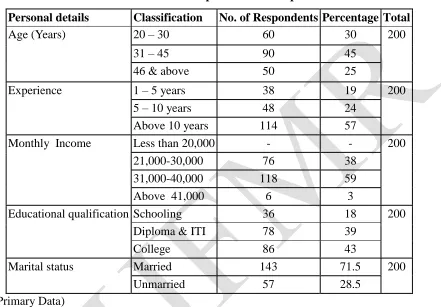
Table No.1
Socio-Economic profile of the respondents
Personal details Classification No. of Respondents Percentage Total
Age (Years) 20 – 30 60 30 200
31 – 45 90 45
46 & above 50 25
Experience 1 – 5 years 38 19 200
5 – 10 years 48 24
Above 10 years 114 57
Monthly Income Less than 20,000 - - 200
21,000-30,000 76 38
31,000-40,000 118 59
Above 41,000 6 3
Educational qualification Schooling 36 18 200
Diploma & ITI 78 39
College 86 43
Marital status Married 143 71.5 200
Unmarried 57 28.5
(Primary Data)
Out of the total respondents taken for study 45% of the respondents belong to the age group of 31 to 45 and 30% of the respondent’s lies between 20 to 30 age group. 25% of the respondents fall from the age group of 46 and above. Majority of the respondent are of age group 31 to 45 years. The above table shows that majority of 57% of the respondents are with an experience of more than 10 years and 24% are 5 to 10 years of experience. 19% of the respondents are with 1‐5 year’s experience. No respondent is less experienced. The study reveals that all the respondents are well experienced, so they are well capable of assessing the quality of their work life.
The above the table shows that as much as 59 per cent of the respondents are in the higher income group of more than Rs. 31,000-40,000 income per month. Hence it can be inferred that monetary benefits are not a constraint to assess the quality of work life, in the study unit.
The study depicts that 18% have studied the school level only.39%of the respondents were ITI & Diploma holders, 43% were college level. Majority of the respondent are college level of education.
Analysis by using Chi-square Test:-
H0:- There is no significant difference between two variables.
Table – 2:
Opinion about promotions and the experience of the workers.
Experience Level Strongly Agree Agree Disagree Strongly Disagree Total
1 ‐5 years 10
(3.8) 18 (9.9) 10 (5.1) 0 (0.2) 38
5 – 10 years 6
(4.8) 22 (12.5) 20 (6.5) 0 (0.2) 48
>10 years 24
(11.4) 64 (29.6) 24 (15.4) 2 (0.6) 114
Total 40 104 54 2 200
(Primary Data)
Chi-Square Tests
Pearson
Chi-Square
Cal. Value Table Value df
4.944 12.592 6
Interpretation
Since the calculated value (4.944) is less than the table value (12.592).So the null hypothesis (H0)
is accepted the alternate hypothesis (H1) is rejected.
Result: Since the calculated value is less than the table value, the null hypothesis is accepted. So it is proved that there is no significant relationship between the experience level of workers and their opinion about promotions
Chi ‐ Square –Test – II
H0:- There is no significant difference between two variables.
H1:- There is significant difference between two variables. Table – 3
Opinion about fringe benefits and income level of the workers.
Income Level
Strongly Agree
Agree Disagree Strongly
Disagree Total 21,000-30,000 16 (10.6) 44 (21.3) 16 (5.7) 0 (0.4) 76
31000‐40,000 40
(16.5) 64 (33.0) 12 (8.9) 2 (0.6) 118
Above40,000 0
(0.8) 4 (1.7) 2 (0.5) 0 (0.0) 6
Total 46 112 30 2 200
Chi-Square Tests
Pearson Chi-Square
Cal. Value Table Value df
5.559 12.592 6
Interpretation
Since the calculated value (5.559) is less than the table value (12.592).So the null hypothesis (H0)
is accepted the alternate hypothesis (H1) is rejected.
Result: Since the calculated value is less than the table value, the null hypothesis is accepted. So it is proved that there is no significant relationship between the opinion of respondents with different income levels and their opinion on fringe benefits.
Chi – Square Test – III
H0:- There is no significant difference between two variables.
H1:- There is significant difference between two variables Table – 4
Opportunities provided in the organization to develop the employee’s abilities and their
equal treatment at work place.
Equal Treatment at
work place.
Strongly Agree
Agree Disagree Total
Strongly Agree 50
(10.8)
28 (27.1)
8 (5.2)
86
Agree 0
(14.2)
98 (35.9)
16 (6.8)
114
Total 50 126 24 200
(Primary Data)
Chi-Square Tests
Pearson
Chi-Square
Cal. Value Table Value df
44.694 5.991 2
Interpretation:
Since the calculated value (44.694) is greater than the table value (5.991).So the null hypothesis (H0) is rejected and the alternate hypothesis (H1) is accepted.
Chi – Square Test –IV
H0:- There is no significant difference between two variables.
H1:- There is significant difference between two variables Table – 5
Employee’s Priority to Safety and Their Acceptance of Suggestions by their Superiors.
Employees opinion prior to safety
Strongly Agree
Agree Disagree Strongly
Disagree
Total
Yes 32
(20.7)
66 (30.1)
16 (8)
4 (2)
118
No 38
(14.4)
36 (20.9)
8 (4.9)
0 (0.8)
82
Total 70 102 24 4 200
(Primary Data)
Chi-Square Tests
Pearson
Chi-Square
Cal. Value Table Value df
4.922 7.815 3
Interpretation:
Since the calculated value (4.922) is less than the table value (7.815).So the null hypothesis (H0)
is accepted the alternate hypothesis (H1) is rejected.
Result: Since the calculated value is lesser than the table value, the null hypothesis is accepted. So it is proved that there is no significant relationship between the employee’s opinion on priority to safety and their acceptance of suggestion by their superior.
Analysis by using Weighted Average Test:-
Table –6 Employee’s perception on motivational insights
Rank
Insights
1 2 3 4 5 Total
score
Total Average Ranking
Interest in work 56 52 52 28 12 712 200 3.56 1
Recognition 68 48 20 32 52 688 200 3.44 2
Award and Rewards 18 44 46 48 44 544 200 2.72 4
Compensation 20 24 40 34 82 466 200 2.33 5
Friendly
Rank Weighted Average Score
Rank Weighted Average Attributes
I 3.56 Interest in work
II 3.44 Recognition
III 2.95 Friendly Co‐workers
VI 2.72 Awards and Rewards
V 2.33 Compensation
Inference
From the table it is clear that among the
motivational insights factors interest in work
ranks the top with 712 points resulting an
average of 3.56 followed by recognition with
688 points weighing an average of 3.44. It
reveals that both the management and the
workers are in mutual understanding as the
interest in the work ranks high and the
recognition of the workers ability and skill
by the management is also at high level.
The motivational factors like awards and
rewards, compensation and friendliness with
co‐workers rank less than the general
average of 3. It envisages that the
management needs concentration on
awarding rewards and in paying
compensation where as the workers shall
develop friendliness with their co‐workers to
make the work life a quality one.
Findings
The following findings were observed:
1. Majority of the respondent are of age
group 31 to 45 years.
2. 57% of the respondents are with an
experience of more than 10 years.
3. 43% of the respondents are having college
level of education.
4. 59% of the respondents are in higher
income group i.e. 31,000-40,000.
5. 35% of the workers opinioned that their
supervisors are always accept their
suggestions and get positive motivations.
6. 53% of the workers strongly feel that
there is security for their job and only
one worker feel that there is no security
for the job.
7. The attitude of the supervisor towards the
welfare of the workers is positive for
70% of the workers only.
Suggestions
Improvement in rewarding and awarding
policies.
Introduction of Promotion policy at
operation level.
To give high motivation from the top
To provide more compensation from the company.
To provide special training programme
from the company related to their job
during working period.
Employees expect the quality of work to
be measured periodically be the
company.
Conclusion
From the study, it is clear that quality of
work life of employees in Southern Railway
is good. This research highlights some of the
small gaps in employee’s satisfaction
towards the company. Compared to other
companies believe in employee’s satisfaction
and brilliant productivity hours. Quality
mission includes not only the quality of the
products but also the Quality of Work Life.
Southern Railway aims to promote the
peaceful industrial relations and good
organization which is highlighted by
management and the employees. Since
employees are the backbone of the company.
So company should satisfy them in order to
improve the business in the higher
competitive market of the liberalized
economy.
References
1. Agarwal (2004) “Managing of Indian
Railways - The Future Ahead”, Manas
Publication, New Delhi.
2. Alexander Ardichvili and Alexander
Gasparishvili, Human Resource
Development in an Industry in
Transition: The Case of the Russian
Industriesing Sector, Human Resource
Development International, Vol.4, No.1,
March 2001, pp.47-63.
3. Behera K C, Human Resource in
Balance Sheet, IBA Bulletin, January
2006, pp.33-36.
4. C. B. Mamoria and S. V. Gankar
(2001), “Personnel Management Text &
Cases”, Himalaya Publishing house
Mumbai, XXI Edition.
5. Clatt, F. Veugh and Bernard Asbell,
Tapping the Human Resources – A
Strategy for Productivity, New York: