Economic Cooperation between Serbia
and the Member States of the Eurasian
Economic Union: Constraints and Potentials
Ivana BOŽIĆ MILJKOVIĆ
*Received: April 2, 2018 Revised: October 22, 2018 Accepted: November 11, 2018
Abstract
The aim of this paper is to measure the results of the recent economic cooperation achieved between Serbia and the member states of the Eurasian Economic Union on the basis of statistical data, and then, by applying an econometric model, to show the potential for future cooperation in the field of foreign trade and highlight the economic benefits of such cooperation. There are potentials for the development of foreign trade relations and cooperation between Serbia and the member states of the Eurasian Economic Union but they are not fully exploited. Their further development is conditioned by political relations between Serbia and the member states of the Eurasian Economic Union, and the progress of Serbia in the process of eurointegration.
Keywords: Economic cooperation, Serbia, Eurasian Economic Union, foreign trade, investments
JEL Code Classification:F02, F17
UDC: 332.1
DOI: https://doi.org/10.17015/ejbe.2018.022.05.
*
1.
Introduction
The recent political and economic history embodied in the process of globalization and regional connectivity has made the idea of creating a Eurasian Economic Union possible, realizing that this integration gets its place in international political and economic relations. The political events in Ukraine have meant that this country remains outside the Eurasian Economic Union, while Serbia, as a country in transition, has defined its Western European socio-political orientation and its strong intentions to join the European Union. The commitment of Serbia to the European Union means Serbia’s political stability, economic prosperity, a greater inflow of investment, and a better position in international relations. All this is true and has been partially realized, however, joining the EU is only one of the alternatives for integration, though Serbia gives it very high significance and the media promotes it as the best possible alternative. Any orientation of Serbia towards other integration, such as the Eurasian Economic Union, is of course possible, except that such a commitment would have numerous economic consequences for Serbia caused by the termination of the agreements and trade facilitation signed with the EU (Baturan, 2014). On the other hand, the eventual accession of Serbia to the EU would also cause a lull in economic relations and partial interruption of economic relations between Serbia and the Eurasian Economic Union countries. So, there are alternatives, but in economic terms, they are mutually exclusive and limited.
In this article, I have been researching potentials for the development of economic cooperation between Serbia and the countries in the Eurasian Economic Union. The basic hypothesis in this article is that the degree of economic development of the observed countries, expressed by the GDP, has a positive effect on the growth of the volume of their foreign trade. The second hypothesis is that other economic variables such as belonging to the same agreement or inward of foreign direct investment have an positive impact on the volume of bilateral trade when it comes to the countries of the Eurasian Economic Union and in the case of Serbia. The basic starting point is historical facts connecting Serbia with this group of countries and a comparative analysis of their economic development in the context of contemporary geostrategic relations. In the article used a Poisson Pseudo Maximum Likelihood (PPML) model such an econometric model that is applied in the measurement of potential trading flows and the prediction of bilateral trade (Silva & Tenreyro, 2006, 2015). The variables involved in the analysis of potential external trade are: GDP of each of the countries observed, distance of capitals, belonging to the same agreement and inward of foreign direct investment for each of the countries observed.
between Serbia and the member states of the Eurasian Economic Union have so far not given their full economic effects.
2.
Economic Results of the Transition Process in Serbia
The process of social and economic transition in Serbia began only after the major political changes at the end of 2000. This process was preceded by a political crisis in the former Yugoslavia, which culminated in the dissolution of the former state and the establishment and promotion of new independent states. Material damage and material losses, economic development under war conditions, high inflation, an economic blockade by the developed world and international organizations, refugees, and every kind of poverty put the economy into the background. At the very beginning of its implementation, the transition process was interrupted and delayed for a decade, which would have great economic and political consequences for Serbia. It wasn’t until the beginning of the 21st century that Serbia seriously and quickly entered the transition process, opting for the path of EU membership, but the problems inherited from the previous period, coupled with the problems caused by the current economic, political and social crisis, have significantly slowed down its course and diminished the quality of the resulting change (Landesmann, 2000).
Table 1. Macroeconomic indicators of Serbian economic development in
the period from 2000 to 2015
2000* 2005* 2008 2010 2012 2014 2015
GDP (USD, current prices) 9,218 32,189 54,947 45,290 47,242 51,253 42,688 GDP per capita 915 3,284 6,032 4,999 5,259 5,763 4,823
Inflation (in %) 85.4 9.2 8.1 6.1 7.3 2.1 1.4
Unemployment (in %) 12.1 32.4 28.5 20.0 24.6 20.1 18.5 External debt (% GDP) 201.2 50.2 28.3 41.8 56.2 70.4 73.4 Import value (in mil USD) 4,004 13,062 30,910 22,631 25,452 24,534 21,037 Export value (in mil USD) 2,347 6,974 15,799 14,437 16,492 20,178 18,458 Balance of external trade -1,657 -6,088 -15,111 -8,194 -8,960 -4,356 -2,579
*Note: Data for the years 2000 and 2005 refer to Serbia and Montenegro
Source: UNCTAD, Handbook of Statistics database: Unemployment data and External debt data: Statistical Office of the Republic of Serbia, 2017
for the largest share of exports and the inflow of foreign exchange into the country. By entering the transition process, most of these industrial enterprises were privatized, and the method and manner of implementing privatization largely determined the future stream of negative developments (Radulović & Goldberg, 2016). In the first years of transition there were already large problems in the business of most industrial companies, especially large companies that had made Serbian industry so well known in the former country and beyond. In the first years of this century, deindustrialization became one of the main features of the Serbian economy and its negative impact on the overall economic development of Serbia is still present today.
Becoming closer to the European Union and Serbia’s unambiguous aspiration towards obtaining member status have presented the Serbian economy with a number of challenges. One of them is the acceptance of the liberalization process, which partly relates to intraregional cooperation in the field of production, and trade and investment with other countries in transition; it also includes Serbia’s economic cooperation with the European Union member states. The European dimension of the liberalization process is an integral part of the Stabilization and Association Agreement and its focus is on foreign trade liberalization, which includes abolishing customs duties and administrative restrictions, and providing export incentives to transition countries in trade with the European Union (Stabilization and Association Agreement, 2013). Some of the former socialist countries of Central and Eastern Europe have already passed on their path of transition and had some experience that could been adopted by the Serbia as a model of successful transition. However, the political situation and the way economic policy in Serbia in the first years of transition have significantly limited the application of these experiences. (Goldberg & Nellis, 2008).
this century, tells us that Serbia was not prepared for the demanding process of trade liberalization (Handjiski, Lucas, Martin, & Sarisoy Guerin, 2010, 97; Božić Miljković, 2013).
3. The Economies of the Member States of the Eurasian Economic
Union
At the end of the last century, under the influence of globalization as a mega-process, there was a disintegration of once mighty countries in Southeast Europe and Eurasia. A number of new independent states were formed from these countries, which, within the coordinates of new international relations, built their own positions and economic identity. At the beginning of the 21st century came the first initiatives for new forms of cooperation between these countries and for their integration into various forms of regional integration. The basis of that association was the liberalization of their bilateral trade. In October 2000, in Astana, the capital of Kazakhstan, the agreement on the founding of the Eurasian Economic Community was signed by Russia, Belarus, Kazakhstan, Kyrgyzstan and Tajikistan. This agreement is rooted in the customs unions between Russia and Belarus, and Russia and Kazakhstan from 1995 (Tarr, 2016). During the two decades since the original idea of the Eurasian Economic Union the number of countries included in its group has changed (Molchanov, 2016). This integration received its current form in 2015 when Russia, Belarus and Kazakhstan were joined by Kyrgyzstan and Armenia. In this composition, the Eurasian Economic Union is today a successful implementation of Russia’s idea to establish closer relations with countries from the region into a customs union and common market (Filipowicz Czerewatcz, 2017, 332). In other words, the modern Eurasian Economic Union is a platform that, starting from the shared history of the Member States, their cultural and spiritual ties and their proximity to the market, creates new multilateral relationships that will develop economic cooperation. Also, it creates and strengthens a community of nations that will be able to confront the political and economic dominance of the United States and the European Union on the global market (Filipowicz Czerewatcz, 2017).
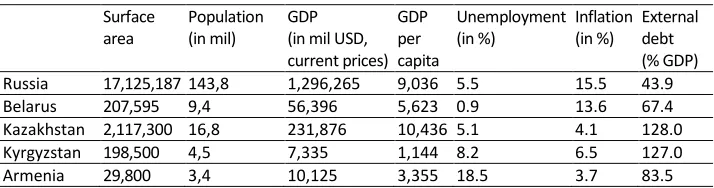
The territory of the Eurasian Economic Community covers 19,678 million square kilometers, which accounts for about 13% of the world’s surface. In this area there are about 178 million people, accounting for 2.7% of the total world population. This group of countries has aggregate GDP of approximately $2 trillion USD, and contributes to about 2.4% of the world’s GDP (Vinokourov, 2017). Unemployment, except in Armenia, is within the limits of the European average. The inflation rate is slightly higher in Russia and Belarus, while in other countries it is at the same level as the EU member states.
economically stable and developed countries which had a positive impact on the entire Eurasian Economic Union (Malle, 2013). An 18.4% share in the world’s production of natural gas and a 15% share in oil gives the Eurasian Economic Union a monopoly in the supply of these energies (EEI Facts and Figures, 2015). Their estimated energy reserves are: oil 9%, gas 25%, coal 23%, and electricity 5.5% of the total world resources (Knežević & Pavlović, 2014). Member States of the Eurasian Economic Union also have large reserves of silver, gold, platinum, molybdenum and uranium. In addition, these countries also have developed agricultural production: they are the world’s largest producers of sunflower and sugar beet. They have achieved a high share in the world production of vegetables, grains, grapes, meat and meat products. In world trade in industrial products, these countries are recognized for their export of potassium fertilizer, steel and iron.
Table 2. Macroeconomic indicator development of the Member States of
the Eurasian Economic Union in 2015
Surface area
Population (in mil)
GDP (in mil USD, current prices)
GDP per capita
Unemployment (in %)
Inflation (in %)
External debt (% GDP) Russia 17,125,187 143,8 1,296,265 9,036 5.5 15.5 43.9
Belarus 207,595 9,4 56,396 5,623 0.9 13.6 67.4
Kazakhstan 2,117,300 16,8 231,876 10,436 5.1 4.1 128.0
Kyrgyzstan 198,500 4,5 7,335 1,144 8.2 6.5 127.0
Armenia 29,800 3,4 10,125 3,355 18.5 3.7 83.5
Source: UNCTAD, Handbook of statistics, 2017
The advantages of a common market very quickly came to the fore. According to the annual report of the Eurasian Economic Commission, in the first half of 2014, a surplus in merchandise trade with third countries was recorded. Exports of goods produced in the Eurasian Economic Union on the markets of third countries in the first half of 2014 amounted to 288,2 billion, while imports during the same period were 153,9 billion USD. Approximately 11.1% of trade flow was between these countries, while 88.9% was with countries outside the integration (EEI: Facts and Figures, 2016, 18). However, in order to analyses economic benefits which the member states have the integration, and their distribution among the member states, we should start from a geostrategic context of Eurasian Economic Union.
The first ideas about creating a community of countries that geographically belong to Europe and Asia have their roots in the nineteenth century. According to Danilevsky(2007), who was a Russian thinker and a greatest proponent of this idea, the backbone of the Eurasian Economic Union should be composed of Russia, Kazakhstan, Ukraine, Belarus and Serbia. At that time, and even today, these countries have similar positions on many issues of international politics, they traditionally have good relations are not burdened by mutual political problems, and, with the exception of Russia, whose natural gas reserves enable greater economic stability and better development performance, all the others have similar levels of economic development. The enormous natural wealth that these countries have in the form of energy sources, mining and minerals, and their favorable conditions for developing agricultural production, are the basis for the development of trade cooperation with developed European and other countries, but there is also considerable potential for closer trade and economic cooperation with each other (Hartwell, 2016, 56).
While analyzing potential cooperation with the Eurasian Economic Union one must consider the political economy underpinning of this Union. In particular, two political economy issues arise in the connection with the Eurasian economic integration. The first one is related to the question of whether the union is only technocratic/economic project or whether it represents an instrument for Russia to gain and secure its political domination in the post-soviet region. The geographical position of Russia, between Europe and Asia, conditioned that Russia, in different historical periods, was the founder of numerous integration, in which it often dominated. Therefore, there are elements to see the Eurasian Economic Union in this way. The size of Russia, richness in oil and natural gas resources and impact it has in Europe and the world, provide it with the position of leader in the Eurasian Economic Union. Although in this group of countries, Kazakhstan also has significant wealth of ores and fuels, Russia takes the first place. Russia has 88.2 billion barrels of oil reserves (or 5.3% of all world production) and is the world’s largest oil producer (surpassing Saudi Arabia in 2011). Russia also holds 27% of the world’s known supply of natural gas as well as the second largest coal reserves in the world. Impressively, Russia is also self-sufficient in nearly all industrial raw materials in use today across its vast expanses, including (but not limited to) iron ore, manganese, chromium, nickel, platinum, diamonds, and gold. Additionally, the forests of Siberia contain an estimated 20% of the world’s timber. In nearly every commodity, Russia holds an absolute advantage (Hartwell, 2013). However, analyzing foreign trade flows it can be said that Russia’s main benefits from the EAEU are political rather than economic. The EAEU accounts for only 5 per cent of Russia’s trade – the bulk of the country’s exports go to the rest of the world (Dragneva & Wolczuk, 2017).
economic benefits, and more specifically, on the benefits of mutual trade between the countries of Eurasian Economic Union, it existed before integration and was based on multilateral and bilateral agreements between countries. It is to be expected that Russia, due to its dominant position in this integration, has the biggest benefits of membership in it. Russia’s gross domestic product represents about 86% of the GDP of the entire EAEU; Kazakhstan represents less than 10%, Belarus approximately 3.5%, Armenia and Kyrgyzstan less than 1% together (Strzelecki, 2016). Regarding the benefits from foreign trade, in the period from 2009 to 2015, all the countries of the Eurasian Economic Union have reduced the number of days required for the realization of the foreign trade transaction. In the same period, the costs of imports and exports were reduced in Armenia and Belarus, while in Kazakhstan, Kyrgyzstan these costs were increased (Tarr, 2016, 13). Observing the Eurasian Economic Union as a whole and the Member States in particular, we can notice that in the period from 2010 to 2015, the effects on the volume of foreign trade were different. In that period, total exports at the level of integration increased by 0.9%, and total imports by 2.1%; the volume of exports of Belarus to the integration market in 2015 was 1% lower, and imports were 3.3% higher than in 2010; the volume of exports of Kazakhstan, in the same period, increased by 0.7%, while imports decreased by 5.3%. In the observed period, Russia also recorded a slight increase of 0.6% on the export side and 0.9% on the import side (Vinokurov, 2017, 62). It is obvious that there are still no serious economic effects and benefits from integration. The absence of more visible benefits from integration and a more transparent way of distributing these benefits in the integration is also contributed by the economic situation in Russia recent years. Economic sanctions by Western countries, fall in oil prices on the world market, the fall in the ruble, increases in interest rates and inflation have caused a recession in Russia which is necessarily reflected in other member states of union. In economic terms, Russia lost the credibility it had within the group at the beginning of the creation of a customs union. Therefore, within the Eurasian Economic Union (except for Russia) there is no will to transfer economic sovereignty to supranational institutions, for example, to accept a monetary union and introduce a common currency.
4.
Economic Cooperation between Serbia and Member States of
the Eurasian Economic Union
process of political and economic transition, and they face a number of development problems, as well as the current problems of macro-economic stability. Their biggest single trade partner is Russia, and this partnership constitutes the basis of the Eurasian Economic Union, with the trend of continuing to advance and spread to other countries.
From the aspect of Serbia’s foreign trade, it is a geographically close market, and their economies are complementary to a significant extent, with prospects for the development of mutual economic cooperation in various fields. The two main directions in which this cooperation can take place are: the development of mutual trade, and cooperation in the field of investments. The formal basis for the development of foreign trade between Serbia and the Eurasian Economic Union is the free trade agreements with Russia in 2000 and with Russia, Belarus and Kazakhstan in 2010. These agreements, particularly the agreement with Russia, are a major advantage for Serbian business people. Serbia is one of the few countries involved in this form of agreement, but the potential for mutual trade, even with these agreements, is not used enough. Based on the data presented in Table 3, Serbia’s foreign trade with these countries is highly variable and depends on the political developments in Europe and the world, as well as its duties towards the European Union and the unfavorable structure of production and exports. The factors in favor of the development of their trade relations in the future are: geographical proximity, partial complementarity of their economies and the efforts of all of these countries to accelerate their economic development by means of foreign trade.
Table 3.
The value of Serbia’s foreign trade with Member States of the
Eurasian Economic Union in the period 2002 - 2015 (000 USD per year)
Import
2002* 2006* 2008 2010 2012 2014 2015
Armenia 2,051 3,165 462 785 272 101 34,912
Belarus 20,058 20,326 32,445 83,453 96,071 85,561 64,674 Kazakhstan 5,775 50,812 24,424 30,427 415,253 198,049 142,155 Kyrgyzstan 33 1,956 4,672 3,792 6,356 4,814 4,805 Russia 786,961 2,185,848 3,492,490 2,157,151 2,076,630 2,340,354 1,748,539 Total 814,878 2,262,107 3,554,493 2,275,608 2,594,582 2,628,879 1,995,085
Export
2002* 2006* 2008 2010 2012 2014 2015
Armenia 280 769 998 649 1,076 1,705 1,644
Belarus 2,986 15,075 15,665 40,769 69,529 72,787 37,755 Kazakhstan 1,185 5,395 11,773 4,576 11,425 16,846 2,440
Kyrgyzstan 245 60 98 - 32 1,389 8,024
Russia 90,897 311,419 550,963 534,747 866,197 1,029,133 724,826 Total 95,593 332,718 579,497 580,741 948,259 1,121,860 796,649 *Note: Data for the years 2000 and 2005 refer to Serbia and Montenegro
Based on available data on the value of Serbian imports and exports in 2015, I has calculated that the value of Serbia’s exports to Eurasian Economic Union countries in 2015 comprise 15.8% of its total exports, with only 10% of its total exports being achieved in the EU. On the other hand, 8.1% of Serbia’s total imports were from the Eurasian Economic Union in 2015, and only 4.7% came from EU countries. There is room for a mutual increase in foreign trade between Serbia and the Eurasian Economic Union, but the fact is that use of this potential is significantly limited by the policy which Serbia has towards EU accession. In this sense, the most problematic factor concerns the trade relations between Serbia and Russia. According to the Serbian Chamber of Commerce, Russia is fourth on the list of countries to which Serbia mostly exports, behind Germany, Italy and Bosnia, while at the same time Russia is Serbia’s third biggest import partner (PKS).The current structure of Serbia’s foreign trade with the Eurasian Economic Union relies on the structure of foreign trade between Serbia and Russia and shows no significant deviations from it.
Serbia’s strongest export trump card is its agricultural products, among which fresh fruit is the most common (apples, strawberries, peaches and cherries), followed by synthetic fibers and textile products made of synthetic fibers, medicines, automobile tires and floor coverings. Serbia’s main import from the Eurasian Economic Union is energy (crude oil and natural gas), then raw aluminum, refined copper wires, and various types of oils and greases.
The fact is that Serbia falls into the category of small countries with narrow markets, and its national, cultural and economic identity would be better positioned in the Eurasian Economic Union then in European Union. Adherence to the West European political and economic option is making the national economy of Serbia weak, putting it in an inferior economic position to economically developed countries and significantly reducing its importance in international relations. This is because the economic development of West European countries is based on the global market, with transnational companies as the main economic actors, while small transitional economies such as Serbia lose the essence of their independent economic development in such an environment, and their position of dependence on the centers of a large system is reinforced.
5. Methodology of Research
The paper uses a Poisson Pseudo Maximum Likelihood (PPML) gravity model such an econometric model that is applied in the measurement of potential trading flows and the prediction of bilateral trade. The analysis uses the STATA 14.2 software package and the PPML analysis script (Silva & Tenreyro, 2015).
The basis of the model is the equation of a linear gravity model. The basic elements of the linear gravity model equation are economic size (usually GDP) and geographical distance between the economic centers of two countries (mostly capitals). According to the principle of gravitational closeness, bilateral trade between the two countries is directly proportional to their gross domestic product and inversely proportional to the distance between them (Deardorff, 1998). In broad terms, the basic equation in a gravity econometric model can be written as: the measurement of trade that can be carried out between the two states, depending on their level of development, the distance between them and specific factors that affect the trade.
ij j i ij
D Y Y e
T * * (1)
Where, Tij – trade between countries i and j; e – constant; Yi– GDP of country i; Yj
– GDP of country j; Dij – distance between countriesi andj
countries: physical capital, human capital infrastructure, land and others (Frankel, Stein & Wei, 1995; Anderson & Wincoop, 2003, Baldwin & Taglioni, 2006).
The initial gravity model can be extended depending on what the analysis aims to achieve. There are a number of econometric methods and models that serve to evaluate the data presented in the gravity model. When it comes to a linear gravitation model, it is usual to estimate the logarithm of both sides of the model. However, in this paper, as a more convenient, will be used the Poisson Pseudo-Maximum Likelihood (PPML) estimator. The choice of this method is made because the bilateral trade variable contains zero values that are not randomly assigned. The PPML method is commonly used for count data, but recent papers confirmed its consistency, regardless of the distribution of the data, it could also be applied to continuous variables.
The basic equation of this model which includes the basic regressors, the GDP of the countries of the Eurasian Economic Union and the GDP of Serbia, the population of all those countries and the distances between the capital cities reads:
T
ij
e
0
Y
i1
Y
j2
N
i3
N
j4
D
ij5
e
uij (2)The complexity of the model requires the initial equation to be extended by additional variables that can affect the volume and intensity of the interconnected trade of the observed countries, and thus the expected outcome. Those are: Ipj –
dummy variable takes the value of 1 when trading countries belong to similar trade agreement, 0 otherwise; Iea – dummy variable membership in the Eurasian
Economic Union: takes 1 when the country is a membership, 0 otherwise; Ifdi –
dummy variable fdi inwards in Serbia from Eurasian Economic Union countries: takes 1 when inwards exist, 0 otherwise. The model also includes the specific effects of the country of exporters (μi) and importing (μj) countries that respect their social, cultural and historical diversity Finally, the model contains time-specific effects (ηt) reflecting the effects of individual invariant variables not explicitly included in the model (Jaćimović et al, 2018).
ijt t fdi eau pj ij
j i j i
ij
eY
Y
N
N
D
I
I
I
u
T
1*
2
3
4
5
exp(
)
(3)It is expected that the variable Y has positive values and is in a positive correlation with the degree of bilateral trade. It is also expected that the distance between the capital cities of the observed countries has a negative effect on the volume and intensity of their foreign trade. The distance among the capitals determines transportation costs. On small distances, there is no big difference in transport costs, however, at large distances this difference becomes significant.
Statistics database was used for the GDP data. The distance between Serbia and the Eurasian Economic Union countries was taken as the distance from Belgrade to their capitals. Data on the unilateral preferences of the Eurasian Economic Union countries in the analysis were downloaded from the WTO database. The starting point was the fact that in 2000 Serbia was granted a unilateral preferential by Russia and in 2010, Serbia was approved a one-sided preferential by the Customs Union of Russia, Belarus and Kazakhstan. I take 2011 as the first year of implementation of the preferential agreement between Serbia and the Customs Union of Russia, Belarus and Kazakhstan, although the agreement was signed in 2010. The reason for this is that before 2010 and before this agreement was signed, Serbia had an agreement on duty-free export to Russia. Although in that period Serbia was granted a unilateral trade concession from the EU, which, as an integral part of the Agreement on Stabilization and Association covered the whole period, the fact that none of these countries is a member of the EU makes its inclusion in the analysis of dummy variables that relate to EU membership irrelevant.
6
.Results
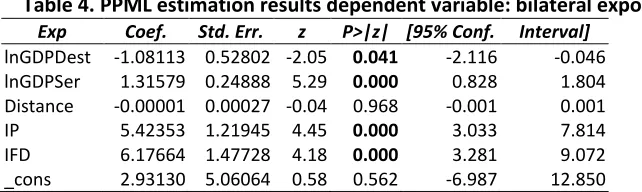
The expected values of the given parameters were measured using the regression model PPML. The analysis was done for two models: In the first model, the dependent variable is selected volume of exports from Serbia to the countries of EAU. As a regressor, the GDP of the country of destination (logarithmic value), GDP of Serbia (logarithmic value), the distance between the capitals, the existence of direct investments in Serbia, the same agreement, as well as EAU membership were taken as the regressors (the function removed this regressor from the model as insignificant). Estimated coefficients of regression of standard regressors in this model gave the expected results.
Table 4. PPML estimation results dependent variable: bilateral exports
Exp Coef. Std. Err. z P>|z| [95% Conf. Interval] lnGDPDest -1.08113 0.52802 -2.05 0.041 -2.116 -0.046
lnGDPSer 1.31579 0.24888 5.29 0.000 0.828 1.804
Distance -0.00001 0.00027 -0.04 0.968 -0.001 0.001
IP 5.42353 1.21945 4.45 0.000 3.033 7.814
IFD 6.17664 1.47728 4.18 0.000 3.281 9.072
_cons 2.93130 5.06064 0.58 0.562 -6.987 12.850
Source: Author’s calculation
On the basis of the obtained significance, it can be said that the best predictive power has GDP of destination (with a negative impact), then also GDP of Serbia (with a positive impact), and Ip – similar trade agreement (positive impact), an Ifdi (positive impact).
regressors remain unchanged. For example, if the value of the GDP of Serbia changes for one unit, then the volume of exports from destination increasing by 1.315 units. Also, if the inward of foreign direct investment from destination changes for one unit, then the volume of exports is increased by 6,177 units.
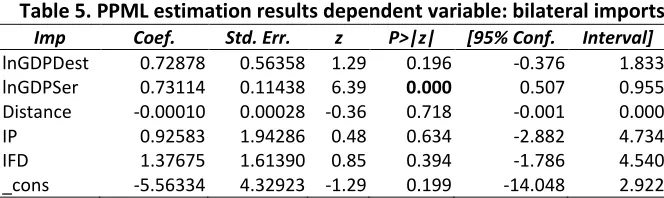
In the second model for the dependent variable, the volume of imports from Serbia and from Eurasian countries was selected. As regressors are taken GDP of the country of destination (logarithm value), Serbian GDP (logarithm value), the distance between the capital, the existence of direct investments in Serbia from the EAU countries, belonging to the same preferential agreement, as well as EAU membership were taken as the regressors (the function removed this regressor from the model as insignificant).
On the basis of the obtained significance, it can be said that the best predictive power is GDP of Serbia (with a positive impact).
Table 5. PPML estimation results dependent variable: bilateral imports
Imp Coef. Std. Err. z P>|z| [95% Conf. Interval]
lnGDPDest 0.72878 0.56358 1.29 0.196 -0.376 1.833
lnGDPSer 0.73114 0.11438 6.39 0.000 0.507 0.955
Distance -0.00010 0.00028 -0.36 0.718 -0.001 0.000
IP 0.92583 1.94286 0.48 0.634 -2.882 4.734
IFD 1.37675 1.61390 0.85 0.394 -1.786 4.540
_cons -5.56334 4.32923 -1.29 0.199 -14.048 2.922
Source: Author’s calculation
On the basis of the obtained significance, it can be said that the best predictive power has GDP of Eurasian countries and the GDP of Serbia. Both of those values have positive coefficients of regression 0.728 and 0.731, and both of them are with a positive impact on bilateral imports. In accordance with the expectations variables of belonging to the same agreement and foreign direct investment have positive effects on bilateral imports. The distance also has a minimal negative impact on bilateral imports.
7. Conclusion
investment is far below its potential. This has been partly influenced by decades of weakening of the Serbian economy caused by the fall in industrial production, reduction of domestic accumulation and reduced competitiveness of exports. Russia is a huge market that requires high and continuous delivery, and in the past this has been a big challenge for the Serbian economy. However, of all the countries in the Eurasian Economic Union, the most intensive foreign trade cooperation has taken place between Serbia and Russia, and Russia is an important partner of Serbia in the field of foreign direct investment. Among the other countries in this integration, Serbia’s next most important foreign trade partner is Kazakhstan, while the other countries have only symbolic economic cooperation. The benefits Serbia has for exporting to the markets of Russia, Belarus and Kazakhstan, which have been formalized by free trade agreements, is almost not used. Future implementation of these agreements will be conditioned by political factors, particularly relations between the EU and Russia and Serbia’s progress towards EU membership.
Acknowledgement
The paper was presented on EBES Conference which was held on the Faculty of Economic of Sapienza University in Roma, on the May 24th-26th 2017.
References
Anderson, J. & Wincoop, E. (2003). Gravity with Gravitas: A Solution to the Border Puzzle. American Economic Review, 93(1), 170-192. https://doi.org/10.1257/000282803321455214
Baldwin, R. & Taglioni, D. (2006). Gravity for Dummies and Dummies for Gravity Equation. NBER Working Papers 12516. National Bureau of Economic Research, Inc. Retrieved from
http://www.nber.org/papers/w12516.
Baturan, L. (2014). Trgovina između Srbije i Rusije u svetlu carinskih preferencija i međusobnih sankcija Rusije i zapadnih zemalja [Trade Between Serbia and Russia in the Light of Customs Preferences and Mutual Sanctions Between Russia and Western Countries].
Zbornik radova Pravnog fakulteta u Novom Sadu, 48(2), 431-445.
https://doi.org/10.5937/zrpfns48-6807
Božić Miljković, I. (2013). Mesto Srbije na spoljnotrgovinskoj mapi Evropske unije: stanje, problemi i perspektive [Place of Serbia on the Map of European Union: State, Problems and Prospects]. In: Nikolić, M & Todić, D. (Eds.), Strateški pravci razvoja i utvrđivanja položaja Srbije u savremenim međunarodnim odnosima[Strategic Directions of Development and Determination of the Position of Serbia in Contemporary International Relations]. Beograd: Institut za međunarodnu politiku i privredu.
Božić Miljković, I. (2014). Foreign Trade between Russia and the Balkans in the Context of Global Geostrategic Relations. Journal of Globalization Studies, 5(2), 60-72.
Cooper, J. (2013). The Development of Eurasian Economic Integration. In: Dragneva, R. and Wolczuk, K. (2013) Eurasian Economic Integration: Law, Policy and Politics. Cheltenham: Edward Elgar. https://doi.org/10.4337/9781782544760.00011
Danilevski, N. (2007). Rusija i Evropa [Russia and Europe]. drugo izdanje. Beograd: NOLIT Dosije.
Deardorff, A. V. (1998). Determinants of Bilateral Trade: Does Gravity Work in a Neoclassical World? In: Frankel A. J. (Ed.), The Regionalization of the World Economy. Chicago: University of Chicago Press.
Dragneva, R. & Wolczuk, K. (2017). The Eurasian Economic Union: Deals, Rules and the
Exercise of Power. Chatham House. Retrieved from
https://www.chathamhouse.org/publication/eurasian-economic-union-deals-rules-and-exercise-power
Eurasian Economic Integration: Facts and Figures (2016), Library of Eurasian Integration, Eurasian Economic Commission
European Parliament (2018). Serbia’s Cooperation With China, the European Union, Russia and United States of America. DG External Policies Report, Retrieved from http://www.europarl.europa.eu/RegData/etudes/STUD/2017/603854/EXPO_STU(2017)6038 54_EN.pdf
Filipowicz Czerewatcz, K. (2017). Economic and Geoeconomic Effects of the Eurasian Economic Union: Trade Aspects, In: Bilgin, M.H, Danis, H, Demir, E. & Can, U. (Eds.), Country Experiences in Economic Development - Management and Entrepreneurship. Cham: Springer International Publishing. https://doi.org/10.1007/978-3-319-46319-3_21
Frankel, J., Stein, E. & Wei, S. J. (1995). Trading Blocs and the Americas: The Natural, the Unnatural and the Supernatural. Journal of Development Economics, 47, 61-95.
https://doi.org/10.1016/0304-3878(95)00005-4
Goldberg, I & Nellis, J. (2008). Methods and Institutions – How do they Matter? Lessons from Privatization and Restructuring In The Post-Socialist Transitions. In: Privatization in Transition Economies: The Ongoing Story. Contemporary Studies in Economic and Financial Analysis, 90, 345-371.
Handjiski, B, Lucas, R, Martin, P. & Sarisoy Guerin, S. (2010). Enhancing Regional Trade Integration in Southeast Europe, New York: The World Bank working paper No 185.
Hartwell, C. A. (2013). A Eurasian (or a Soviet) Union? Consequences of Further Economic Integration in the Commonwealth of Independent States. Business Horizons, 56(4), 411-420.
https://doi.org/10.1016/j.bushor.2013.03.003
Hartwell, C. A. (2016). Improving Competitiveness in the Member States of the Eurasian Economic Union: A Blueprint for the Next Decade. Post-Communist Economies, 28(1), 49-71.
https://doi.org/10.1080/14631377.2015.1124554
Klasing, M, Milionis, P. & Zymek, R. (2015). Gravity Across Space and Time, ESE Discussion Papers no.256, Edinburgh: School of Economics, University of Edinburgh.
Knežević, B. & Pavlović, S. (2014). Savremeni procesi evroazijskih ekonomskih integracija [Contemporary Processes of Eurasian Economic Integration]. Međunarodna Politika, 1155-1156, 76-97.
Malle, S. (2013). Russia, the Eurasian Customs Union and the Asian Dimension, In: Dragneva, R. & Wolczuk, K. (Eds.), Eurasian Economic Integration Cheltenham: Edward Elgar.
https://doi.org/10.4337/9781782544760.00016
Molchanov, A. M. (2016). Eurasian Regionalisms and Russian Foreign Policy. London: Routledge. https://doi.org/10.4324/9781315580760
Radulović, B. & Goldberg, I. (2016). Unmet Expectations: The Case of the Serbian Privatization 2001-2015. Unpublished manuscript. Retrieved from https://www.researchgate.net/profile/Branko_Radulovic/publication/319417430_Unmet_e xpectations_The_Case_of_the_Serbian_Privatization_2001-2015.pdf
Silva, S.J.M.C. & Tenreyro, S. (2006). The Log of Gravity. Review of Economics and Statistics,
88(4):641-658. https://doi.org/10.1162/rest.88.4.641
Silva, S.J.M.C. & Tenreyro, S. (2015). PPML: Stata module to perfor Poisson pseudo-maximum likelihood estimation. Statistical Software Components S458102. Boston College Department of Economics.
Stiglitz, J. (2005). More Instruments and Broader Goals: Moving Toward the Post-Washington Consensus. WIDER Perspectives on Global Development. United Nations University: World Institute for Development Economics Research (ed.), Houndmills: Palgrave MacMillan.
https://doi.org/10.1057/9780230501850_2
Tarr, G.D. (2016). The Eurasian Customs Union among Russia, Belarus and Kazakhstan: Can it succeed where its Predecessor failed?. Eastern European Economics, 54(1), 1-22.
https://doi.org/10.1080/00128775.2015.1105672
UNCTAD (2017) Handbook of Statistics database, Retrieved on May 2017 from http://unctadstat.unctad.org/wds/ReportFolders/reportFolders.aspx?sCS_ChosenLang=en;. Vinokourov, E. (2017). Eurasian Economic Union: Current state and preliminary results.