Eurasian Journal of Business and Economics 2019, 12(23), 17-43.
Influence of Social Media Content on
Consumer Purchase Intention: Mediation
Effect of Brand Equity
Mersid POTURAK
*,
Sumeja SOFTIĆ
**Received: July 12, 2018 Revised: April 23, 2019 Accepted: April 26, 2019.
Abstract
Social media is forming an increasingly central part of how companies communicate their marketing strategies to their customers. This study aims to provide an empirical analysis of the impact social media communication has on brand equity and purchase intention using linear regression. Before conducting the analysis, a systematic literature review has been carried out in order to understand how the dimensions of social media create word of mouth i.e. electronic word of mouth (e-WOM) on social media platforms and how this e-WOM further influences brand equity and customers’ purchase intention of domestic brands in Bosnia and Herzegovina. 300 data sets were collected through a standardized online survey and analyzed in SPSS with the conclusion that all the constructs identified in this research have a significantly high correlation and impact on a customer’s decision to buy a domestic product The results of the empirical study showed that both firm-created and user-generated social media communication influence brand equity which creates of a fully mediated effect between e-WOM and the purchase intention.
Keywords: Social Media Communication, e-WOM, Brand Equity, Purchase Intention, Bosnia and Herzegovina
JEL Code Classification: M3, M31
UDC: 339.138
DOI:https://doi.org/10.17015/ejbe.2019.023.02
*
PhD, International Burch University, Bosnia and Herzegovina. E-mail:
[email protected] **1.
Introduction
The fast paced integration of Internet as a marketing tool in recent years has had a huge impact on how brands chose to communicate with their customers. The Internet has provided a huge platform for local and global brands to expand their market and acquire more customers than ever before.
An increasing number of consumers are embracing the internet and spend more time searching for information, which largely affects their purchase intentions. Given such opportunities, firms and their brands have dived into social media marketing, which emerged as the most popular and effective tool of marketing and communication.
As proposed by Bernoff and Li (2011) social media platforms offer an opportunity for customers to interact with other consumers, thus, companies are no longer the sole source of brand communication. Moreover, consumers are increasingly using social media sites to search for information and turning away from traditional media, such as television, radio, and magazines (Mangold & Faulds, 2009). This phenomenon has reduced marketers’ control of brand management (Berthon et al., 2007). Therefore, it is of crucial importance to understand that customers’ perceptions of brands are not anymore influenced only by what the companies communicate, but what other customers have to say about the particular brand as well. The viral dissemination of information among the people through social media is much stronger than the traditional media such as TV, radio, and print advertisements (Keller, 2009).
Social media marketing requires special attention and strategy building to achieve brand equity. Social media marketing is related to relationship marketing, where the firms need to shift from “trying to sell” to “making connections” with the consumers (Gordhamer, 2009). Companies need to keep away from “big campaigns” and stick with “small acts” since some small campaigns can easily reach lots of people and accomplish the objectives in a very short period of time (Coon, 2010). Social media marketing is also more different than traditional ways of communication as it provides the customers with a more sincere communication, trying to show what the brand is rather than trying to control its image.
The communication gets exposure to a large base of social media users in a very short time frame. With ever-increasing prevalence, social networking sites are being used by consumers to connect with one another, and increasingly to connect consumers with brands and vice versa (Wolny & Mueller, 2013). In addition, social media activities of brands can help to reduce preconception and misunderstanding toward brands, and to increase brand value by providing an online platform to the people for exchanging ideas and information (Kim & Ko, 2010).
The product reviews by consumers on social media can produce a positive or negative brand buzz and the messages on these virtual platforms affect consumer buying decisions (Vij & Sharma, 2013). As the values of a brand depend largely on their customers’ perceptions, domestic companies need to face the challenges of the digital era and monitor and engage their target audiences on social media platforms.
In light of such positive background, this study aims to fill the gap in the literature with respect to understanding the effects of e-WOM, which is created of user-generated and firm-created content on social media, towards consumers’ purchase intention, a topic of relevance as evidenced by many researchers, including Villanueva, Yoo, and Hanssens, (2008), Taylor (2013) and many other papers such as Christodoulides, Jevons and Bonhomme (2012), Smith, Fischer, and Yongjian (2012).
Results of this research will enable domestic brands to learn more about their clients and this work will be an important source of information for marketing managers in terms of planning and developing their strategies.
In the following chapters a comprehensive literature review is provided in order to understand how the dimensions of social media create word of mouth i.e. electronic word of mouth (e-WOM) on social media platforms and how this e-WOM further influences brand equity and customers’ purchase intention of domestic brands in Bosnia and Herzegovina. Also, how data were collected for this study is presented in methodology section where measurement instrument development process is explained as well as population and sample of the study. Moreover, results and discussion sections as well as conclusion on social media content influence on consumer purchase intention.
2.
Literature Review
2.1.
Firm-Created Content
Pillai, 2013). Companies are now aware of the prevailing need to focus on developing personal two-way relationships with consumers to foster interactions (Bernoff & Li, 2011).
Marketing managers expect their social media communication to engage with loyal consumers and influence consumer perceptions of products, disseminate information, and learn from and about their audience (Brodie et al., 2013). This possible due the new and appealing ways companies and customers can retain relationships with one another.
In contrast to traditional sources of firm-created communication, social media communications have been recognized as mass phenomena with extensive demographic appeal (Kaplan & Haenlein, 2010). As mentioned earlier, this popularity of the implementation of social media communication among companies can be explained by the viral dissemination of information via the Internet (Bernoff & Li, 2011) and the greater capacity for reaching the general public compared with traditional media (Keller, 2009). Additionally, Internet users are turning away from traditional media and are increasingly using social media channels to search for information and opinions regarding brands and products (Mangold & Faulds, 2009).
2.2.
User-Generated Content
The Internet and Web 2.0 have empowered proactive consumer behavior in the information and purchase process (Burmann & Arnhold, 2008). The growth of online brand communities, including social networking sites, has supported the increase of user-generated social media communication (Gangadharbatla, 2008).
User-generated content (UGC) is a rapidly growing vehicle for brand conversations and consumer insights (Christodoulides et al., 2012).
According to the content classifications introduced by Daugherty, Eastin, and Bright (2008), UGC is focused on the consumer dimension, it is created by the general public rather than by marketing professionals and is primarily distributed on the Internet. A more comprehensive definition is given by the organisation for Economic Cooperation and Development (OECD, 2007): “i) content that is made publicly available over the Internet, ii) content that reflects a certain amount of creative effort, and iii) content created outside professional routines and practices”.
As identified by Campbell et al. (2011) consumers contribute to the process of content creation for reasons such as self-promotion, intrinsic enjoyment, and desires to change public perceptions.
helps define a brand. User-generated content describes “the sum of all ways in which people make use of social media, usually applied to describe the various forms of media content that are publicly available and created by end users” (Kaplan & Haenlein, 2010, p. 61).
2.3.
Word of Mouth – WOM
Word of Mouth (WOM) has been the object of multiple studies in the field of marketing, during the past years. Authors have sometime associated this concept with personal recommendations (Arndt, 1967), interpersonal communication (Godes & Mayzlin, 2004), interpersonal relationships (Arndt, 1967), informal communication (Silverman, 2001), personal and interpersonal influence (Brown & Reingen, 1987) and with informal advertising (Arndt, 1967). WOM definitions by Westbrook (1987), Bone (1995) and Silverman (2001) all focused on the informal aspect of WOM communication, the communicator’s independence from a commercial source, and on the phenomenon of information diffusion.
For a consumer to be considered involved in a WOM-type conversation, the message being transmitted and the medium used for the transmission must be perceived as independent from influence by the company (Silverman, 2001).
WOM communications can occur face to face, by phone, email, mailing list, or any other means of communication (Silverman, 2001). Additionally, there are personal and impersonal sources of recommendations that have to be considered such are friends, family, and acquaintances who act as personal sources of recommendations (Brown & Reingen, 1987).
Others recognized WOM vehicles, regarded as impersonal sources of WOM recommendations include columns, articles, and commentary by journalists, columnists, consumers, and experts to be found in newspapers, magazines and specialized publications.
2.3.1.
Electronic word-of-mouth (e-WOM)
Since the arrival of information technologies and the Internet, word-of-mouth has acquired several new names. Electronic word-of-mouth (e-WOM) has been defined as all informal communications directed at consumers through Internet-based technology related to the usage or characteristics of particular goods and services, or their sellers, based on the definition of WOM by (Arndt, 1967).
The consumer takes an active part in the advertising process of a company by becoming its supporter, advertising propagator, and, on occasion, advertising concept developer or salesperson (Phelps et al., 2004). In this instance, consumers are perceived as independent from the company, as they are not employees of it.
e-WOM can create virtual relationships and communities, with influence far beyond the readers and producers of WOM, which creates a new type of reality by influencing readers during their online information searches (Litvin, Goldsmith, & Pan, 2008).
Accordingly, delivering the right content to consumers becomes vital for the companies to take advantage of the power in e-WOM. Practically e-WOM is known as for instance “like” or “share” and many researchers indicate that the e-WOM is the key to successful online marketing (Hennig-Thurau et al., 2004, Campbell et al., 2011). There are multiple ways of how to spread the e-WOM online (social media, blogs, e-mail, viral etc.). Ellis-Chadwick and Doherty (2012) find interaction as one of the most effective tactics for spreading e-WOM and believe that viral messages are one of the most effective interactive tools.
The work of Eisingerich et al. (2015) focuses on the differences that exist between traditional word-of-mouth and social media word-of-mouth. Consumers are less willing comment about products because of the perceived social risk of WOM in social media settings. This situation is visible even for their favorite brands. This risk is explained by the fact that the reviews are open to a broader audience. Furthermore, these comments are read by people who are unknown to the writer which causes more stress. On the other side, consumers are more willing to provide feedback using traditional word-of-mouth.
The analyses of Hu (2015) pointed out that on Twitter, when it comes to choosing which products to buy individuals by far rely on the comments and reviews which family and friends give them. The research showed that news associations and brands are the second and third dependable sources; while government officials on Twitter are considered the least trustworthy. The amount of trust an individual has on someone's opinion changes from product to product. For instance, when individuals were not sure on which product to buy, the apparent validity of entertainment stars was higher when they expected to purchase an economical product than a costly one. Nevertheless, paying little mind to the item category, family and friends were the most dependable ones and legislators were the minimum credible sources on Twitter. Likewise, the strength of relationship between the sender and the receiver sets the level of trust the reader has (Koo, 2016).
purchasers along the chain of being aware of the product to liking it. The undeniable ramifications for advertisers are to keep up a "solid" network page by posting essential and applicable item information. Additionally, as with different types of e-WOM, the receivers of the message will probably navigate to the proposed item page if the message piqued their interest.
Even though source expertise is a crucial factor in the decision making, the trustworthiness of the writer is the variable which allows the reader to continue with the purchase (O’Reilly et al., 2016). The reader does not care about the level of knowledge the commenter has if she or he sees him as an unreliable person. Consumers or the readers of the comment come to a conclusion based on the approach of the writer. Certain phrases which give the impression of marketing techniques are immediately ignored and never taken as a genuine comment with the intentions to help the reader.
The research of Mohammed (2016) was conducted in the field of tourism. The sample consisting of 216 tourists were asked about the importance of eWOM before they decide on their vacation spot. The study showed that there is a relation between destination trust and travel intention. In addition, the comparison between the genders demonstrated that travel intention plays a bigger role for women than men. The most important factor influencing the travelers are found to be knowledge the writer has about the place he/she has visited (Coursaris, Osch & Albini, 2017). Since no boundaries exist in terms of who can write a comment, the reader has to decide on whether or not the commenter is someone they should trust (Atika, Kusumawati & Iqbal, 2017). If the reader believes that the commenter is an expert than he/she will finish with the purchase of the product/service.
2.3.2.
The Relationship between e-WOM and Purchase Intention
Many researchers have studied the effect of e-WOM, in order to prove its’ significant relationship to purchase intentions. Numerous definitions of electronic word-of-mouth (eWOM) have been made throughout literature. Hennig-Thurau et al. (2004) have defined this marketing strategy as “Any positive or negative statement made by potential, actual, or former customers about a product or company which is made available to a multitude of people and institutions via the Internet”.
The e-WOM phenomenon has been changing people’s behavior because of the growth of Internet usage. People often make offline decisions on the basis of online information and tend to rely on the opinions of other consumers when making decisions about matters such as which movie to watch or what stocks to invest in (Dellarocas, 2003). The online market enables customers to write recommendations that influence potential consumers (Lee, Park, & Han, 2008).
positive e-WOM is positively related to purchase intentions and has a greater effect on purchase intentions than ads. The findings suggest that firms should encourage members to share their knowledge or experience rather than just posting ads, especially in non-transaction virtual communities. In addition, low-involvement ads have negative effects in virtual communities, so firms should design high-involvement ads, such as virtual props, blogs, and rich media, to attract the attention of potential customers.
This argument is supported by the research carried out by the Nielsen (2013) in which 78% of the customers depend on the recommendation from the online word of mouth to make their decisions. However, in order to fully understand the effects of e-WOM on purchase decisions, another concept, well known as brand equity, must be explored.
The work of Eisingerich et al. (2015) focuses on the differences that exist between traditional word-of-mouth and social media word-of-mouth. Consumers are less willing comment about products because of the perceived social risk of WOM in social media settings. This situation is visible even for their favorite brands. This risk is explained by the fact that the reviews are open to a broader audience. Furthermore, these comments are read by people who are unknown to the writer which causes more stress. On the other side, consumers are more willing to provide feedback using traditional word-of-mouth.
2.4.
Brand Equity
Even though there is a vast amount of new terms in literature related to the latest technological advances in the online community, there is one well know term to marketers, which is known to have the power of influencing customers’ purchase intentions.
“Brand equity gives value to the firm by increasing the effectiveness of marketing programs. The components of brand equity allow a firm to develop a competitive advantage over other players. Ultimately that leads to higher price earnings ratios and enhanced shareholder value, achieved because of brand loyalty of customers” (Padhy & Sawlikar, 2018)
As defined by Aaker (1991) brand equity is a “set of brand assets and liabilities linked to a brand, its name and symbol that add to or subtract from the value provided by a product or service to a firm and/or to that firm’s customers”. He further defines brand equity as a multidimensional concept with first four core dimensions which are brand awareness, perceived quality, brand associations and brand loyalty.
The consumer based aspect is mainly about consumer mind-set which can be described using constructs like attitudes, awareness, associations, attachments and loyalties. Whereas the firm based aspect talks about product market outcomes such as price premium, market share, relative price, and financial market outcomes such as brand’s purchase price and discounted cash flow of license fees and royalties (Keller & Lehmann, 2006).
Punj and Hillyer (2004) suggest in their study that consumer-based brand equity is said to be a set of brand-related associations held by the consumer in memory. In this context, brand equity can be taken as being largely attitudinal in nature comprising of beliefs, affect, and other subjective experiences related to the brand like brand attitude and brand image. Consumer-based brand equity constructs measure the awareness, attitudes, associations, attachments and loyalties of consumers related to a particular brand (Keller & Lehmann, 2006).
In addition, it is worthwhile to give a proper definition to the term “brand” which refers to a combination of names, signs, symbols, and designs through which customers can identify the offerings of a specific company and distinguish these offerings from those of competitors (American Marketing Association, 1960). A brand can be considered as a cluster of functional and emotional values which are unique and can provide customers with favorable experience (De Chernatony, Drury, & Segal-Horn, 2006).
A successful brand is valuable, since it can enables marketers to gain competitive advantages by facilitating potential brand extensions, developing resilience against competitors’ promotional pressures, and creating entry barriers to competitors (Rangaswamy, Burke & Oliva, 1993).
2.5.
Brand Awareness
Brand awareness refers to the strength of a brand’s presence in consumers’ minds and is an important component of brand equity (Aaker, 1991). He further acknowledged several levels of brand awareness, ranging from mere recognition of the brand to dominance, which refers to the condition where the brand involved is the only brand recalled by a consumer. His definition of brand awareness is as follows: “the ability of the potential buyer to recognize and recall that a brand is a member of a certain product category” (1991, p. 61). Also Padhy and Sawlikar (2018) defined brand awareness as “whether and when consumer knows the brand and brand image i.e., how the consumer associates the brand with him.”
2.6.
Brand Association
Further, Aaker (1991) suggested that brand associations could provide value to the consumer by providing a reason for consumers to buy the brand, and by creating positive attitudes/feelings among consumers.
Some other researchers like Rio, Vazquez, and Iglesias (2001) propose that brand associations are a key element in brand equity formation and management. In this respect, high brand equity implies that consumers have strong positive associations with respect to the brand.
2.7.
Perceived Quality
Perceived quality is another important dimension of brand equity (Aaker, 1991). “Perceived quality is not the actual quality of the product but the consumer’s subjective evaluation of the product” (Zeithaml, 1988). It is very important to understand the importance of it in order to produce a competitive advantage.
Nowadays, many companies have based their strategies upon customer-driven quality in order to create customer satisfaction and value by consistently and profitably meeting customer’s needs and preferences. Kotler (2000) also points out that there is a very strong connection among product and service quality, customer satisfaction, and company profitability.
2.8.
Brand Loyalty
Brand loyalty is a major component of brand equity. (Aaker, 1991) defines brand loyalty as: “a situation which reflects how likely a customer will be to switch to another brand, especially when that brand makes a change, either in price or in product features”.
Javalgi and Moberg (1997) identified brand loyalty according to several perspectives, which are behavioral, attitudinal, and choice. While behavioral perspective is based on the amount of purchases for a particular brand, attitudinal perspective incorporates consumer preferences and dispositions towards brands. Definitions regarding the choice perspective focus on the reasons for purchases or the factors that may influence choices.
Moreover, Oliver (1997) defines brand loyalty as a deeply held commitment to rebuy or repertories a preferred product or service consistently in the future, despite situational influences and marketing efforts having potential to cause switching behavior. Oliver’s definition emphasizes the behavioral dimension of brand loyalty, whereas Rossiter and Percy (1987) argued that brand loyalty is often characterized by a favorable attitude towards a brand and repeated purchases of the same brand over time.
2.9.
The Effects of Brand Equity on Purchase Intention
Although empirical evidence indicated that brand equity can affect purchase intention in various contexts (Ashill & Sinha, 2004; Chang & Liu, 2009) the number of studies which apply Aaker’s brand equity model to measure the effect of its dimensions on purchase intention is limited.
Some studies have suggested that high levels of brand equity drive permanent purchase of the same brand. Loyal customers tend to purchase more than moderately loyal or new costumers (Yoo et al., 2000). A positive attitude toward a brand influences a customer’s purchase intention (Keller & Lehmann, 2006). In addition, more positive costumer perceptions of the superiority of a brand are associated with stronger purchase intentions (Aaker, 1991).
Also, the interrelationship among e-WOM and brand equity is another key proposition that needs to be addressed in order to understand its’ effect on purchase decisions.
A study done by Ha (2004) indicates that electronic word of mouth has a particular strength, which can raise the brand awareness, and subsequently affect the consumer behaviour. In addition, word of mouth can positively enhance brand association respectively (Page & Lepkowska, 2004). According to Jansen et al. (2009), electronic word of mouth plays a vital role in expressing brand satisfaction and would have impact on brand equity. However, theoretical interrelationships among electronic word of mouth and brand equity have been proven, but mediating relationship among these constructs has not been evaluated.
For that reason, another objective of this research was to identify the interrelationship between electronic word of mouth and brand equity, given that this is still a highly unexplored topic, especially in the context of Bosnia and Herzegovina.
3.
Research Context
Internet use is widespread throughout the world, and in recent years, emerging countries have been catching up to the developed countries – both in their adoption of mobile technology as well as their use of social media.
According to Pew Research, once people in emerging countries gain access to the Internet, they begin to adopt it into their lives very quickly. Among the top social sites used in developing countries, Facebook and Twitter rank the highest.
Social media serves multiple purposes in developing countries – from political coordination to history and culture preservation, to accountability. A very strong reason for this is the far reaching power of social media and the voice it gives to the emerging countries and the fact it serves as a form of empowerment.
As it’s obvious in developed countries, social media use has incredible power – to share ideas, express opinions, share breaking news, as well as promote causes that are important to various groups and organizations. In developing countries, this is no different.
Therefore, many Internet users in developing countries are early adopters of social media, in part, because they are eager to try out the latest technology. In doing so, many social media users in emerging countries are using social media as a form of empowerment as well as self-preservation.
Bosnia and Herzegovina is no different than other emerging countries, when Internet and social media usage is in question. Even though there is a lack of official statistics and reliable research in Bosnia and Herzegovina that shows the current active population that uses social media networks and what their underlying motivations might be, there are few sources that recognize BIH as a booming population that started using the Internet and social networks during recent years.
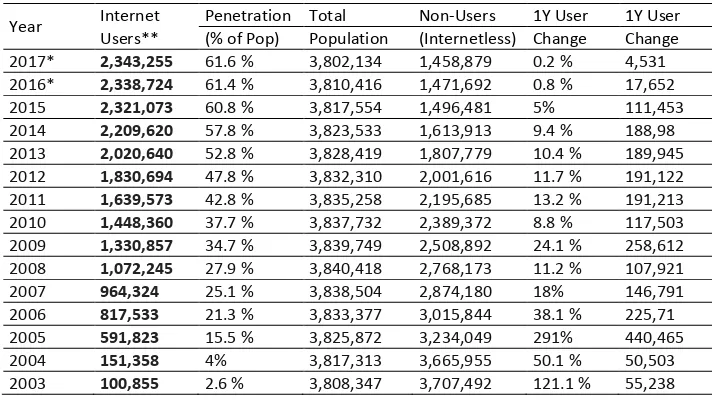
According to ITU (2016), which is the United Nations specialized agency for information and communication technologies, a rapid increase in the number of Internet users in BiH was evidenced, from 964,324 in 2006 up to 2,209,620 in 2013. The overall Internet penetration data shows a rapid expansion in Internet use in BiH since 2003, when it was only 4 percent, up to 61.6 percent in 2016. (Table 1)
The emergence of new telecommunication and Internet providers, along more accessible and affordable mobile devices, has made the numbers exponentially grown over the years to a sum of 2,343,255 Internet users in 2017, which makes up 61.6% of the whole BIH population and represents 0.1% of World Internet Users.
Table 1. Penetration of Internet users in BIH, 2003 -2017
Year InternetUsers**
Penetration Total Non-Users 1Y User 1Y User (% of Pop) Population (Internetless) Change Change 2017* 2,343,255 61.6 % 3,802,134 1,458,879 0.2 % 4,531 2016* 2,338,724 61.4 % 3,810,416 1,471,692 0.8 % 17,652 2015 2,321,073 60.8 % 3,817,554 1,496,481 5% 111,453 2014 2,209,620 57.8 % 3,823,533 1,613,913 9.4 % 188,98 2013 2,020,640 52.8 % 3,828,419 1,807,779 10.4 % 189,945 2012 1,830,694 47.8 % 3,832,310 2,001,616 11.7 % 191,122 2011 1,639,573 42.8 % 3,835,258 2,195,685 13.2 % 191,213 2010 1,448,360 37.7 % 3,837,732 2,389,372 8.8 % 117,503 2009 1,330,857 34.7 % 3,839,749 2,508,892 24.1 % 258,612 2008 1,072,245 27.9 % 3,840,418 2,768,173 11.2 % 107,921 2007 964,324 25.1 % 3,838,504 2,874,180 18% 146,791 2006 817,533 21.3 % 3,833,377 3,015,844 38.1 % 225,71 2005 591,823 15.5 % 3,825,872 3,234,049 291% 440,465 2004 151,358 4% 3,817,313 3,665,955 50.1 % 50,503 2003 100,855 2.6 % 3,808,347 3,707,492 121.1 % 55,238
As it is the largest social network in BIH, it is worthwhile to mention that there were 1.5 million Facebook users in Bosnia as of 2016, according to Socialbakers (2016), which is an 68.10% Facebook penetration rate, where Facebook receives more than 650,000 unique visitors a day from Bosnian users. Facebook membership in Bosnia-Herzegovina is split with 54% males and 46% females and the majority of Facebook members are aged between 18 and 34 years old. The most liked pages are those of political parties, followed by news portals and local brands, as well as domestic public figures, including singers, actors and sport stars.
3.1. Conceptual Framewor
k
The research model has been conceptualized and developed by the usage of identified constructs from the systematic literature review in order to explore the role of e-WOM on the final customer’s purchase decision.
Figure 1. Conceptual Framework of the Study
Purchase intension E-WOM
User genereted social media communication
Firm created social media communication
Accordingly, the main hypothesis of this study is as follows:
H1: There is a significant relationship between E-WOM and customers’ purchase intention of domestic brands in Bosnia and Herzegovina
Hypotheses that support the main hypothesis are outlined below:
H2: User-generated social media communication has a significant effect on E-WOM
H3: Firm-created social media communication has a significant effect on E-WOM
H4: Brand Equity mediates the relationship between E-WOM and customers’ purchase intention
Considering proposed conceptual framework of the study and hypothesis the main objectives of the study are presented as follows:
Explore the utilization of social media marketing activity of domestic brands in Bosnia and Herzegovina
Quantify constructs concerning the purchase intentions of customers in
association to social media activity of domestic brands.
Identify the influence of certain factors that explain purchase intentions of customers in the context of social media
In order to reach the research objectives, this study will try to give answers to the following questions:
What is the effect of user-generated and firm-created social media
communication on e-WOM?
What is the effect of e-WOM on purchase intentions?
What is the effect of brand equity on the relationship between e-WOM and customer’s purchase decision?
3.2.
Research Methodology
The research approach used here is deductive in its nature. In the literature review it’s described in details how e-WOM is formed and all the steps that need to be completed for that.
3.2.1.
Measurement Method
As we are interested in the collection of original data, but not all respondents can be reached personally, this research used a survey to give us the possibility of gathering primary and enough reliable data.
The survey technique used in the study is a structured questionnaire. The questionnaire consisted of 3 main parts that collected personal information (i.e. gender, age, etc.), identified the detailed usage of social media networks and gathered personal opinions on factors which measured the constructs in this research.
3.2.2.
Instrument Development
Before the start of the questionnaire, a detailed research was conducted, with an aim to get a closer insight into customers’ purchase intentions against social media communication of domestic brands in Bosnia and Herzegovina.
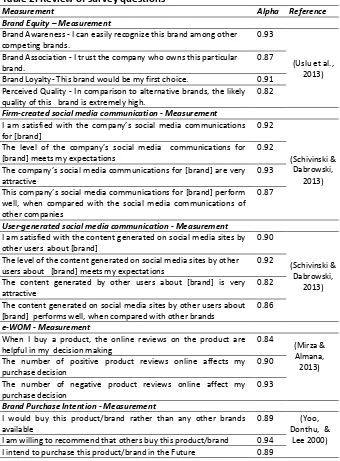
Factors measuring the effects of firm-created and user-generated content were adapted from Schivinski and Dabrowski (2013) as outlined in table 2. Another important construct derived from the literature is the brand equity that was used in this research to identify the medium effect between e-WOM and purchase intention. Aaker’s proposition of brand equity dimensions from 1991 defined as brand loyalty, perceived quality, brand associations and brand awareness are the most common dimensions used for measuring this construct among several researchers, also outlined in table 2.
Measurement scales for the purchase intention were adapted from (Yoo, Donthu and Lee, 2000), whereas the e-WOM variable used an alternation of measurement scales from (Mirza & Almana, 2013). Five-point likert scales have been selected to measure all constructs in this research with the measurement from “Strongly disagree” to “Strongly Agree”. Data Sampling
In terms of sampling, the target group of respondents for this research included active social media users in Bosnia and Herzegovina. Social networking statistics show (as of 2015) that around 1.5 million social media users exist in the country. The largest age group among social media users is 18-24, followed by age 25-34.
Even though these statistics apply to Facebook users, it is worthwhile to mention that this social media site is the most used social media network in Bosnia and Herzegovina, as mentioned in the literature review. Male users slightly dominate female users according to the statistics.
of the measurement scales for all the constructs before administering the actual questionnaire. Even though 320 data sets were collected, 32 of them were considered unfinished, because of incomplete or missing data. Therefore, the final number of questionnaires included was 300.
Table 2. Review of survey questions
Measurement Alpha Reference
Brand Equity – Measurement
Brand Awareness - I can easily recognize this brand among other competing brands.
0.93
(Uslu et al., 2013) Brand Association - I trust the company who owns this particular
brand.
0.87
Brand Loyalty- This brand would be my first choice. 0.91 Perceived Quality - In comparison to alternative brands, the likely
quality of this brand is extremely high.
0.82
Firm-created social media communication - Measurement
I am satisfied with the company’s social media communications for [brand]
0.92
(Schivinski & Dabrowski,
2013) The level of the company’s social media communications for
[brand] meets my expectations 0.92
The company’s social media communications for [brand] are very attractive
0.93
This company’s social media communications for [brand] perform well, when compared with the social media communications of other companies
0.87
User-generated social media communication - Measurement
I am satisfied with the content generated on social media sites by other users about [brand]
0.90
(Schivinski & Dabrowski,
2013) The level of the content generated on social media sites by other
users about [brand] meets my expectations
0.92 The content generated by other users about [brand] is very attractive
0.82
The content generated on social media sites by other users about [brand] performs well, when compared with other brands
0.86
e-WOM - Measurement
When I buy a product, the online reviews on the product are
helpful in my decision making 0.84
(Mirza & Almana, 2013) The number of positive product reviews online affects my
purchase decision
0.90 The number of negative product reviews online affect my purchase decision
0.93
Brand Purchase Intention - Measurement
I would buy this product/brand rather than any other brands available
0.89 (Yoo, Donthu, &
4.
Findings
4.1.
Descriptive Analysis of the Sample
Even though 332 responses were submitted, only 300 out of these were used in the analysis. Incomplete questionnaires, as well as the ones where respondents have not become a fan of any domestic brand have been rejected. The sample was a male-dominant one (54.7% were male). The majority of respondents were in the 21-25 age group (52.7%), followed by 25-30 (36%), below 20 (6.3%), 30-35 (4.3%) and above 35 (0.7%). Age distribution represents statistics that show that the largest social media user group in Bosnia and Herzegovina is in the 21-30 age groups. All respondents were from Bosnia and Herzegovina.
Educational background of respondents, where 50.3% had a bachelor’s degree, 27% had a master’s degree, 22.7% had a high school diploma.
In the same sample, 46% were employed in the private sector, 45.3% were students 3.7% were employees in the public sector, 2.7% were unemployed and the same percent (2.7%) were self-employed.
The time the sample group spends on social media sites is as follows: 54.3% uses them more than two hours a day, 38.7% one to two hours a day, 6% less than one hour a day and 0.3%, 0.7% one to two hours a week and 0.3% other.
4.2.
Validity and Reliability Test
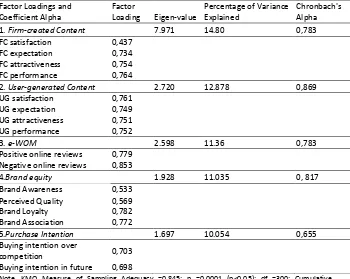
In order to group the variables for easier identification of significant relationships an explorative analysis has been conducted. The factor analysis grouped similar variables into dimensions. The aim of the analysis was to reduce the number of statements and to group related items together. As it can be identified from the table 3, the scale was grouped into five components.
concluded the measurement scales have a higher degree of convergent validity. The result of discriminant validity (also presented in Table 3.) indicate that items were not cross loading and supported different constructs respectively because whole items were allocated according to the different constructs.
For the consistency reliability of the items among the constructs, Cronbach alpha reliability analysis test was used. Based on Cavana et al. (2001), Cronbach alpha with the value of greater than 0.70 is considered as an acceptable and good. According to Table 3, the values of Cronbach Alpha for all of the tested constructs varied from lowest .665 to highest .869. Therefore, it can be concluded that all the measurement scales for the constructs are reliable, stable and consistent.
The final components used to carry out the research included the dimension of firm-created content and user-generated content. The following component included the dimensions of brand equity, measured by the 4 brand equity items constructed by Aaker (1991) which are brand association, brand awareness, perceived quality and brand loyalty. The next component comprised of the E-WOM variables, whereas the final factor was identified as the purchase intention.
Table 3. Factor Loadings and Coefficient Alpha
Note. KMO Measure of Sampling Adequacy =0.845; p =0.0001 (p<0.05); df =300; Cumulative Percentage Rotation Sums of Squared Loadings = 68.368
Factor Loadings and Coefficient Alpha
Factor
Loading Eigen-value
Percentage of Variance Explained
Chronbach's Alpha
1. Firm-created Content 7.971 14.80 0,783
FC satisfaction 0,437
FC expectation 0,734
FC attractiveness 0,754
FC performance 0,764
2. User-generated Content 2.720 12.878 0,869
UG satisfaction 0,761
UG expectation 0,749
UG attractiveness 0,751
UG performance 0,752
3. e-WOM 2.598 11.36 0,783
Positive online reviews 0,779 Negative online reviews 0,853
4.Brand equity 1.928 11.035 0, 817
Brand Awareness 0,533 Perceived Quality 0,569
Brand Loyalty 0,782
Brand Association 0,772
5.Purchase Intention 1.697 10.054 0,655
Buying intention over
competition 0,703
After the exploratory factor analysis and the reliability have been analyzed, a descriptive analysis of the variables was conducted. Given that the answers were based on a 5 point Likert scale, where the lowest number (1) indicated “Strongly Disagree”, whereas the highest number (5) had the meaning of “Strongly Agree”, we can say that the sample highly agreed with the statements employed in the questionnaire by looking at the means of the constructs.
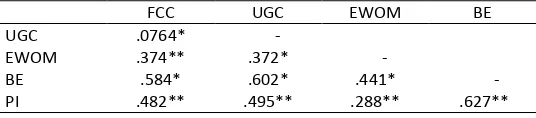
However, in order to identify the relationships of these constructs in more detail, a correlation analysis was run. The results presented in table 4 shows a highly positive and significant relationship among all constructs at the 0.01 level (2-tailed), which means the more firm-created and user-generated content is available to users, there is an increased buzz around a domestic brand, which relates to the value customers give to a brand and chose over competitive options.
Table 4. Correlations between variables
FCC UGC EWOM BE
UGC .0764* -
EWOM .374** .372* -
BE .584* .602* .441* -
PI .482** .495** .288** .627**
** Correlation is significant at the 0.01 level (2-tailed).
As mentioned above, there is a very high correlation between brand equity and purchase intention. Analyzing this further, it seems that, the higher the brand equity of a domestic brand is, the higher the purchase intention of customers will be.
4.3.
Hypotheses Testing
In order to test the main hypothesis and the supporting hypotheses, regression was used. However, before being able to proceed with the regression analysis, the assumptions of normality, multicollinearity, linearity and homoscedasticity were tested for each hypothesis to identify if these prerequisites are met within the given data set.
As mentioned in the previous section, in order to start testing the main hypothesis using regression, the main prerequisites for it had to be accessed.
The data has been found to fulfill all the assumptions, including the linearity, homoscedasticity, no multicollinearity and normality of data.
A simple linear model where Purchase Intention =3.234 + 0.723 (e-WOM), predicts that the average purchase intention of a domestic brand is increased by 0.723 in relevance to the importance a customer gives to positive and negative online reviews.
Table 5. Multiple Regression Results
Unstandardized Coefficients Standardized Coefficients
t Sig.
B Std. Error Beta
(Constant) .719 .219 3.279 .001
EWOM .667 .043 .441 8.483 .000
BE .721 .049 .621 12.344 .000
FCC-EWOM .672 .053 .374 6.960 .000
UGC-EWOM 1.350 .051 .372 6.912 .000
F-stat 71.964
Sig. 0.000
Multiple R 0.782
R2 0.429
Adjusted R2 0.522 St. err. of the estimate 0. 32848
4.4.
Mediation testing of Brand Equity on Purchase Intention
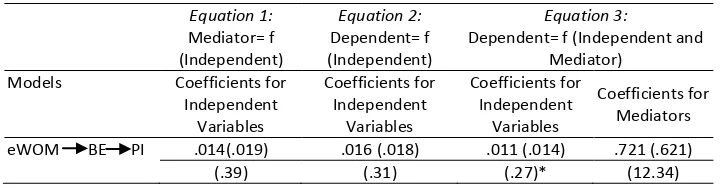
To completely understand this relationship, it is important to address the effect brand equity exercises on purchase intention in its relation to e-WOM. Therefore we tested brand equity’s mediation effect by following Baron and Kenny (1986)’s three step mediation analysis.
Mediators provide additional information about how or why two variables are associated. This analysis is carried out through four steps.
Since we already concluded that E-WOM is in significant relationship with purchase intention, the second step is to analyze the effect of e-WOM (independent variable) on brand equity, which is in the role of the mediator. Table 6 indicates that there is a significant relationship between these variables, which proves that brand equity of the particular brand customers choose to follow on social media is affected by e-WOM, thus H4 has been accepted.
Table 6. Regression Equation Tests for Hypothesis 4
Equation 1:
Mediator= f (Independent)
Equation 2:
Dependent= f (Independent)
Equation 3:
Dependent= f (Independent and Mediator)
Models Coefficients for Independent
Variables
Coefficients for Independent
Variables
Coefficients for Independent
Variables
Coefficients for Mediators eWOM BE PI .014(.019) .016 (.018) .011 (.014) .721 (.621)
(.39) (.31) (.27)* (12.34)
Notes: * Not significant at .05 level. Values in the parentheses in the first rows are standardized coefficients. Values in the parentheses in the second rows are t-values.
Analyzing the second hypothesis, a significant positive relationship has been found between the content that is created by the firm, such as blog posts, product information shares and other relevant content they post on social media and their effects on spreading electric-word-of-mouth. Therefore, H2 is accepted.
For the H3 hypotheses, a new linear regression was employed for understanding if there is a significant relationship between the user-generated content and e-WOM for consumers. Running this analysis, user-generated content (including reviews, comments and recommendations) have been found to have a significant positive relationship with the electric-word-of mouth for a particular domestic brand. This finding supports H3, which is therefore accepted.
5.
Discussion and Conclusion
The goal of the following research was to investigate how effective social media communication is in the creation of e-WOM and its influence on the brand equity and purchase intention of customers.
5.1.
Theoretical Implication
To address the research questions three supportive and one main hypothesis were created and tested. The hypotheses were inspired by various articles and theories in the sphere of marketing and in particular social media communication in which authors in one way or another bring together the influence of e-WOM and brand equity to measure their effect on customers’ purchase intention.
Based on their theories we created a conceptual model that included the steps through which the purchase intention could be influenced.
purchase intention of customers, as it acts as a mediator between e-WOM and purchase intention.
Translated into a marketing language, this means that likes, shares, comments of users, as well as the posts the brand promotes on their social media sites significantly impacts the dissemination of information about the particular brand, thereby creating e-WOM. Online recommendations and ideas of other customers highly impact purchase decisions of consumers.
However, this is accomplished through the effects of brand association, brand awareness, perceived quality and brand loyalty.
Therefore, highly focusing on how companies engage with their customers online, creates positive or negative experiences, that further influences their brand equity. Accordingly, brands with high levels of brand equity tend to be the most profitable ones on the market.
5.2.
Practical Implication
An interesting fact is that, a large percentage of the respondents recalled “Violeta” (32%) and “Klas” (18%) when answering to the following question: “What is one domestic brand you follow on Social Media?”. Needless to say, these domestic brands, among others, are top performing companies in Bosnia and Herzegovina, with huge earnings and a large pool of committed and loyal customers.
This means that, due to their good organized social media communication, which affects e-WOM, higher brand equity is accomplished, which in turn makes customers choose these brands over others in the relevant product categories.
This is a very important point in the research, because marketers have to understand the advantages that appropriate social media communication offers to their brand. Costumers are overwhelmed with continuous marketing offerings and new brands entering the market every day. This is particularly true, giving the socio-economic background in Bosnia and Herzegovina. Domestic brands, therefore, must communicate their values to customers clearly in order to get a reasonable return on their investment. Given that it has never been easier to reach your target groups at lower cost levels, domestic marketers need to engage into social media communication and adopt it in their marketing strategy.
This can be achieved through tailoring communication efforts to fit and reach the core of their target audience, to whom they can communicate their values in order to drive sales and move up the marketing funnel.
specific industry. Samples are taken via an online questionnaire, which make it difficult to generalize the result in different regions of the country.
In addition, this research might have different results for different industries and product categories. Further research could analyze specific social media accounts, as different social media platforms have their own characteristics, and by analyzing all accounts that a company has, a better understanding will be provided for researchers on the actual impact of social media communication forms towards brand equity dimensions and consumer purchase intention. Moreover, examining a broader range of industries could shed more detailed insight as to what kind of communication is needed across different markets. The result of a one industry might be different with the others.
In conclusion, the present research demonstrates that social media is gaining popularity in contemporary society. People and especially companies become more successful in their attempts to influence different users via social media and social networks in particular. The buzz around products increases the brad equity, which in turn drives the sales for a brand.
References
Aaker, D. A. (1991). Managing Brand Equity. New York, USA: The Free Press.
American Marketing Association. (1960). Brand. Marketing Definitions: A Glossary of Marketing Terms. Chicago, IL.
Arndt, J. (1967). Word of Mouth Advertising: A review of the literature. Michigan, USA: Advertising Research Foundation.
Ashill, N. J., & Sinha, A. (2004). An Exploratory Study into the Impact of Components of Brand Equity and Country of Origin Effects on Purchase Intention. Journal of Asia - Pacific Business,
5(3), 27-43. https://doi.org/10.1300/J098v05n03_03
Atilgan, E., Akinci, S., Aksoy, S., & Kaynak, E. (2009). Customer-Based Brand Equity for Global Brands: A Multinational Approach. Journal of Euromarketing, 18(2), 115–132.
https://doi.org/10.9768/0018.02.115
Bernoff, J., & Li, C. (2011). Effects of Brand Attitude and Familiarity. The Journal of Marketing, 59(1), 63–77.
Berthon, P. R., Pitt, L. F., McCarthy, I., & Kates, S. M. (2007). When Customers Get Clever: Mangerial Approaches to Dealing with Creative Customers. Business Horizons, 50(1), 39–47.
https://doi.org/10.1016/j.bushor.2006.05.005
Bone, P. F. (1995). Word of Mouth effects on short-term and long-term product judgments.
Journal of Business Research, 32(3), 213–223. https://doi.org/10.1016/0148-2963(94)00047-I
Brodie, R. J., Ilic, A., Juric, B., & Hollebeek, L. (2013). Consumer engagement in a virtual brand community: An exploratory analysis. Journal of Business Research, 66(1), 105–114.
https://doi.org/10.1016/j.jbusres.2011.07.029
Burmann, C., & Arnhold, U. (2008). User Generated Branding: State of the Art of Research, London, UK, Transaction Publishers.
Campbell, Colin, Pitt, L. F., Parent, M., & Berthon, P. R. (2011). Understanding Consumer Conversations around Ads in a Web 2.0 World. Journal of Advertising, 40, 87–102.
https://doi.org/10.2753/JOA0091-3367400106
Coursaris, C., Osch, W., & Albini, A. (2017, June). What Drives Perceptions of Review Trustworthiness in Electronic Word-of-Mouth: An Experimental Study of TripAdvisor. In Atas da Conferência da Associação Portuguesa de Sistemas de Informação (Vol. 17, No. 17, pp. 111-126).
Chang, H. H., & Liu, Y. M. (2009). The impact of brand equity on brand preference and purchase intentions in the service industries. The Service Industries Journal, 29(12), 1687– 1706. https://doi.org/10.1080/02642060902793557
Chauhan, K., & Pillai, A. (2013). Role of content strategy in social media brand communities: A case of higher education institutes in India. Journal of Product & Brand Management,
22(1), 40-51. https://doi.org/10.1108/10610421311298687
Christodoulides, G., Jevons, C., & Bonhomme, J. (2012). Memo to Marketers: Quantitative Evidence for Change. How User-Generated Content Really Affects Brands. Journal of Advertising Research, 52(1:53). https://doi.org/10.2501/JAR-52-1-053-064
Coon, M. (2010, June 4). Social Media Marketing: Successful Case Studies of Businesses Using Facebook and YouTube With an in-Depth look in the business use of Twitter communication. Stanford University. Retrieved from http://comm.stanford.edu/coterm /projects/2010/maddy%20coon.pdf
Daugherty, T., Eastin, M., & Bright, L. (2008). Exploring Consumer Motivations for Creating User-Generated Content. Journal of Interactive Advertising, 8(2), 16–25.
https://doi.org/10.1080/15252019.2008.10722139
De Chernatony, L., Drury, S., & Segal-Horn, S. (2006). Communicating services brands values internally and externally. Services Industries Journal, 28(8), 819–836.
Dellarocas, C. (2003). The digitalization of Word of Mouth: Promise and Challenges of Online Feedback Mechanisms. Management Science, 49(10), 1407–1424.
https://doi.org/10.1287/mnsc.49.10.1407.17308
Eisingerich, A. B., Chun, H. H., Liu, Y., Jia, H. M., & Bell, S. J. (2015). Why recommend a brand face-to-face but not on Facebook? How word-of-mouth on online social sites differs from traditional word-of-mouth https://doi.org/10.1016/j.jcps.2014.05.004
Ellis-Chadwick, F., & Doherty, N. F. (2012). Web advertising: The role of e-mail marketing.
Journal of Business Research, 65(6), 843–848. https://doi.org/10.1016/j.jbusres.2011.01.005
Everson, A. (2014, January 8). Five Big Social Media Trends for 2014. Retrieved February 10, 2016, from http://www.marketingprofs.com/articl es/print/2014/24085/five - big - social - media - trends - for - 2014
Gangadharbatla, H. (2008). Facebook Me: Collective Self-esteem, Need to Belong, and Internet Selfefficacy as Predictors of the iGeneration’s Attitudes Toward Social Networking Sites. Journal of Interactive Advertisingn, 806(1), 3–28.
Godes, D., & Mayzlin, D. (2004). Se servir des conversations en ligne pour étudier le bouche-à-oreille. Recherche et Applications En Marketing, 19(4), 89–111.
https://doi.org/10.1177/076737010401900402
Godin, S. (2001). Les secrets du marketing viral : le bouche- à-oreille à la puissance 10! Paris: Maxima Laurent Du Mesnil Éditeur, 197p.
Gonzalez, C. (2010). Social Media Best Practices for Communication Professionals through the Lens of the Fashion Industry. The University of Southern California.
Gordhamer, S. (2009). 4 Ways Social Media is Changing Business. Retrieved from http://Mashable.Com/2009/09/22/Social-Media-Business/
Gross, R., & Acquiti, A. (2005). Information revelation and privacy in online social networks. In ACM workshop on privacy in the electronic society. Alexandria, VA: ACM Press, New York.
https://doi.org/10.1145/1102199.1102214
Ha, H. Y. (2004). Factors influencing consumer perceptions of brand trust online. Journal of
Product & Brand Management, 13(5), 329–342.
https://doi.org/10.1108/10610420410554412
Hennig-Thurau, T., Gwinner, K. P., Walsh, G., & Gremler, D. D. (2004). Electronic Word-Of-Mouth Via Consumer-Opinion Platforms: What Motivates Consumers to Articulate Themselves on the Internet? Journal of Interactive Marketing, 18(1), 38–52.
Hu, X. (2015). Assessing Source Credibility On Social Media–––An Electronic Word-Of-Mouth Communication Perspective (Doctoral dissertation, Bowling Green State University).
Jansen, B. J., Zhang, M., Sobel, K., & Chowdury, A. (2009). Twitter power: Tweets as electronic word of Mouth. Journal of the Association Society for Information Science and Technology, 60(11), 2169–2188. http://doi.org/http://dx.doi.org/10.1002/asi.21149
Javalgi, R. R., & Moberg, C. R. (1997). Service Loyalty: Implications for Service Providers.
Journal of Services Marketing, 11(3), 165–179.
Kaplan, A. M., & Haenlein, M. (2010). Users of the World, Unite!The Challenges and Opportunities of Social Media. Business Horizons, 53(1), 59–68.
Keller, K. L. (2009). Building strong brands in a modern marketing communications environment. Journal of Marketing Communications, 15(2–3), 139–155.
Keller, K. L., & Lehmann, D. R. (2006). Brands and branding: research findings and future priorities. Marketing Science, 25(6), 740–759. https://doi.org/10.1287/mksc.1050.0153
Kim, A. J., & Ko, E. (2010). Impacts of Luxury Fashion Brand’s Social Media Marketing on Customer Relationship and Purchase Intention. Journal of Global Fashion Marketing,1(3), 164–171.
Kotler, P. (2000). Marketing Management: Analysis, Planning, Implementation and Control
(10th ed.). NJ: Prentice-Hall: Englewood Cliffs.
Lee, J., Park, D. H., & Han, I. (2008). The Effect of Negative Online Consumer Reviews on Product Attitude: an Information Processing View. Electronic Commerce Research and Applications, 7(3), 341–352.
Litvin, S. W., Goldsmith, R. E., & Pan, B. (2008). Electronic word-of-mouth in hospitality and tourism management. Tourism Management, 29, 458–468.
https://doi.org/10.1016/j.tourman.2007.05.011
Mirza, A. A., & Almana, M. A. (2013). The Impact of Electronic Word of Mouth on Consumers’ Purchasing Decisions. International Journal of Computer Applications (0975 – 8887), 82(9). https://doi.org/10.5120/14145-2286
Mohammed Abubakar, A. (2016). Does eWOM influence destination trust and travel intention: a medical tourism perspective. Economic Research-Ekonomska Istraživanja, 29(1), 598-611.
Nielsen. (2013). Nielsen Global Survey of Trust in Advertising. Nielsen. Retrieved from http://www.nielsen.com
OECD. (2007). Participative web and user-created content: Web 2.0 wikis and social networking. Retrieved from http://www.oecd.org
Oliver, R. L. (1997). A Behavioral Perspective on the Consumer. New York, USA: NY: McGraw-Hill.
O’Reilly, K., MacMillan, A., Mumuni, A. G., & Lancendorfer, K. M. (2016). Extending our understanding of eWOM impact: The role of source credibility and message
relevance. Journal of Internet Commerce, 15(2), 77-96
https://doi.org/10.1080/15332861.2016.1143215
Padhy S. K. and R.K. Sawlikar(2018), The Role of Brand Equity And Brand Awareness on Consumers’ Purchase Intention, International Journal of Business and Management Invention 7(1) PP—12-16
Page, C., & Lepkowska, W. E. (2004). Web equity: A framework for building consumer value in online companies. Journal of Consumer Marketing, 19(3), 231–248.
https://doi.org/10.1108/07363760210426058
Phelps, J. E., Lewis, R., Mobilio, L., Perry, D., & Raman, N. (2004). Viral marketing or electronic Word-of-Mouth advertising: Examining consumers responses and motivations to pass along emai. Journal of Advertising Research, 44(4), 333–348.
Punj, G., & Hillyer, C. L. (2004). A Cognitive Model of Customer-Based Brand Equity for Frequently Purchased Products: Conceptual Framework and Empirical Results. Journal of Consumer Psychology, 14(1), 124–131. https://doi.org/10.1207/s15327663jcp1401&2_14
Rangaswamy, A., Burke, R. R., & Oliva, T. A. (1993). Brand equity and the extendibility of brand names. International Journal of Research in Marketing, 10(1), 61–75.
https://doi.org/10.1016/0167-8116(93)90034-V
Richter, A., & Koch, M. (2007). Social software — status quo und Zukunft. Fakultät für Informatik, Universität der Bundeswehr München.
Rio, A., Vazquez, R., & Iglesias, V. (2001). The Role of the Brand Name in Obtaining Differential Advantages. Journal of Product & Brand Management, 10(7), 452–465.
https://doi.org/10.1108/EUM0000000006242
Rossiter, J. R., & Percy, L. (1987). Advertising and Promotion Management. New York, USA: NY: McGraw-Hill.
Severi, E., Choon Ling, K., & Nasermoadeli, A. (2014). The Impacts of Electronic Word of Mouth on Brand Equity in the Context of Social Media. International Journal of Business and Management, 9(8), 84-96. https://doi.org/10.5539/ijbm.v9n8p84
Shankar, Venkatesh, Inman, Mantrala, Kelley, & Rizley. (2011). Innovations in Shopper Marketing: Current Insights and Future Research Issues. Journal of Retailing, 1, 29–42. http://doi.org/10.1016/j.jretai.2011.04.007
Silverman, G. (2001). The Power of Word of Mouth. Direct Marketing, 64(5), 47-52.
Smith, A. N., Fischer, E., & Yongjian, C. (2012). How Does Brand-related User-generated Content Differ Across YouTube, Facebook, and Twitter? Journal of Interactive Marketing,
26(2), 102–113. https://doi.org/10.1016/j.intmar.2012.01.002
Socialbakers. (2013, September). TOP 100 Facebook Brands Social Media Stats from Bosnia and Herzegovina. Retrieved from http://www.socialbakers.com
Taylor, C. R. (2013). Editorial: Hot Topics in Advertising Research. International Journal of Advertising, 32(1:7), 7-12. https://doi.org/10.2501/IJA-32-1-007-012
Tseng, C.-H., Kuo, H.-C., & Chen, J.-M. (2013). The Relationship Among Advertisement, Electronic Word Of Mouth, And Purchase Intention Of Virtual Community Members. Northeast Region Decision Sciences Institute.
Uslu, A., Durmuş, B., & Kobak Kolivar, B. (2013). Analyzing the Brand Equity of Turkish Airlines Services: Comparing the Japanese and Turkish Perspectives. In The Proceedings of 9th International Strategic Management Conference (Vol. 99, pp. 446–454).
https://doi.org/10.1016/j.sbspro.2013.10.513
Vij, S., & Sharma, J. (2013). An Empirical Study on Social Media Behaviour of Consumers and Social Media Marketing Practices of Marketers. Presented at the 5th IIMA Conference on Marketing in Emerging Economies.
Villanueva, J., Yoo, S., & Hanssens, D. M. (2008). The Impact of Marketing-induced Versus Word-of mouth Customer Acquisition on Customer Equity Growth. Journal of Marketing Research, XLV(2), 48–59. https://doi.org/10.1509/jmkr.45.1.48
Vinerean, S., Cetina, L., Dumitrescu, L., & Tichindelean, M. (2009). The effects of social media marketing on online consumer behavior. International Journal of Business and Management,
8(14). https://doi.org/10.5539/ijbm.v8n14p66
Westbrook, R. A. (1987). Product/consumption-based affective responses and postpurchase processes. Journal of Marketing Research, 24(3), 140–143.
Wolny, J., & Mueller, C. (2013). Analysis of fashion consumers’ motives to engage in electronic word-of-mouth communication through social media platforms. Journal of Marketing Management, 29(5), 562–583. https://doi.org/10.1080/0267257X.2013.778324
Yoo, B., & Donthu, N. (2001). Developing and Validating a Multidimensional Consumer-Based Brand Equity Scale. Journal of Business Research, 52, 1–14.
Yoo, B., Donthu, N., & Lee, S. (2000). An Examination of Selected Marketing Mix Elements and Brand Equity. Journal of the Academy of Marketing Science, 28(2), 195–211.
https://doi.org/10.1016/S0148-2963(99)00098-3
Zeithaml, V. A. (1988). Consumer perceptions of price, quality, and value: a means-end model and synthesis of evidence. Journal of Marketing, 52, 2–22.