ATI'ITUDES
TO
PESTS
AND
PEST
CONTROL
M E T H O D S
RESULTS
FROM
A
SAMPLE SURVEY
OF
THE
NZ
POPULATION
IN FEBRUARY
1991
Ron
Sheppard
Lorna Urquhart
J
This study was commissioned by the Ministry of Agriculture and Fisheries
in association with the Rabbit and Land Management Programme
Research Report No. 210
April 1991
Agribusiness and Economics Research Unit
PO Box 84
Lincoln University
Canterbury
New Zealand
Telephone: (64) (3) 252-811
Fax: (64)
(3)252-099
Tho Agr~bus~ries~nnrl Economics Rosearch Unlt (AERU) operates frorn L~ricoln llri~vors~ty provldlng research expertise for a wlde range of otganlsatlons concerned with production, processing, d~strihiit~on, f~nance and rnarketlng
The AERU operates as a semi-commercial research agency. Research contracts are carried out for clients on a commercial basis and University research is supported by the AERU through sponsorship of postgraduate research programmes. Research clients include Government Departments, both within New Zealand and from other countries, international agencies, New Zealand companies and organisations, individuals and farmers. Research results are presented through private client reports, where this is required, and through the publication system operated by the AERU. Two publication series are supported: Research Reports and Discussion Papers.
The AERU operates as a research co-ordinating body for the Economics and Marketing Department and the Department of Farm Management and Accounting and Valuation. This means that a total staff of approximately 50 professional people is po- tentially available to work on research projects. A wide diversity of expertise is therefore available for the AERU.
The major research areas supported by the AERU include trade policy, marketing (both institutional and consumer), accounting, finance, management, agricultural economics and rural sociol- ogy. In addition to the research activities, the AERU supports conferences and seminars on topical issues and AERU staff are involved in a' wide range of professional and University related extension activities.
Founded as the Agricultural Economics Research Unit in 1962 from an annual arant orovided bv the Deoartment of Scientific and Industrial ~ e s e a r c h ('DSIR), the AERU has grown to become an independent, major source of business and economic research expertise. DSlR funding was discontinued in 1986 and from April 1987, in recognition of the development of a wider research activity in the agribusiness sector, the name of the organisation was changed to the Agribusiness and Economics Research Unit. An AERU Management Committeecomprised of the Principal, the Professors of the three associate departments, and the AERU Director and Assistant Director administers the general Unit policy.
AERU MANAGEMENT COMMITTEE 1991
Professor A C Bywater, B.Sc., Ph.D.
(Professor of Farm Management)
Professor R H Juchau, B.Com., B.Ed., M.A.
(Professor of Accounting and Finance)
AERU STAFF 1991
Professor A C Zwart, B.Agr.Sc., M.Sc., Ph.D.
(Professor of Marketing)
R L Sheppard, B.Agr.Sc. (Hons), B.B.S.
(Assistant Director, AERU)
Director
Professor AC Zwart, B.Agr.Sc., M.Sc., Ph.D.
Assistant Director
R L Sheppard, B.Agr.Sc. (Hons). B.B.S.
Research Officen
G Greer, B.Agr.Sc. (Hons) T P Grundy. B.Sc. (Hons), M.Com.
Research Officers
L. M. Urquhart. B.Com.(Ag), Dip.Com. J R Fairweather. B.Agr.Sc., B.A.. M.A., Ph.D.
Visiting Research Fellow
N C Keating, Ph.D.
Secretary
List
of Tables
Page
(i)
Preface
Acknowledgements
summary
Chapter
1
Introduction
1.1
Survey Method
1.2
Questionnaire Administration
(xi)
1.3
Potential Information Bias
21.4
Questionnaire Coding and Analysis
2
1.5
Sample Error and Bias
22
Results
5
2.1
Seriousness of Various Pests
5
2.1.1
Overall Seriousness
5
2.1.2
Analysis of Pest Seriousness by Age of Respondent
6
2.1.3
Analysis of Pest Seriousness by Description of Where Live10
2.1.4
knalysis of Pest Seriousness by Sex of Respondent
1 02.2
Attitude to Introduced Natural Enemies and Diseases
11
2.3
Wasp Problems
14
2.3.1
Current Problems and Control
14
2.3.2
Attitudes to Wasp Control Methods
17
2.3.3
Attitudes to Virus Control Method for Wasps
242.4
Possum Problems
28
2.4.1
Current Problems and Control
282.4.2
Attitudes to Possum Control Methods
32
2.4.3
Attitudes to Disease Control Method for Possums
37
2.5
Rabbit Problems
2.5.1
Current Problems and Control
2.5.2
Attitudes to Rabbit Control Methods
2.5.3
Attitudes to Myxomatosis for Rabbits
2.6
Survey Statistics
3.
Conclusions
LIST OF TABLES
Table
Page
Attitudes on Seriousness of Pests
5
Other Serious Pests
6
Age By Seriousness of Rats
7
Age By Seriousness of Termites
7Age By Seriousness of Fruit Fly
8
Age By Seriousness of Wasps
8
Age By Seriousness of Grass Grubs
9
Age By Seriousness of Possums
9
Age By Seriousness of Rabbits
9
Where You Live By Attitude to the Seriousness of Grass Grubs
10
Respondent Sex By Attitude to the Seriousness of Flies
10
Respondent Sex By Attitude to the Seriousness of Possums
11
Is the Introduction of Diseases and Natural Enemies
a Good Pest Control Method
11
Respondent Sex By Attitude to Introduction of Diseases and Enemies
12
Age By Introduction of Enemies and Diseases
12
Where You Live By Attitude to Introduction of Disease and Enemies
12
Occupation By Attitude to Introduction of Enemies and Diseases
13
Reasons Why it is Not a Good Pest Control Measure
14Is There a Wasp Problem Where You Live
14
Where You Live By Do You Have a Wasp Problem
15
Has the NZ Wasp Problem Changed Lately
15
Where You Live By Has the NZ Wasp Problem Changed
15
Is Enough Bqing Done to Control Wasps
16
Age By
is
Enough Done to Control Wasps
16
Where You Live By
is
Enough Done to Control Wasps
in
NZ
16
Attitudes to Wasp Control Methods
17
Respondent Sex By Attitude to Insecticide Use on Wasps
17
Respondent Sex By Attitude to Sodium Cyanide on Wasps
18
Respondent Sex By Attitude to Use of Predators for Wasps
18
Respondent Sex By Attitude to Wasp Diseases,
eg. Viruses as Form of Control
19
Age By Attitude to Use of Insecticide for Wasps
19
Age By Attitude to Use of Sodium Cyanide for Wasps
20
Age By Attitude to Use of Diseases, eg. Viruses for Wasps
20
Age By Attitude to Use of Predators for Wasps
21
Occupation By Attitude to Use of Wasp Diseases,
eg. Viruses to Control Wasps
22
Education After High School By Attitude to Wasp Diseases, eg, Viruses
23
Attitgde to Introduction of Disease and Enemies
By Attitude to Use of Wasp Disease, eg. Virus
23
Age By Have Heard of Wasp Virus
24
Respondent Sex By Attitude to Introduction of Wasp Virus
Age By Attitude to Introduction of Wasp Virus
Occupation By Attitude to Introduction of Wasp Virus
Comments Referring to Introduction of Wasp Virus
Is There a Possum Problem Where You Live
Where You Live By Do You Have a Possum Problem Where You Live
Has the NZ Possum Problem Changed Lately
Age By Has NZ Possum Problem Changed
Where You Live By Has NZ Possum Problem Changed
Is Enough Being Done to Control Possums
Age By Is Enough Being Done About Possum Problem
Where You Live By Is Enough Being Done About the Possum Problem
Respondent Sex By Is Enough Done to Control Possums
Attitudes To Possum Control Measures
Respondent Sex By Attitude to Shooting Possums as Control Measure
Respondent Sex By Attitude to
1080
For Possum Control
Respondent Sex By Attitude to Cyanide Use for Possum Control
Respondent Sex By Attitude to Possum Viruses as Form of Control
Age By Attitude to the Use of Cyanide for Possums
Age By Attitude to Use of Diseases, eg. Viruses for Possums
Age By Attitude to Use of Predators for Possums
Where ,You Live By Attitude to Trapping Possums
Attitude to Introduction of Disease and Enemies
By Use of Possum Viruses As Form of Control
Attitude to Introduction of Possum Disease
Respondent Sex By Attitude to Introduction of Possum Disease
Age By Attitude to Introduction of Possum Disease
Attitude to Introduction of Disease and Enemies
By Attitude to Introduction of Possum Disease
Comments Referring to Introduction of Possum Disease
Is There a Rabbit Problem Where You Live
Where You Live By Do You Have a Rabbit Problem
Age By Do You Have Rabbit Problem
Has The NZ Rabbit Problem Changed Over the Last Five Years
Age By Has NZ Rabbit Problem Changed
Where You Live By Has NZ Rabbit Problem Changed
Is Enough Being Done to Control Rabbits In NZ
Age By Is Enough Being Done to Control Rabbits
Respondent Sex By Is Enough Done to Control Rabbits
Where You Live By Is Enough Being Done to Control Rabbits
Attitudes Towards Rabbit Control Measures
Respondent Sex By Attitude to Shooting Rabbits as Control Measure
Respondent Sex By Attitude to
1080
for Rabbit Control
Respondent Sex By Attitude to Gassing Rabbits for Control
Respondent Sex By Attitude to Use of Predators for Rabbits
Where You Live
By
Attitude to Gassing Rabbits
47Where You Live
By
Attitude to the Use of Rabbit Diseases
as Form of Control
48Attitude to Introduction of Enemies and Diseases
By
Attitude to Use of Rabbit Disease as Form of Control
48Are There
Any
Other Suitable Control Methods
49Other Control Methods Considered Suitable
49Respondent Sex
By
Other Rabbit Control Methods Considered Suitable
50What Else Can Be Done About Rabbits
51Respondent Sex
By
Are There
Any
Other Suitable Rabbit Controls
51Have You Heard of Myxomatosis Before
52Age
By
Have You Heard of Myxomatosis
52Where You Live
By
Have You Heard of Myxomatosis
52Occupation
By
Have You Heard of Myxomatosis
53Education After High School
By
Have You Heard of Myxomatosis
53How Does Myxomatosis Affect Rabbits
54Respondent Sex
By
How Myxomatosis Affects Rabbits
55Attitude Towards Introduction of Myxomatosis
56Respondent Sex
By
Attitude o Introduction of Myxomatosis
56Where You Live
By
Attitude to Introduction of Myxomatosis
56Attitude to Introduction of Enemies and Diseases
By
Attitude to Introduction of Myxomatosis
57Comments About Introduction of Myxomatosis
57Any
Other Myxomatosis Comments
58Attitude Toward of
Any
Other Rabbit Diseases
59Respondent Sex
By
Attitude to Introduction of Other Rabbit Diseases
59Age
By
Attitude to Introduction of Other Rabbit Diseases
59Where You Live
By
Attitude to Introduction of Other Rabbit Diseases
60Attitude to I~troduction
of Diseases and Enemies
By
Attitude to Introduction of Other Rabbit Diseases
60Comments Referring to Introduction of
Any
Other Rabbit Diseases
61Respondents Ages
61Was
Any
Form of Education Completed After High School
62Usual Occupation of Respondent
62Where Do You Live?
63Region Respondent Lives In
63The Agribusiness and Economics Research Unit has a programme of research which covers a wide range of topics. Included is a market research programme and a policy research activity. In the case of this research, the market research techniques which have been developed have been applied to a policy matter and information has been presented which can contribute to policy decisions.
In many cases, policy decisions are made on the basis of political activity carried out by pressure groups which apply effective lobbying pressure on politicians and policy advisors. This activity can lead to an incorrect view of public opinion being formed and policy actions being taken which are not supported by a large sector of public opinion but which reflect the opinions of particular pressure groups.
The conduct of an effective research procedure with respect to the issue in question can lead to a much better understanding of public opinion on matters of importance. Such information can then contribute to the deliberations of the decision makers and result in better decisions being made, especially where such decisions involve implications for large sectors of the population.
In the case of this research on attitudes to pests and pest control methods, valuable information on public perceptions has been gathered. This information can be used to improve the decision making on such matters as the introduction of myxomatosis for rabbit control. Such a decision has implications for a wider community than that directly affected by a rabbit problem and the views of that wider community should be recognised.
In addition to tHe current debate over the introduction of myxomatosis, this research has revealed valuable information on the general attitude of the public to the introduction of biological control mechanisms, particularly imported natural enemies and diseases of pests in New Zealand. The implications of the findings are of importance in the assessment of biological control programmes covering a wide range of issues. It should be noted that public opinion is not necessarily in support of such programmes and that scientists should be aware of the views of their work which are held by a large proportion of the population.
The Agribusiness and Economics Research Unit is pleased to be involved in this research area and is grateful to the sponsors of the research for their permission to publish this Report.
Professor A C Zwart DIRECTOR
ACKNOWLEDGEMENTS
The authors wish to acknowledge the assistance received from Dr J Morgan Williams and Dr Nick Taylor who both provided valuable input to the design of the Questionnaire which was used.
The Ministry of Agriculture and Fisheries and the Rabbit and Land Management Programme provided financial support for the study and the help of those organisations is gratefully acknowledged.
Studies of this sort are not possible without the assistance of the many New Zealand people who freely give their time to answer the questions posed by the interviewers. This assistance is respected and appreciated. While there are an increasing number of surveys being carried out for a wide range of purposes, the continued co-operation of respondents is essential for these surveys to have any meaning. We trust that the results of this survey can be used to guide the decision makers towards the best possible decisions on behalf of New Zealand and so make the time invested in answering the survey a worthwhile investment.
The sample extraction and telephone interviewing was carried out quickly and efficiently by Strategic Research Services and we are most grateful to that organisation for its competent assistance.
. Data entry was undertaken by Sue Clemes at Lincoln University who performed the task very quickly h n d efficiently. We are grateful to her for her help.
While the information presented herein is an accurate reflection of the data collected and the draft report has been considered by referees, the conclusions drawn are the responsibility of the authors and any comments or argument should be directed to us.
Ron Sheppard
SUMMARY
A survey of 1000 adult people in New Zealand was carried out during February 1991. The intention of the survey was to ascertain the views of the respondents on the seriousness of a range of pests and their attitudes to various forms of pest control. In particular, information was sought on attitudes to wasps, possums and rabbits and the possible methods of controlling those pests.
The results of the survey indicate that a high proportion of respondents considered rabbits, possums and wasps to be very serious or serious pests while approximately half the respondents also consider fruit fly, grass gmbs, flies, termites and rats to be serious or very serious.
For many pests, there is a relationship between the age of the respondent and the attitude towards the seriousness of the pest. In general, older respondents considered the pests to be more serious than did younger respondents. A higher proportion of females considered flies to be serious or very serious pests and a higher proportion of males considered possums to be very serious.
Approximately half the respondents did
not
think that the introduction of natural enemies or diseases was a good way of controlling pests in New Zealand. This response was also related to the age and sex of the respondents with more older respondents and more females being opposed to this form of pest control. The main reason for opposition to this form of control was the danger of the "import becoming a problem".Nearly a third of respondents indicated that they had a wasp problem where they lived with rural, town and city areas being equally represented. Nearly half the respondents thought that not enough was being done to control wasps with a higher proportion of older respondents holding this view.
The most suitable methods for controlling wasps (thought "very suitable" or "suitable" by the highest proportion of respondents) were diseases and petrol (equally suitable) with nearly 60 per cent of respondents preferring these methods. Insecticide was thought very suitable or suitable by 45 per cent of respondents. A higher proportion of males were in favour of diseases and insecticide than were females. A higher proportion of younger people were in favour of diseases than were older respondents. Over 40 per cent of those generally opposed to the use of diseases were in favour of the use of diseases on wasps.
Over 20 per cent of all respondents indicated that they thought there was a possum problem where they lived with nearly 50 per cent of rural residents indicating there was a possum problem. Over three quarters of the respondents thought that the possum problem had become worse over the last five years with a higher proportion of older people and rural dwellers thinking this. Nearly 65 per cent of respondents thought that not enough was being done to control possums with a higher proportion of older people and males thinking this.
The control method thought to be very suitable or suitable by the greatest proportion of respondents was shooting (69.2 per cent) with trapping being thought very suitable or suitable by 57.2 per cent. Diseases (49.0 per cent), 1080 (44.4 per cent) and cyanide (43.7 per cent) were the next highest rated. A higher proportion of males supported 1080, cyanide and diseases while a higher proportion of older respondents supported cyanide while a higher proportion of younger respondents supported diseases. Over 30 per cent of those who are generally opposed to diseases supported the use of diseases for possum control and 54 per cent of all respondents thought the introduction of a possum disease was a "good idea" or "OK". A higher proportion of males and younger respondents supported this.
Only 12 per cent of respondents indicated there was a rabbit problem where they live. In rural areas, the proportion rose to 27.7 per cent of respondents, 15.7 per cent'in towns and only 4.6 per cent in cities. A higher proportion of younger people thought there was a problem and nearly 90 per cent of respondents thought the NZ rabbit problem had become worse during the last five years. Only 11.2
The control method thought very suitable or suitable by the highest proportion of respondents was "Commercial Harvesting" with 74.1 per cent indicating this. Shooting was thought very suitable or suitable by 68.3 per cent, diseases 46.2 per cent, 1080 45.3 per cent, gas 30.9 per cent and predators 20.1 per cent. A higher proportion of females favoured shooting while a higher proportion of males favoured 1080, gassing, predators and diseases. Gas was favoured by a higher proportion of older respondents. A higher proportion of rural respondents was in favour of gassing and the use of diseases.
Of those generally opposed to the use of diseases, nearly 30 per cent were in favour of the use of disease on rabbits.
Nearly 90 per cent of respondents had heard of myxomatosis with a higher proportion of older respondents having heard of it. Most respondents who were aware of the disease considered that myxomatosis caused a slow painful death to rabbits.
Nearly 50 per cent of respondents thought that the introduction of myxomatosis was a "good idea" or "OK. A higher proportion of males (60.8 per cent) were in favour than were females. There was no difference in attitude between rural, town and city dwellers. Over 30 per cent of those generally opposed to the use of diseases were in favour of the introduction of myxomatosis while 25.5 per cent of those generally in favour of diseases were against the introduction of myxomatosis.
Th2introduction of other rabbit diseases was supported by less respondents (27.5 per cent) with 49.1 per cent opposed. The remaining respondents (23.3 per cent) "don't know".
It was concluded that there is a significant perception of the seriousness of a range of pests in New Zealand and that this perception is likely to be greater the older the person concerned.
The use of the biological control method of introducing natural enemies and diseases to New Zealand was not favoured by a majority of the respondents/population. This resistance was based on- the danger of the introduced species becoming a problem in itself. However, where a specific target was identified and where this target was a pest relating directly to people, the resistance to this form of control was much less. In addition, where the type of agent was identified, eg. myxomatosis, there was more support for this type of control measure than where the proposed agent was less well known. The implications of this include the need for scientists to be very aware of the need to carry out extensive research on the possible "side effects" of introduced agents and to be aware that this issue is of real concern to NZ people.
However, in spite of there being a significant resistance to the use of introduced natural enemies and diseases, the resistance to other control measures was also significant. The concern over biological control methods must be seen in the context of the attitude to other forms of pest control which are currently being used. From this perspective, it can be seen that resistance to the use of diseases is no more than the resistance to the use of other control measures. Decisions "not to use biological control" must be seen in the context of the use of the other forms of control and the public resistance to those methods.
The general conclusion is that the public is concerned about pests and about the methods used to control them. The use of diseases is seen as an equivalent form of control to other measure which are available and diseases are supported as a control measure by approximately half the NZ public.
The Agribusiness and Economics Research Unit (AERU), Lincoln University, was approached in mid December 1990 by the Ministry of Agriculture and Fisheries with a request to consider the development and execution of a research project on the identification of public attitudes to the use of biological control methods for pest control in New Zealand. Particular reference was to be given to the control of wasps, possums and rabbits. Following discussions, it was established that the most appropriate method was a telephone survey of 1000 adult (18 years and over) people throughout New Zealand.
1.1 Survev Method
The telephone survey method was selected for two reasons. One was the need to be able to obtain information about issues which are thought to elicit emotional responses from participants, without triggering those emotions. This particularly applied to the gathering of information about the seriousness of pests and the key issue of the potential use of biological control methods (eg. natural enemies and diseases), without the respondent being aware that later questions would concern myxomatosis, a biological control method for rabbits which is often linked with cruelty to animals. Use of a mail questionnaire would have meant that respondents were able to be aware of these $ questions prior to completing the more general questions on biological control. In addition, a mail questionnaire would have required a much longer time period than was available and would have suffered from the usual difficulties of achievement of an adequate unbiased response rate.
Therefore, the telephone survey method was selected as the most appropriate. In order to carry out this survey, a random sample of 2000 telephone numbers was selected from the New Zealand wide telephone directories. This sample was proportionately distributed over the telephone books in order to achieve a representative geographic spread of participants.
1.2 Ouestionnaire Administration
The administration of the questionnaire was subcontracted to Strategic Research Services. This organisation employed twenty three trained telephone interviewers to carry out the survey. Each interviewer was given double the number of telephone numbers they would require, assuming an interview was obtained from each number. The interviewers were instructed to call every second number on the list provided. If insufficient interviews were obtained from this list, the remaining numbers were to be used. Interviewers were not expected to "call back to numbers where an interview was not immediately obtainable, but where requested by the potential respondent, call backs were undertaken.
As the time over which the survey was to be undertaken was short, the sample was selected, once telephone contact had been made, by the interviewer requesting an interview from the "person in your household who normally lives there, is at home now, who last had a birthday and who is 18 years or older". It was acknowledged that the proviso "who is at home now" had the potential to distort the responses in favour of those people more often at home during the hours when the interviewers were calling. However, it was considered that the factor "at home or not" would not be likely to have a significant influence on the attitude to pest control methods. However, given the likelihood of more females being at home (as compared to males) it was thought possible that this sample selection method would lead to a higher proportion of females being interviewed than men. Were this to be
the case, it was acknowledged that appropriate sample weighting techniques could be used in order to remove any potential bias caused by such a sample result.
instructed to return the first 20 completed questionnaires as soon as they were done in order to assist with the process of questionnaire coding and data entry. The interviewer notes which were used at the Briefing and the Questionnaire are included in the Appendix to this Report.
Potential Information Bias
It should be noted that during this time, there was a significant level of television and radio debate over the issue of myxomatosis. Much of this debate concerned the effect of myxomatosis on rabbits and some of the comments concerned the desirability of importing further species to New Zealand under the label of biological control. This publicity commenced during the first week of interviewing. As a result, an analysis of the early interview responses was carried out and compared with the responses obtained during and following the publicity. It was determined that there was no significant difference between the responses received.
1.4 Questionnaire Coding and Analvsis
The questionnaire responses were coded by one person
(L
Urquhart) and the data entry was carried out by Lincoln University staff.Analysis of the data was carried out using the Statistical Package for the Social Sciences (SPSS) package running on an IBM type AT personal computer.
1.5 Sample Error and Bias
Given the random selection of the sample of 1000 respondents from the total potential New Zealand population, as represented by those names available in the telephone directories, the estimated margin of error for the survey is plus or minus three per cent. This means that the actual population situation may differ from the sample responses by a range of six percentage points around the sample estimate with a maximum variation of plus three and minus three percentage points.
Bias may arise in a sample s-urvey through a number of ways. The most important of these is the sample selection procedure. As this sample was selected on a random basis from the population represented by the listings in the telephone directories, there is potential for bias in that the people listed in the directories may have different views from those not listed in the directories. This margin of error is expected to be very s m l l as a very high proportion of the population is included in the telephone directory listings. Any potential bias from this source is included within the margin of error referred to above.
A second source of potential bias which applies to this particular survey might occur from the actual sample selection which required the eligible person who was at home at the time of the telephone call. As referred to above, the factor of "at home" was not considered in itself to have potential for the reflection of bias. However, it was considered that bias might result from the selection of a higher proportion of female respondents (than occur in the population) through the use of this method. This hypothesis was based on the expectation that females were more likely to be opposed to methods of pest control which have been demonstrated through the media to involve some form of suffering for the pest. It was therefore thought that female respondents would be more likely to be opposed to the introduction of myxomatosis than male respondents. It was determined that should such a result occur, then the sample could be adjusted to refleet an equal weighting of males and females, should such an adjustment result in a sigdicant change to the results.
would need to be weighted in order to bring the male and female proportions to equality (the proportion of males and females in the population is 50:50). However, such a weighting, given the proportion of males and females in the sample, would result in an alteration of the sample total response by only one percentage point for every fourteen percentage points of difference in the male and female responses. In all cases, the male and female responses do not differ by more than 14
percentage points. Therefore, as the adjustment is well within the margin of error, and in all cases is less than one percentage point, we have not presented adjusted responses. For many of the key variables, results have been presented for males and females. Where the adjusted response for the population is required, this can be calculated by taking the mean of the male and female responses.
CHAPTER2
RESULTS
2.1 Seriousness of Various Pests
2.1.1 Overall Seriousness
Question 1 of the survey asked respondents to indicate how serious they thought some New Zealand pests are. They were asked to address this issue from the point of view of "New Zealand as a whole". The responses are given in Table 1. These results indicate that rabbits, possums and wasps are seen as the most significant pests with 77.2 per cent, 56.4 per cent and 42.2 per cent of respondents (respectively) considering that these pests are "very serious".
Attitudes on Seriousness of Pests
(% of AU Respondents)
Rats Termites Fruit Wasps Flies Grass Possum Rabbit
RY Grubs
very 8.7 14.1 17.0 42.2 14.0 8.7 56.4 77.2
Serious
Serious 33.2 31.0 40.4 38.0 36.7 34.9 33.5 16.1
Not Very 50.0 44.2 30.2 18.6 42.9 39.1 8.3 5.6
Serious
Not at ail 6.7 8.2 7.2 0.8 6.4 9.6 0.8 0.8
Serious
Don't 1.4 2 5 5.2 0.4
-
7.8 1 .O 0.3Know
Total 100.0 100.0 100.0 100.0 100.0 100.0 100.0 100.0
Valid 1005 1005 1005 1005 1005 1005 1005 1005
Response
Other Serious Pests
(% of Those Who Named Other Serious Pests)
Ants
Cockroaches
Dogs
Wild Goats
People
Fleas
Spiders
Mosquitoes
Barer
Deer
Ferrets/ Weasels
Other *
Total
Valid Responses
*
Mainly mice, also includes aphids, cats, pigs, wallabies, birds2J.2 Analysis of Pest Seriousness by Age of Respondent
TABLE 3
Age Bv Seriousness of Rats
(% of All Respondents)
20 and 21-30 31-40 41-50 51-60 Over 60
under
Very Serious
Serious
Not Very Serious
Not At All Serious 3.7 4.0 8.3 9.3 6.4 5.2
Don't Know
-
1.3 0.9 1 .O 1.4 2.6Total 100.0 100.0 100.0 100.0 100.0 100.0
Valid Responses 54 149 228 204 141 229
*
significantTABLE 4
Age Bv Seriousness of Termites
(% of All Respondents)
20 and 21-30 31-40 41-50 51-60 Over 60
under - -- -- - -
Very Serious
Serious 33.3 30.9 25.9 26.5 32.6 38.9
Not Very Serious 57.4 45.6 46.5 48.5 38.3 37.6
Not At All Serious
Don't Know
Total
Valid Responses
TABLE 5
Age Bv Seriousness of Fruit Flv
(% of All Respondents)
20 and 21-30 31-40 41-50 51-60 Over 60
under
Very Serious
Sgaious
Not Very Serious
Not At All Serious Don't Know
Total
Valid Responses
TABLE 6
Age Bv Seriousness of Wasps
(% of All Respondents)
20 and 21-30 31-40 41-50 51-60 Over 60
under
Very Serious 16.7 36.9 36.0 53.4 41.8 48.0
Serious 44.4 34.2 41.2 30.4 44.0 38.9
Not Very Serious 38.9 27.5 21.9 14.7 12.1 12.2
Not At All Serious
-
1.3 0.9 1 .O 1.4-
Don't Know
-
-
-
0.5 0.7 0.9Total 100.0 100.0 100.0 100.0 100.0 100.0
Valid Responses 54 149 228 204 141 229
TABLE 7
Age By Seriousness of Grass Grubs
(% of All Respondents)
20 and 21-30 31-40 41-50 51-60 Over 60
under
*
Very Serious 3.7 4.7 8.8 11.8 7.1 10.5
Serious
"
Not Very Serious
Not At All Serious 22.2 12.8 8.8 8.8 6.4 7.9
Don't Know 3.7 9.4 9.2 5.4 8.5 7.9
Total 100.0 100.0 100.0 100.0 100.0 100.0
Valid Responses 54 149 228 204 141 229
*
significantTABLE 8
Age Bv Seriousness of Possums (% of All Respondents)
20 and 21-30 31-40 41-50 51-60 Over 60
under
Very Serious 50.0 45.0 53.1 56.9 62.4 64.6
Serious 29.6 38.9 36.0 34.8 29.1 30.1
Not Very Serious 18.5 15.4 9.6 5.9 5.7 3.5
Not At All Serious 1.9
-
0.4 1.5 0.7 0.9Don't Know
-
0.7 0.9 1 .O 2.1 0.9Total 100.0 100.0 100.0 100.0 100.0 100.0
Valid Responses 54 149 228 204 141 229
*
significantTABLE 9
Aae Bv Seriousness of Rabbits
(% of All Respondents)
20 and 21-30 31-40 41-50 51-60 Over 60
under
Very Serious
Serious
Not Very Serious
Not At All Serious 1.9 1.3 0.9 0.5 0.7 0.4
Don't Know
-
1.3-
-
-
0.4Total 100.0 100.0 100.0 100.0 100.0 100.0
Valid Responses 54 149 228 204 141 229
2.1.3 Analysis of Pest Seriousness by Description of Where Live
Respondents identified a description of where they live according to whether it is a rural, town or city location. It was considered that a relationship might exist between the general location of a
respondent's residence and the seriousness of pest problems. However, with the exception of one pest, grass grubs, there were no significant relationships between living location and the pest seriousness. Table 10 provides the analysis with respect to grass grubs. This indicates that people who live in Rural areas consider grass grub to be more serious than do Town or City dwellers..
TABLE 10
Where You Live Bv Attitude to The Seriousness of Grass Grubs (% of All Respondents)
Rural Town
City
Very Serious 10.2 9.6 7.7
serious
Not Very Serious
Not At All Serious 3.1 7.1 12.8
Don't Know 5.4 8.3 8.3
Total 100.0 100.0 100.0
Valid Responses 166 312 521
* significant
2.1.4 Analysis of Pest Seriousness by Sex of Respondent
For most of the pests considered, there was no significant difference with respect to the sex of the respondent and the seriousness of the pest. However, there was a difference with respect to flies (Table 11) and possums (Table 12) where there was a higher proportion of female respondents considering flies to be "very serious" or "serious" and a higher proportion of males considering possums to be "very serious".
TABLE 11
Respondent Sex Bv Attitude to The Seriousness of Flies
(% of All Respondents)
- --
Male Female
. Very Serious
Serious 31.6 40.7
Not Very Serious 48.4 38.6
Not At All Serious 7.9 5.2
Don't Know
-
Total 100.0 100.0
Valid Responses 430 573
TABLE 12
Resmndent Sex Bv Attitude to The Seriousness of Possums
(% of All Respondents)
Male Female
Very Serious
Serious
Not Very Serious 7.9 8.6
Not At All Serious 1.2 0.5
Don't Know 0.9 1 .O
Total 100.0 100.0
Valid Responses 430 573
*
significant2.2 Attitude to Introduced Natural Enemies and Diseases
Question 2 asked respondents if they thought that a good way of controlling pests in New Zealand was to introduce natural enemies or diseases to New Zealand. This question was designed to identify the attitude of the New Zealand public to these forms of pest control, i.e. the use of biological control methods for pest control. Table 13 provides the results for all respondents. Half of the respondents (50.8 per cent) indicated that they did not think this was a good method.
TABLE 13
Is The Introduction of Diseases & Natural Enemies
a
Good Pest Control Method(% of All Respondents)
Yes
No
Don't Know
Total
Valid Responses
Further analysis of the respondents with respect to their age, sex, where they live and occupation cross tabulated with their attitude to this pest control method was carried out. The analyses are presented
TABLE 14
Respondent Sex Bv Attitude to Introduction of Diseases & Enemies (% of All Respondents)
Male Female
Yes
No
Don't Know
Total
Valid Responses
*
significantTABLE 15
Age BY Attitude to Introduction of Enemies and Diseases
(% of All Respondents)
- -
20 and 21-30 3 1-40 41-50 51-60 Over 60 under
Yes 45.3 48.6 47.4 39.4 32.6 33.2
No 49.1 44.6 44.3 52.2 56.0 57.2
Don't Know 5.7 6.8 8.3 8.4 11.3 9.6
Total 100.0 100.0 100.0 100.0 100.0 100.0
Valid Responses 53 148 228 203 141 229
--
*
significantWhere You Live
Bv
Attitude to Introduction of Disease and Enemies(% of All Respondents)
Rural Town city
Yes
No
Don't
Know
Total
TABLE 17
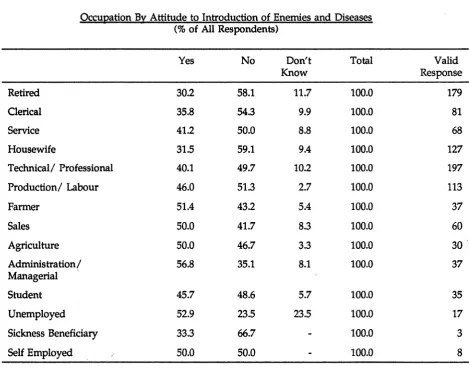
Occupation By Attitude to Introduction of Enemies and Diseases
(% of All Respondents)
Yes No Don't Total Valid
Know Response
Retired 30.2 58.1 11.7 100.0 179
Clerical 35.8 54.3 9.9 100.0 81
Service 41.2 50.0 8.8 100.0 68
Housewife 31.5 59.1 9.4 100.0 127
Technical/ Professional 40.1 49.7 10.2 100.0 197
Production/ Labour 46.0 51.3 2.7 100.0 113
Farmer 51.4 43.2 5.4 100.0 37
Sales
Agriculture
Administration / Managerial
Student
Unemployed
Sickness Beneficiary
Self Employed
*
significantTABLE 18
Reasons Whv It Is Not A Good Pest Control Measure (% of Those Who Felt It Was Not A Good Measure)
Import Becomes Problem 66.1
Need
To Do Research 11.2Dangerous To Environment 7.4
Don't Know Consequences 13.9
Introduced Enough Now
Cruel Method
Bangerous/Alters
Other
Total 119.1
Valid Responses 496
2.3 Wasp Problems
2.3,l Current Problems and Control
The second part of the Questionnaire dealt with the problems being caused by wasps. Respondents were asked a set of questions on the wasp problem (which were repeated for possums and rabbits in later sections).
Table 19 indicates that 32.5 per cent of the respondents have a wasp problem where they live. Table 20 indicates that there is no significant difference between rural, town and city dwellers with respect to the recognition of a wasp problem. There was also no significant relationship between the respondent age and the recognition of a wasp problem where they live.
TABLE 19
Is There a Wasp Problem Where You Live
(% of All Respondents)
-
Yes
No
Don't Know
Total
TABLE 20
Where You Live Bv Do You Have a Wasv Problem (% of
All
Respondents)Rural T o m City
Yes
No
Don't Know
Total
Valid Responses
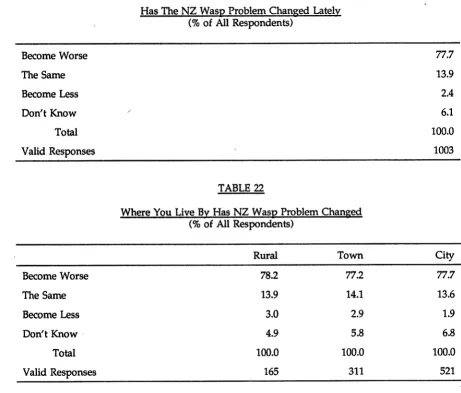
Table 21 indicates that 77.7 per cent of respondents consider that the NZ wasp problem has become worse over the last five years. Again, there is no significant difference between rural, town and city dwellers with respect to this attitude (Table 22); nor was there any relationship with respondent age.
TABLE 21
m e
NZ
Wasp Problem Changed Latelv(% of All Respondents)
Become Worse
The Same
Become Less
Don't Know
Total
Valid Reswnses
TABLE 22
Where You Wvt:
Bv
Has NZ Wasv Problem Changed(% of All Respondents)
Rural Town City
Become Worse
The Same
Become Less
Don't Know
Total
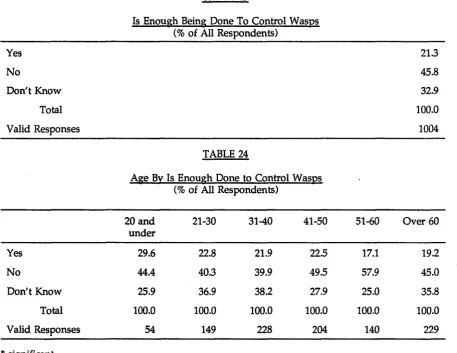
Table 23 indicates that 45.8 per cent of the respondents think that not enough is being done to control wasps in New Zealand while only 21.3 per cent think enough is being done. A large proportion (32.9 per cent) "don't know" if enough is being done. There was a significant relationship between the age of the respondent and the attitude to whether enough is being done to control wasps (Table 24) with a higher proportion of older people thinking that not enough is being done.
TABLE 23
Is Enough Being Done To Control Wasps
(% of All Respondents) Yes
No
Don't Know
Total
Valid Responses
TABLE 24
Age BY Is Enough Done to Control Wasps (% of All Respondents)
20 and 21-30 3140 41-50 51-60 Over 60 under
Yes 29.6 22.8 21.9 22.5 17.1 19.2 No 44.4 40.3 39.9 49.5 57.9 45.0
Don't Know 25.9 36.9 38.2 27.9 25.0 35.8
Total 100.0 100.0 100.0 100.0 100.0 100.0
Valid Responses 54 149 228 204 140 229
*
significantThere was no significant relationship between the dwelling location and the attitude to whether enough is being done to control wasps (Table 25); nor was there any relationship with respondent sex.
TABLE 25
Where You Live By Is Enough Done to Control Wasps in NZ
(% of All Respondents)
Rwd %wn City
Yes
No
Don't Know
Total
2.3.2 Attitudes to Wasp Control Methods
Respondents were asked to indicate whether they thought a range of nominated wasp control methods were "very suitable", "suitable", "unsuitable" or "very unsuitable". Table 26 lists the methods that were nominated in the questionnaire and the attitudes of the respondents to those methods. "Petrol" and "Disease, eg virus" were seen as the most suitable methods (57.5 per cent and 57.7 per cent of respondents finding these methods either very suitable or suitable respectively) (Table 26). Cyanide and predators were considered least suitable, although a large proportion of respondents (24.4 per cent) "don't know" about cyanide.
TABLE 26
Attitudes to Wasp Control Methods
(% of All Respondents)
Insecticide Petrol Cyanide Disease Predator
very 6.9 11.1 6.4 18.4 7.9
Suitable
'@ Suitable 38.1 46.4 21.7 39.3 27.1
Cumulative 45.0 57.5 28.1 57.7 35.0
Percent
Unsuitable 32.8 30.1 34.2 20.8 35.4
Very 7.8 7.6 13.2 14.0 22.5
Unsuitable
Don't Know
Valid 1Op5 1004 1004 1005 1004
Responses
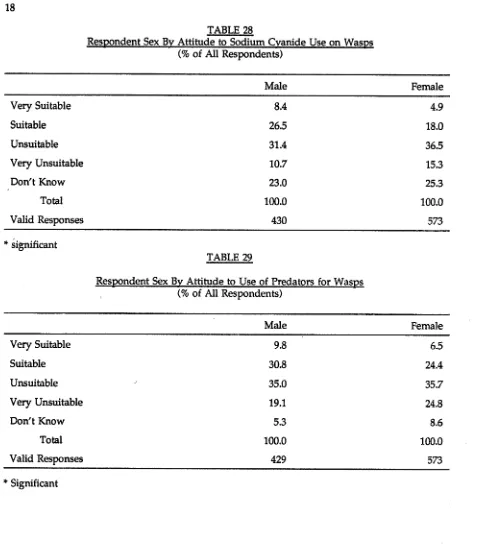
Attitudes to the use of the various control methods differed according to the sex of the respondent. Tables 27 to 30 demonstrate the responses by males and females with respect to the use of the control methods where there was a significant difference between the sexes. A higher proportion of females find insecticide, sodium cyanide, predator and disease use to be unsuitable.
TABLE 27
Respondent Sex Bv Attitude to Insecticide Use on Wasps
(% of All Respondents)
Male Female
Very Suitable
Suitable 42.8 34.6
Unsuitable 28.6 36.1
Very Unsuitable 6.3 8.9
Don't Know 12.6 15.7
Total 100.0 100.0
TABLE 28
Respondent Sex Bv Attitude to Sodium Cyanide Use on Wasvs (% of All Respondents)
Male Female
Very Suitable
Suitable
Unsuitable
Very Unsuitable
Don't Know
Total
Valid Responses
*
significantTABLE 29
Resvondent Sex BY Attitude to Use of Predators for Wasvs
(% of All Respondents)
Male Female
Very Suitable 9.8 6.5
Suitable 30.8 24.4
Unsuitable 35.0 35.7
Very Unsuitable 19.1 24.8
Don't Know 5.3 8.6
Total 100.0 100.0
Valid Responses 429 573
TABLE 30
Respondent Sex Bv Attitude to Wasp Diseases, eg. Viruses as Form of Control
(% of All Respondents)
Male Female
Very Suitable
Suitable
Unsuitable 203 21.1
Very Unsuitable 10.2 16.8
Don't Know 5.6 8.9
Total 100.0 100.0
Valid Responses 430 573
%
*
SignificantRespondents also differed in their attitude to the control methods suggested according to the age of the respondent. Table 31 demonstrates the difference in attitude with respect to insecticide use. There is a decline in the proportion of respondents indicating that insecticide is suitable as age increases as well as a decline in the proportion indicating the method is unsuitable. However, the proportion of respondents who "don't know" increases as age increases.
TABLE 31
Age Bv Attitude to Use
of
Insecticide for Wasps(% of All Respondents)
20 and 21-30 31-40 41-50 51-60 Over 60
under
Very Suitable 9.3 3.4 6.6 8.8 9.9 5.2
Suitable 44.4 43.6 36.4 35.8 39.0 36.2
Unsuitable 31.5 33.6 33.8 35.3 33.3 29.3
Very Unsuitable 7.4 10.7 9.2 9.3 6.4 3.9
Don't Know 7.4 8.7 14.0 10.8 11.3 25.3
Total 100.0 100.0 100.0 100.0 100.0 100.0
Valid Responses 54 149 228 204 141 229
*
significantTABLE 32
Age Bv Attitude to Use of Sodium Cvanide for Wasps
(% of All Respondents)
20 and 21-30 3140 41-50 51-60 Over 60
under
Very Suitable 5.6 1.3 6.1 5.4 10.7 8.3
Suitable 20.4 24.8 17.1 18.1 21 -4 27.9
Unsuitable 35.2 37.6 33.8 39.7 32.8 28.4
Very Unsuitable 27.8 18.1 11.4 10.8 12.1 11.4
Don't Know 11.1 18.1 31.6 26.0 22.8 24.0
Total 100.0 100.0 100.0 100.0 100.0 100.0
Vqlid Responses 54 149 228 204 140 229
- - -
* significant
The suitability of the use of diseases, eg. viruses, for wasps is considered high amongst younger respondents while the proportion of respondents considering the method to be unsuitable or very unsuitable increases with the age of the respondent (Table 33). The proportion of respondents who "don't know" also increases with respondent age. A similar response is recorded for the relationship between age and the use of predators as a wasp control method (Table 34).
TABLE 33
Age BY Attitude to Use of Diseases, ep. Viruses for Wasps
(% of All Respondents)
20 and 21-30 3140 41-50 51-60 Over 60
under
Very Suitable 24.1 24.8 22.8 18.6 12.8 11.8
Suitable 55.6 39.6 43.4 33.8 36.2 38.0
Unsuitable 9.3 18.8 14.9 23.0 20.6 28.8
Very Unsuitable 9.3 11.4 11.4 18.6 21.3 10.9
Don't Know 1.9 5.4 7.5 5.9 9.2 10.5
Total 100.0 100.0 100.0 100.0 100.0 100.0
Valid Responses 54 149 228 204 141 229
TABLE 34
Age Bv Attitude to Use of Predators for Wasps (% of All Respondents)
20 and 21-30 31-40 41-50 51-60 Over 60 under
Very Suitable 16.7 8.1 11.8 6.4 6.4 3.9
Suitable 22.2 32.9 23.7 30.9 24.3 26.2
Unsuitable 42.6 38.3 39.0 29.4 32.9 34.9
Very Unsuitable 14.8 18.1 19.3 27.5 28.6 22.3
Don't Know 3.7 2.7 6.1 5.9 7.9 12.7
Total 100.0 100.0 100.0 100.0 100.0 100.0
Valid Responses 54 149 228 204 141 229
*
significantTABLE 35
Occupation Bv Attitude to Use of Wasp Diseases, ep. Viruses to Control Wasps
(% of All Respondents)
Very Suitable Un- Very Don't Total Valid
Suitable suitable Unsuitable Know Resp
Retired
Clerical
Service
Housewife
Technical/ Professional
1;rbductionl Labour
Farmer
Sales
Agriculture
Admin/ Managerial
Student
Un- employed
Sickness Beneficiary
Self Employed
*
SignificantTABLE 36
Education After High School Bv Attitude to Wasp Diseases, eg. Viruses
(% of All Respondents)
Yes No Don't Know
Very Suitable 22.9 14.9
-
Suitable 34.9 43.0 100.0
Unsuitable 20.2 21.5
Very Unsuitable 15.1 12.7
-
Don't Know 6.9 7.9
-
Total 100.0 100.0 100.0
Valid Responses 436 558 1
"
SignificantAn analysis of the relationship between the respondents' attitude to the use of imported natural enemies and diseases with respect to their attitude to the use of a disease, eg. virus for wasp control was camed out. Table 37 reports a close relationship between the two sets of responses with a high proportion of those respondents who are in favour of disease and enemy control methods finding the wasp disease to be very suitable or suitable. Also, a high proportion of those who are generally opposed to such methods find the wasp virus to be unsuitable or very unsuitable. However, a significant proportion of those who are generally opposed find a wasp disease to be very suitable or suitable (9.4 per cent and 32.6 per cent respectively) reflecting a readiness to accept such control methods in particular circumstances. A high proportion of those who "don't know" where they stand on the use of natural enemies and diseases were in favour of using a disease for wasp control (19.5
per cent finding it very suitable and 36.8 per cent finding in suitable).
TABLE 37
Attitude to Introduction of Disease & Enemies
By Attitude to Use of Wasp Disease, en. Virus
(% of All Respondents)
In Favour of Introduced Diseases?
Yes Don't Know
Wasp Disease, ep. Virus:
Very Suitable
Suitable
Unsuitable
Very Unsuitable
Don't Know 5.4 6.7 21.9
Total 100.0 100.0 100.0
Valid Responses 406 509 87
2.3.3 Attitudes to Virus Control Method for Wasps
Respondents were told that "a virus disease has recently been introduced to New Zealand to help to control wasps". The respondents were then asked if they had heard of this before. Only 30.0 per cent of respondents had heard of this introduction. There was a significant difference between age groups with respect to this knowledge. A much higher proportion of older people had heard of the virus than had younger people. The most significant group was the 41 to 50 years age group with 42.2 per cent having heard of the virus (Table 38).
TABLE 38
Age Bv Have Heard of Wasp Virus
(% of All Respondents)
20 years or 21-30 3140 41-50 51-60 Over 60 less
Yes 14.8 18.1 26.8 42.2 32.6 32.3
No 85.2 81.9 73.2 57.8 67.4 67.7
Total 100.0 100.0 100.0 100.0 100.0 100.0
Valid Responses 54 149 228 204 141 229
*
significantThere was no difference between respondents with respect to where they live and their knowledge of the wasp virus.
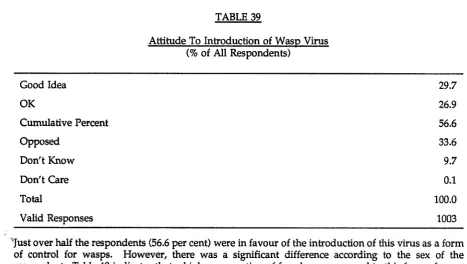
All respondents were asked "which of the following best describes how you feel about introducing
TABLE 39
Attitude To Introduction of Wasp Virus
(% of All Respondents)
Good Idea
OK
Cumulative Percent Opposed
Don't Know Don't Care Total
Valid Responses
TABLE 40
Respondent Sex
Bv
Attitude to Introduction of Wasv Virus(% of All Respondents)
Male Female
Good Idea
OK
opposed Don't Know
Don't Care
Total
Valid Responses
1
*
significantAge was also a significant factor with respect to the attitude to the introduction of viruses to control wasps. As respondent age increases, the proportion of respondents opposed to the introduction of the virus grows with'20.4 per cent of 20 years and under respondents opposed and 41.9 per cent of over 60 years respondents opposed (Table 41).
TABLE 41
Ape BY Attitude to Introduction of Wasv Virus (% of All Respondents)
J
20 and 21-30 31-40 41-50 51-60 Over 60 under
Good Idea 35.2 34.2 32.9 29.9 27.0 23.8
OK
40.7 31.5 31.6 25.0 20.6 21.6% ' O s e d 20.4 24.2 28.1 35.8 41.1 41.9
Don't Know 3.7 10.1 7 5 9.3 11.3 12.3
Total 100.0 100.0 100.0 100.0 100.0 100.0
Valid Responses 54 149 228 204 141 229
'
*
significantTABLE 42
Occuvation Bv Attitude to Introduction of Wasp Virus
(% of All Respondents)
Good OK opposed Don't Don't Total Valid
Idea Know Care Resp
Retired 23.0 20.2 43.3 13.5
-
100.0 178Clerical 30.9 27.2 33.3 8.6
-
100.0 81Service 27.9 22.1 44.1 5.9
-
100.0 68Housewife 27.6 21.3 , 36.2 15.0
-
100.0 127Technical/ 28.9 32.0 29.4 9.6
-
100.0 197Professional
Production/ 32.7 27.4 31.9 8.0
-
100.0 113Labour
'ur
Farmer 43.2 24.3 27.0 5.4
-
100.0 37Sales 26.7 30.0 35.0 8.3
-
100.0 60Agriculture 33.3 30.0 26.7 6.7 3.3 100.0 30
Administration 40.5 24.3 29.7 5.4
-
100.0 37/ Managerial
Student 40.5 43.2 13.5 2.7
-
100.0 37Unemployed 23.5 47.1 23.5 5.9
-
100.0 17Sickness .
-
33.3 66.7-
-
100.0 3Beneficiary
Self Employed 50.0 37.5 12.5
-
-
100.0 8*
significantTABLE 43
Comments Referring to Introduction of Wasp Virus (% of Those Who Made Comments)
Need For Good Research
If Only Affects Wasps
Not Well Informed
Needs To Be Well Controlled
Dangerous/Mutations Occur
Used
As Last OptionWhat Are Other Effects
No More Diseases Introduced
0 b e r
Total
Valid Resuonses
2A Possum Problems
2.4.1 Current Problems and Control
Respondents were asked if they had a problem with possums where they live. The results are given
in Table 44. Only 23.4 per cent of respondents indicated they had a problem with possums.
TABLE 44
Is There A Possum Problem Where You Live
(% of A.ll Resmndents) Yes
No
Don't Know
Total
Valid Responses
TABLE 44A
Where You Live Bv Do You Have a Possum Problem Where You Live
(% of All Respondents)
Rural Town City
Yes
No
Don't Know
Total
Valid Responses
*
significantAll respondents were asked if they thought the possum problem had "become worse, is much the @same or become less over the last five years". A high proportion of respondents (76.) per cent)
thought the problem had become worse (Table 45).
TABLE 45
Has The NZ Possum Problem Changed Latelv
(% of All Respondents)
Become Worse
The Same
Become Less
Don't Know
Total
Valid Responses 1005
TABLE 46
Age BY Has NZ Possum Problem Changed
(% of All Respondents)
20 and 21-30 31-40 41-50 51-60 Over 60
under
Become Worse 64.8 63.8 70.2 80.4 77.3 87.8
The Same 18.5 26.2 18.9 10.3 12.1 4.8
Become Less 7.4 1.3 2.6 2.5 2.1 0.4
Don't Know 9.3 8.7 8.3 6.9 8.5 1.6
Total 100.0 100.0 100.0 100.0 100.0 100.0
Valid Responses
f
* significant
A higher proportion of rural living respondents thought the problem had worsened than did respondents in the t o m or cities (Table 47).
TABLE 47
Where You Live By Has NZ Possum Problem Changed
(% of All Respondents)
-- -
-Rural Town City
Become Worse
The Same
Become Less 1.3 2.8 1.9
Total 100.0 100.0 100.0
Valid Responses 166 312 521
*
significantRespondents were asked to indicate if they thought enough was being done to control possums in New Zealand. The largest group (64.6 per cent) thought that not enough was being done (Table 48).
TABLE 48
Is Enough Being Done To Control Possums (% of All Respondents)
Yes 17.0
No 64.6
Don't Know 18.5
Total 100.0
Valid Responses 1002
TABLE 49
Age Bv Is Enough Being Done About Possum Problem (% of All Respondents)
*
20 and 21-30 31-40 41-50 51-60 Over 60 under
Yes 33.3 20.9 22.8 11.3 14.2 11.4
No 59.3 56.1 60.1 71.4 67.4 68.0
Don't Know 7.4 23.0 17.1 17.2 18.4 20.6
Total 100.0 100.0 100.0 100.0 100.0 100.0
Valid Responses 54 149 228 204 141 229
*
significantThere was no relationship between where the respondent lived and the attitude to the effort being expended on the possum problem (Table 50).
TABLE 50
Where You Live Bv Is Enough Being Done About The Possum Problem (% of All Respondents)
Rural Town Citv
Yes
No
Don't Know
Total
Valid Responses 166 311 519