Lincoln University Digital Dissertation
Copyright
Statement
The
digital
copy
of
this
dissertation
is
protected
by
the
Copyright
Act
1994
(New
Zealand).
This
dissertation
may
be
consulted
by
you,
provided
you
comply
with
the
provisions
of
the
Act
and
the
following
conditions
of
use:
you
will
use
the
copy
only
for
the
purposes
of
research
or
private
study
you
will
recognise
the
author's
right
to
be
identified
as
the
author
of
the
dissertation
and
due
acknowledgement
will
be
made
to
the
author
where
appropriate
you
will
obtain
the
author's
permission
before
publishing
any
material
from
the
dissertation.
The growth, development
and agronomic management of
Camelina sativa
A dissertation
submitted in partial fulfilment
of the requirements for the Degree of
Bachelor of Agricultural Science with Honours.
at
Lincoln University
by
Lachlan Murray Turley
Abstract of a thesis submitted in partial fulfilment of the
requirements for the Degree of Bachelor of Agricultural Science with Honours.
The growth, development
and agronomic management of
Camelina sativa
by
Lachlan Murray Turley
Over the 2013/2014 growing season a Camelina growth trial was undertaken at Ashley Dene, Canterbury, New Zealand to determine the response to different sowing dates, sowing rates and the application of plant growth regulators. This was done to analyse how the crop grows and develops in New Zealand conditions and the effect that agronomic mangement has.
There were three sowing dates spread out over the spring period and three different sowing rates 2,4 and 6 kg ha·1 of 'Calena' and a treatment of ll/ha Cycocel® plant growth regular
was applied to half the subplots. Emergence, plant populations, plant characteristics, growth stages, biomass yields, seed yields, weed yields and oil content was measured.
It was clear from emergence counts that there was significant seedling deaths for sowing date one and two with maximum survival being 31% and 56% respectively, compared to a minimum of 96% for sowing date three and this was attributed to herbicide interaction with cold temperatures. Consequently seed yield was highest for sowing date 3 on 1211 kg ha·1
compared to 883 kg ha·1 and 577 kg ha·1for sowing date one and two. However despite the
significant population decrease sowing date one and three had similar biomass yields.
Sowing rate interactions however were consistent and seed yield, biomass and density all increased with increasing sowing rate. Plant growth regulators only effected plant height and were unnecessary as there was no lodging observed.
Keywords: Camelina, Camelina sativa, linseed dodder, false flax, gold of pleasure, marginal
Table of Contents
Abstract ... ii
Acknowledgements ... iv
Table of Contents ... v
List of Tables ... vii
List of Figures ... viii
! INTRODUCTION ... 1
2 REVIEW OF LITERATURE ... 3
2.1 Introduction ... 3
2.2 Camelina History and Uses ... 3
2.2.1 Crop History ... 3
2.2.2 Crop Uses ... 4
2.3 Botanical and physiological features ... 6
2.3.1 Botanical description ... 6
2.3.2 Camelina Seed ... 6
2.4 Crop Management ... ., ... 13
2.4.1 Planting method ... 13
2.4.2 Planting Date ... 13
2.4.3 Planting Rate ... 16
2.4.4 Diseases ... 17
2.4.5 Weeds ... 17
2.4.6 Lodging ... 18
2.4. 7 Fertiliser ... 18
2.4.8 Chemical Applications ... 19
2.4.9 Dual and lntercropping ... ,. ... 19
2.4.10 Harvest ... 19
2.5 Conclusions ... 21
3 MATERIALS AND METHODS ... 22
3.1 Laboratory Experiment ... 22
3.1.1 Calculations ... 22
3.2 Field Experiment ... 22
3.2.1 Locations and Site History ... 22
3.2.2 Experimental Design ... 23
3.2.3 Sowing and Establishment ... 23
3.2.4 Agrichemical Use ... 23
3.2.5 Soil fertility ... 24
3.2.6 Measurements ... 25
3.3 Meteorological data ... 26
3.4 Thermal time ... 26
4 RESULTS ... 28
4.1 Determination of Cardinal temperatures ... 28
4.2 Field Experiment ... 32
5 DISCUSSION ... 38
5.1 Cardinal Temperatures ... 38
5.1.1 Base Temperature ... 38
5.1.2 Optimum Temperature ... 38
5.1.3 Maximum Temperature ... 38
5.2 Sowing Date ... 39
5.2.1 Development Time ... 39
5.2.2 Thermal Time ... 39
5.2.3 Plant Population ... 39
5.2.4 Seed Yields ... 40
5.2.5 Thousand Seed Weight ... 41
5.2.6 Weeds ... 41
5.2. 7 Camelin a Biomass ... 42
5.2.8 Oil Content ... 42
5.3 Sowing Rate ... 43
5.3.1 Density ... 43
5.3.2 Seed Yield ... 43
5.4 PGR's ... 43
6 GENERAL DISCUSSION AND CONCLUSIONS ... 44
6.1 General Discussion ... 44
6.2 Conclusions ... 46
List of Tables
Table 4.1 Average maximum germination count, average final emergence count and average survival from maximum to final count (%) under 3 different sowing rate treatments: 2kg ha-1, 4kg ha-1 and 6kg ha-1 and 3 different sowing date
treatments: 21st August 2013, 13th September 2013 and 3rd October 2013 from weekly field measurements at Ashley Dene, Canterbury, New Zealand taken from sowing until 50, 40 and 26 days after sowing respectively ... 32 Table 4.2 Average Camelina height (cm), total biomass (kgDM ha-1) and seed yield (kg
ha-1) under 2 different plant growth regulator rates 0 L ha-1, 1 L ha-1 from measurements taken at final harvest which occurred on 15th January 2014 for sowing date 1 and 28th January for sowing date 2 and 3 at Ashley Dene,
Canterbury, New Zealand ... 33 Table 4.3 Camelina plant nitrogen levels (%) across 3 different sowing date treatments:
21st August 2013, 13th September 2013 and 3rd October 2013, Taken from field trials at growth stage 30 at Ashley Dene, Canterbury, New Zealand ... 33 Table 4.4 Average Camelina plant density (plants m-2), Camelina total biomass (kgDM
ha-1), Seed Yield (kg ha-1), harvest index and thousand seed weight (g) under 3 different sowing rate treatments: 2kg ha-1, 4kg ha-1 and 6kg ha-1 and 3
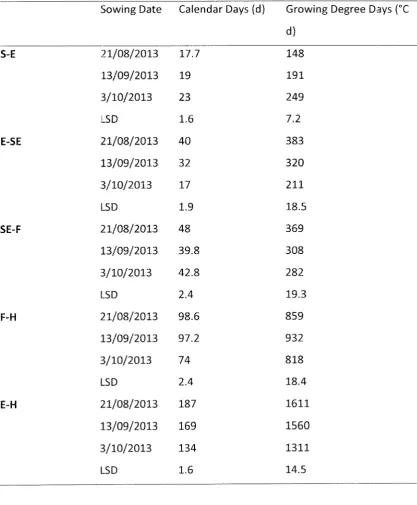
different sowing date treatments: 21st August 2013, 13th September 2013 and 3rd October 2013 and their interaction, measurements taken at final harvest which occurred on 15th January 2014 for sowing date 1 and 2gth January for sowing date 2 and 3 at Ashley Dene, Canterbury, New Zealand ... 34 Table 4.5 Average calendar days (d) and growing degree days (°C d) from sowing to
List of Figures
Figure 2.1 Rate of oil accumulation in Camelina sativa seed at different stages of
development. (Rodrfguez-Rodrfguez et al., 2013) ... 9 Figure 2.2 Relationship between planting density (seeds m ·2) and camelina seed yield
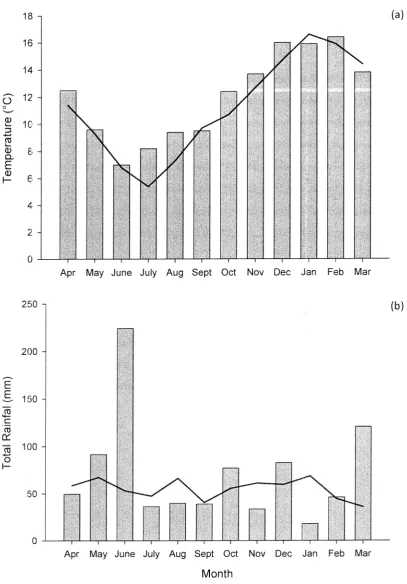
(kg ha-1). (Johnson, 2011) ... 16 Figure 3.1 The bars are (a) mean monthly temperature (°C) and (b) total monthly rainfall
(mm) at Broadfields meteorological station for the 2013-2014 growth period. The lines are the long term trends from 1975-2010 ... 27 Figure 4.1 Germination rate(% germinated) over time (days) with 8 different
temperatw·e treatments: S°C ( }, l0°C (c'), 15°C ( ), 20°C ( ), 30°C ( ), 35°C ( ), 40°C ( ) for three different cultivars, Suneson (a), Calena (b), and 4164 (c) ... 29 Figure 4.2 Rate to 50% germination (d-1) of Camelina sativa under eight different
temperatures for three different cultivars, Suneson ( • ), Calena (c'), and 4164 ( }. Error bars are SEM ... 30 Figure 4.3 Thermal time between growth stages (°C d) against day length at 100%
emergence (h) for four different growth stages: Sowing to 100% emergence (•) (r2=0.76), 100% emergence to 50% stem elongation(<>) (r2=0.85), 50% stem elongation to 50% flowering ( ) (r2=0.64) and 50% flowering to harvest ( )
1 INTRODUCTION
Diesel makes up 38% of New Zealand's current fuel demands (Ministry of Economic
Development, 2008). Biodiesel is physically similar to diesel and can either be a substitute or additive to diesel that is cleaner burning and more sustainable (US Department of Energy, 2014).
Oil based crops such as oilseed rape, palm oil and soybean oil are the main sources of biodiesel feedstock (Tulloch, 2009). However these require fertile land and most are also used as food crops, this has created a link between food prices and biofuel production (Boddiger, 2007).
The adoption of marginal land biofuel crops such as Carnelina (Camelina sativa) would not only help better utilise marginal land but it would also decrease the effect of biofuels on food prices and supply (Cai, Zhang,
&
Wang, 2010).Camelina is a close relative of oilseed rape (Brassica napus) and offers cold hardiness, drought tolerance, and low fertility requirements. Camelina has potential as a fuel component and also as a food component due to high omega-3 oil content (State, 2014).
Despite being a historic plant in the Mediterranean region Camelina only recently gained worldwide attention (Zohary, Hopf,
&
Weiss, 2012) and there have been several trials in Europe and North America as well some in Chile and Australia (Berti, Wilckens, Fischer, Solis,& Johnson, 2011; Burton et al., 2008; Riffkin, O'Leary, & Acuna, 2012; Urbaniak, Caldwell, Zheljazkov, Lada, & Luan, 2008). There have been very few trials of Camelina viability in New Zealand conditions (Fasi, Martin, Smallfield,
&
McKenzie, 2012; McKenzie, Smallfield, Fasi,&
Martin, 2011).The objective of this study was to analyse how Camelina sativa grows and develops in New Zealand conditions and the effect of agronomic management on its growth and
2 REVIEW OF LITERATURE
In this literature review the history, use, physical, environmental and managerial factors that affect the success of Camelina sativa in New Zealand will be summarised. Specifically
literature on the uses, botanical and physiological features and crop management will be reviewed in detail. The main points will then be summarised in the conclusions section.
2.1 Introduction
Camelina (Camelina sativa) is a temperate, perennial, oil seed crop (Ciubota-Rosie, Ruiz, Ramos, & Perez, 2013). It is also known as Camelina, linseed dodder, false flax or gold of pleasure (Zohary et al., 2012). It was mainly grown as an agricultural crop in Europe up to the 1950's (Johnson, 2011) and until recently Camelina was widely regarded as a 'relic crop' and has gained recent attention as a promising oilseed crop that is cold tolerant and can be grown on marginal land. It experienced huge declines in use in the 20th Century, this is attributed to; the ease of refining oilseed rape (Brassica napus), the lack of knowledge regarding polyunsaturated fats and some say harvest difficulty due to the relatively small sized seeds (Davis, 2010)
2.2 Camelina History and Uses
2.2.1 Crop History
Camelina sativa is believed to originated as a 'secondary crop' meaning it was first discovered as a weed within crops such as flax and then developed into an oilseed crop (Zohary et al., 2012). The first evidence of its existence dates back to circa. 2000 BCE and was found in Auvernier, Switzerland. There was also evidence of its presence throughout central Europe in throughout the Bronze period (1800-1200 BCE). Later in the bronze period there was evidence of Camelina sativa in Eastern Europe and then early in the iron period there is also evidence of its presence in the western parts of Asia indicating that the crop was domesticated in central Europe and then spread through Eastern Europe to Asia (Ehrensing
& Guy, 2008).
Biofuels are becoming increasingly important due to their potential ability to replace fossil fuels as a more secure, sustainable and environmentally friendly source of energy (Zohary et al., 2012). However many biofuel crops such as oil seed rape and corn (Zea mays L.) take up fertile land effectively taking food out of consumption and further increasing the food deficit. These crops also rely on high inputs, which can be expensive, and some of the inputs are even produced from fossil fuels (Bassam, 2013).
2.2.2 Crop Uses
Human consumption
Gugel and Falk (2006}and Josef Zubr (1997) stated that traditionally Camelina oil was used for direct human consumption. Camelina oil can be used in cosmetic applications as well as a food product for cooking, baking, salads and frying and is high in healthy omega-3 fatty acids (Josef Zubr, 1997). However Vollrnann, Moritz, Karg!, Baumgartner, and Wagentristl (2007) stated that Camelina has high amounts of trans fatty acids in its oil, which increases the risk of cardiovascular disease in humans. There is some concern into the negative effects of glucosinates, which are present in some oils such as Camelina oil, however these concerns are limited and there are no current restrictions on food limits in New Zealand (NZFSA, 2009).
Biofuels
Ciubota-Rosie et al. (2013} found that Camelina had a relatively high oil content and easily extracted and refined oil, as well as being easily transesterified by alkali catalysts which was also confirmed by Wu and Leung (2011). However the biodiesel obtained does not meet all quality standards. The biodiesel contained high levels of linolenic acid methyl ester,
both the 7% and 15% mix would meet ASTM cetane minimums of 40CN with 50.16 and
49.74 respectively (US Department of Energy, 2013). Zaleckas et al. {2012), (Moser &
Vaughn, 2010); Soriano Jr and Narani (2012), Moser and Vaughn (2010) and Ciubota-Rosie et al. (2013) all conclude that the high levels of unsaturated fatty acids are the most significant barrier to Camelina being an effective biofuel crop. Ciubota-Rosie et al. (2013) also noted that genetic engineering of Camelin a and long term conventional breeding would be a good tool to reduce unsaturation and molecular weight which would make it significantly more suitable as 21 biofuel crop. Muppaneni et al. (2012) and Soriano Jr and Narani (2012) found
Camelina biodiesel to have viscosity similar to that of regular dieseUt also found the 'pour point' (point which biodiesel starts to turn solid) was -13 to -15°( and although this just meets the required standards it is significantly higher than regular diesel at -20°C. However it is similar to other biofuels such as soy and canola. Soriano Jr and Narani (2012) noted the EPA mandated the use of ULSD (Ultra Low Sulphur Diesel) in the USA, Camelina has approximately 5.46ppm of S which is just below the required 6ppm of S. Frohlich and Rice (2005) also showed that Camelina has good lubricating properties. (Paulsen, Wichmann, Schuemann,
&
Richter, 2011) also showed that additives could be used to double the oxidation resistance of Camelina biofuels.Animal feed
Josef Zubr (1997) stated that the seed meal could be potentially is of high value as feed for poultry, swine and ruminants. R. Russo and Reggiani (2012) noted glucosinates provide a significant barrier to the use of Camelina meal or seeds as an animal feed. Glucosinates have been shown to affect animal growth, reproductive performance, as well as intake and
palatability of feed. Although Camelina has relatively low levels of glucosinates in the seed meal after oil pressing which ranges from 15.2 to 24.6µmol kgDM-1. However these levels are significantly higher than those required for feed use in both Europe which are 1-1.5 µmol kg-1 of feed for monogastric animals (Andersson et al., 2008} and restrictions are also
present in the USA. R. Russo and Reggiani (2012) also stated that the use of breeding was effective at reducing oilseed rape from 50-150µmol kgDM-1 to under 2µmol kgDM-1 so could
also be effective for Camelin a. However there is concern that lower concentrations of glucosinates may result in higher concentrations of sinapine which decreases palatability to animals, however more research needs to be done into the interaction of these two
lignification of the plant. Which would significantly diminish its use as a forage crop particularly in late spring to summer. (Schuster & Friedt, 1998) noted the use of Camelina meal was similar to oilseed rape meal and has high protein and energy. It also been noted that it is only part of a balanced amino acid diet and should not be used exclusively.
However the study made no comment on the presence of glucosinates, which limit its use as an animal feed.
2.3 Botanical and physiological features
2.3.1 Botanical description
Camelin a sativa is a member of the Brassicaceae family, which is also known as the crucifers or mustard family. It is closely related to oilseed rape and is only one of four known member of the Camelina genus, and is the most documented and well known (Ehrensing
&
Guy, 2008). There are five species of Camelina with sativa being the oilseed crop and species macrocarpa, pi/osa, alyssum and lincola being the wild and weedy forms of the plant found across Europe, North America and Asia. Camelina species; macrocarpa is identifiable by its small fruit, pi/osa is identifiable by its early flowering time and hairy appearance, while asyssum and lincola both have long erect stems and hard fruit. The key difference between these weed subspecies and the crop subspecies (sativa) is the larger pear-shaped fruit, bigger seeds, typically 1.5-2.0 mm long, and a higher amount of edible oils, typically 27-31% (Zohary et al., 2012).2.3.2 Camelina Seed
Seed Size
Gugel and Falk (2006) noted that Camelina typically has small seeds, especially in comparison with other brassica crops, and they recorded them at 1.5 to 1.8 g per 1000 seeds. Although there was a wide range across many papers and cultivars; Blackshaw et al. (2011) found 1.2g and 1.18g per 1000 seeds, Johnson (2011) recorded it ranging from 0.92g to 1.46g per 1000 seeds and Gehringer, Friedt, LOhs, and Snowdon (2010) found a wider range of 0. 7g to 1.6g per thousand seeds similar to another large study by (Berti et al., 2011}, which showed a range from 0.8g to 1.8g per thousand seeds. The large variation was likely caused by the different trials being run in different environments using a range of cultivars.
with a negative correlation between 1000- seed weight and oil content (r2
=
-0.92). Howeversamples of bigger seeds show high levels of variation meaning there is a breeding
opportunity to select bigger seeds that also have higher oil content and yields (Vollmann et al., 2007). Johnson (2011) recorded 10 and 9 seeds per pod across two different cultivars but (Vollmann et al., 2007) noted that bigger seeds have less seeds in each pod and found better oil yield performance from smaller seeds which they attributed to be due to them containing more seeds in each pod as well as higher oil percentage. This is in keeping with many other oilseed crops, which have also shown a slight negative correlation between oil content and 1000-seed weight (Gugel & Falk, 2006). Gugel and Falk (2006) noted a lack of seed dormancy in Camelina meaning there would be lower instances of post-harvest weed infestations of Camelina in following crops.
Germination Rate
There is little published data regarding the germination rates of Camelina but Johnson (2011) recorded germination as over 95% for the tested Canadian cultivars, which was also confirmed with similar rates found by Blackshaw et al. (2011) of 95% and 99% for two different cultivars.
Oil Content
Fasi et al. (2012) found the average oil content of Camelina to be 35%, slightly below the 42% it found for oilseed rape and similar to that found by Ciubota-Rosie et al. (2013) of 35-45% and slightly higher than found in A. D. Pa-,11ista, Baltensperger, Isbell, and Hergert (2012) of 31.8%. While Gugel and Falk (2006} found a range from 38 - 43%, similar to the 39.6 to 44.1% range found by J Zubr (2003). Angelini, Moscheni, Colonna, Belloni, and Bonari (1997} had the widest reaching measure of 24-43%. The wide range of Camelina oil content
indicates the possibility of increased breeding to create higher oil cultivars (Rodrfguez-Rodrlguez, Sanchez-Garcia, Salas, Garces,
&
IVlartfnez-Force, 2013). Vollmann et al. (2007) indicated this has already happened in some cases with a significant difference in the oil content across cultivars, which ranges from 15.5% (CAS-CS7) to 41.7% {CAS-CS32).Oil composition
Vollmann et al. (2007) noted that Camelina oil is made up of 90% unsaturated fatty acids with 33% being mono-unsaturated and 54% being unsaturated (2 or 3 double bonds}.
and eicosenic/gondoic acid (C 20:1) making up approx. 15% (Abramovic, Butinar, & Nikolic, 2007). Vollmann et al. (2007) found linolenic acid content had an average range of 29-35% with cultivar crosses between small and large seeds exhibiting higher linolenic content, there was also evidence that linolenic content was negatively correlated with time to flowering and oil content, but positively correlated between with 1000 seed weight. Euric acid (C 22:1) was generally between 3 and 4.5%, but some of the mutant lines Vollmann et al. (2007)) tested showed a greater variability with one showing higher euric acid content (CMUT-838/1) of 4-6.5% and the others showing a range of 2-3%. There was significantly higher levels of linolenic acid during a cold seasong which may be explained by Velasco, Fernandez-Martfnez, Garcia-Ruiz, and Dominguez (2002) which showed in general oilseed crops
produce more polyunsaturated fats when they have low temperatures during the seed fill periods while higher temperatures result in higher saturated fatty acid concentration, there were also lower levels of eruric acid in the same year found by Vollmann et al. (2007). Rodriguez-Rodriguez et al. (2013) also found temperature and fatty acid concentrations to be positively correlated with linoleic and arachidic acids and negatively correlated with eicosadienoic and eicosatrienoic acids. It was also stated that high levels of linolenic and linoleic makes the oils prone to oxidation, which is an undesirable trait for most industrial uses, especially biofuels.
Protein content
Gugel and Falk (2006) found that average crude protein (CP} per kgDM of Camelina seed ranged from 27 to 32% in keeping with the Brassica checks it used for comparison that ranged from 27 to 32%. However these Camelina figures are slightly higher than those recorded by Peiretti and Meineri (2007) of 24.5% CP but point to a wider range of protein content also reinforced by Marquard and Kuhlmann (1986) with a range of 23.5 to 30.1% CP. There was also a range of figures for protein on a fat free DM basis such as J Zubr (2003) with 41.8 to 44.8%, (J Zubr, 1988) with 45% and Korsrud, Keith, and Bell (1978) with 45.1% to 46.9% which show less variability and therefore may be more comparable.
Peiretti and Meineri (2007) also measured the protein present in the plant with the highest protein content being recorded at the vegetative stage of 220 g kgDM-1 and decreasing down
Fibre content
J Zubr (2003) found a relatively small variability of crude fibre content (on a fat free basis) in camellia seed ranging from 12.5% to 16.8% across 7 different European countries with an average of 14.5% crude fibre. Korsrud et al. (1978) recorded 11.4% and 9.8% crude fibre on a DM basis.
Development
Fasi et al. (2012) found that autumn sown Camelina took 72 days to reach stem elongation, compared to 148 for oilseed rape, 93 days to reach 50% flowering compared to 45 days for oilseed rape and 86 days to harvest compared with 72 for oil seed rape, taking a total of 259 days from emergence to harvest. However in the spring sowings oilseed rape took 127 and 112 days to go from emergence to harvest but Camelina took only 98 and 91 davs and ended up with higher yields than autumn sowing. Gugel and Falk (2006) found that it took an
average of 40, 41 and 42 days for Camelina to reach flowering across several different locations and also found that it took an average of 86, 94 and 96 days for Camelina to reach maturity, consistent with Fasi et al. (2012).
OAO
0.35 !
-
ow~
"O Q.)
0.25 Q.) (/)
-
0)E
0.20
-
...
c
(l,)
...
c: 0.158
0
0.10 1 '8.8 µg day' :
0.05
y
/
0.00
0
5
10 15 20 25Days after flowering (OAF)
Figure 2.1 Rate of oil accumulation in Camelina sativa seed at different stages of
development. (Rodriguez-Rodriguez et al., 2013)
Rodriguez-Rodriguez et. al. (2013) found a continuous accumulation of oil during seed development, although the rate at which it accumulated varied (Figure 2.1). Accumulation started of slower at 8.8µg/day then increased to 15.lµg day-1 before tapering off to 7.6µg
day-1. The levels of saturated fatty acids (palmitic and stearic) also peaked 6 days after flowering (at 23.4 and 24.4%) and then continued to decrease until the plant was mature. This was the opposite of linolenic acid, which increased from 4.3% at 6 days after flowering to 41% at maturity.
Water use and moisture stress
Gugel and Falk (2006) performed a trial in western Canada over 3 years one of which was dryer than usual and the other was considered a drought. They found that Camelina survived well in dry conditions and saw better germination and stand establishment in comparison to some Brassica species trialled. Camelina also matured 3-4 and 6 days earlier in drought conditions in comparison to higher rainfall years. Berti et al. (2011) also stated that the lower rainfall was likely the cause of faster maturity in one of their Camelina fields. Fleenor {2011) noted that Camelina responds well under drought stress and may be better suited to low rainfall areas than most other oilseed crops. Angelini et al. (1997) noted that a late season drought caused a faster seed filling and therefore seed weight was severely down with seed yield being below 1 g planr1 and lower oil content was recorded of 24 to 33%. Hunter and
Roth (2010) also found that Camelina did not yield in high rainfall environments.
J Zubr and Matthaus (2:002) concluded that Camelina was flexible across a variety of
categories on a stoney and a pumice soil such as oil yield/ha and seed yield/ha however not in total DM ha-1. When specifically looking at oil yield (kg ha-1) oilseed rape performed better at autumn-winter plantings across all 3 tested marginal soils. However on the stoney soil Camelin a outperformed oilseed rape in spring planting with SOkgN ha-1 Camelina yielded
145kg ha-1 compared to oilseed rape yielding 130kg ha-1 and at 150kgN ha-1 Camelina and
oilseed rape yielded 271kg ha-1 and 117kg ha-1. Spring sown Camelina on pumice soil also
outperformed oilseed rape yielding 520kg ha-1 at SOkgN ha-1 and 966kg ha-1 at 150kgN ha-1
compared to oilseed rapes 463kg ha-1 and 681kg ha-1. However on the wet and low fertility
soil Camelina was significantly outperformed by oilseed rape. Its poor performance was also noted by Hunter and Roth (2010) that showed Camelina may not perform well in poorly drained soils and Josef Zubr (1997) stated the Camelina does not grow very well in heavy clay or organic soils.
TE?mperature
Camelina has been recognised as a temperate crop (Ciubota-Rosie et al., 2013), however there has been very little research on the effect of temperature on yields although it is acknowledged as a likely impact of oil composition and is likely positively correlated to the speed of development (Vollmann et al., 2007). AFLP fingerprinting data shows a range of clustering of cultivars to certain temperatures indicating significant variation between cultivars with regard to optimum temperature (Francki et al., 2010). Schillinger, Wysocki, Chastain, Guy, and Karow (2012) researched Camelina in Canada and the plants experienced -23°C air temperatures and 32km/h winds for 8h and came out with a 70% survival rate which is comparable to winter wheat in the same region. Indicating a strong resistance to damage from cold temperatures and wind.
R. RUSSO (2013) stated that some winter cultivars of Camelina require vernalisation while the spring cultivars do not, however there are very few details published regarding the different cultivars of Camelina that are currently used. R. Gesch and Cermak (2011) also noted that Camelina is photoperiod sensitive however it did not show any evidence or source to back this up.
occurred within 2 days but there was less than 80% total germination, 4°C and 10°C also received 100% germination but it took longer to achieve,
Gugel and Falk {2006) suffered no frost damage on Camelina despite oilseed rape being damaged by at late frost during the same experiment and consequently had lower yields. Indicating it is very resistant to cold temperatures.
Harvest Index
Berti et al. (2011) stated harvest index in oilseed crops commonly sits between 30-35% with canola usually sitting around 30%. They recorded a significant range of harvest indexes from a late-autumn sowing of 10.2% to an early spring of 39.5%, however no significant effect of sowing date was found indicating there is a large variability in harvest index for Camelin a. This was a slightly wider range to that found by R. Gesch and Cermak (2011), 13% to 29%. In both there was however a concentration around 20-30%.
Breeding
Vollmann et al. (2007) noted than when breeding was selected for increased seed size, there were adverse results including grain yield, oil content and fatty acid profile. Ciubota-Rosie et al. (2013) stated breeding was required to reduce unsaturation and molecular weight of oil, Francki et al. (2010) noted this could be done using a cultivar originating out of the Ukraine with ideal aspects as a parent crop for breeding for these desired characteristics. Schuster and Friedt (1998) noted the need for breeding to reduce glucosinate content, however this is only of secondary importance, as it only needed for animal feed purposes.
Seguin-Swartz, Nettleton, Sauder, Warwick, and Gugel (2013} trialled the interspecific hybridization of Camelina with several other species from the Camelina family. These included C. microcarpa, C. alyssum and C. rumelica subspecies rumelica and transcaspica. While several of the crosses did not warrant further exploration, Camelina x C. alyssum was highly fertile and was largely self-seeded and may be worth further exploration.
Zakharchenko, Kalyaeva, and Buryanov (2013) trialled transgenesis with a synthetic
antimicrobial peptide, this resulted in a successful transgenetic crop, which showed evidence of greater stability and resistance to plant pathogens such as soft rot (Erwina cartovora) and Fusarium spp.
2.4 Crop Management
2.4.1 Planting method
Schillinger et al. (2012) found both broadcasting and direct drilling successful planting methods for Camelina and both showed no significant difference in stand establishment. However there were some differences; the formation of fragile soil crusts after rain may have hindered emergence for direct drilled seeds and a lack of rain after broadcasting may have both negatively effecting plant stand. Josef Zubr {1997) stated that repeated harrowing is an effective way to eliminate germinating weeds before sowing. They also state that broadcasting is a more effective way to reduce weed competition than direct drilling. R. Gesch and Cermak (2011) compared direct drilled and chisel ploughed Camelina. Direct drilled plants flowered 1-2 days earlier than conventionally planted plants possibly due to less freezing stress to direct drilled plants. Tillage was shown to have no effect on seed yield and biomass yield in 2007-2008 season. While the 2008-2009 season showed higher seed yields for no till. Lodging was found to be effected by till in the 2007-2008 season but not the 2008-2009 season. Till also effected the Harvest Index with the chisel ploughed Camelina showing higher harvest index than no-till. In the 2007-2008 period there was no significant effect of tillage on oil content but in the 2008-2009 season the no-till system yielded 70g kg-1
higher. The no-till performed better and this was likely due to warmer soil temperatures due to the insulation of previous organic matter from the cold and also less water absorption into the soil.
2.4.2 Planting Date
32.8% oil content. The timing of planting was also shown to effect the growth stages of the plant with the March, April, September and October showing decreasing time between 50% emergence and stem elongation of 72, 72, 32 and 22 days respectively. They also showed decreasing time between stem elongation and flowering with March, April, September and October respectively showing flowering 103, 82, 18, 16 days after stem elongation.
Flowering to harvest once again showed longer between stages for the autumn sown
Camelina with 84 and 87. The spring sown Camelina was 48 days for September sown and 53 for October sown. A. Pavlista, Isbell, Baltensperger, and Hergert (2011) ran a Camelina trial in Nebraska run over 2005 and 2006, however it's trials were planted from spring to early summer and they were significantly less that Fasi et al. (2012} with days from flowering to seed maturity ranging from 40 days in early spring to 23 days in early summer. Fasi et al. (2012) also found that from emergence to harvest in March, April, September and October respectively showed decreasing times from 259, 241, 98 and 91 days. This is similar to A. Pavlista et al. (2011), which recorded planting to seed maturity, which ranged from 127 days in early spring to only 64 days in early summer. This is in keeping with similar early spring numbers from Berti et al. (2011} ranging from 105 to 159 days. Berti et al. (2011) also found days from sowing to harvest to be 200 to 234 days across different locations for late autumn planting, 185 to 231 for early winter, 152 to 202 days for mid-winter and 123 to 155 for late winter. Which is a downward trend but there is no statistical significance is proven in this.
Fasi et al. (2012) found there was also a significant difference between plant population across sowing dates, the population at establishment are stated and the population at final harvest are shown in brackets. For March April, September and October respectively these were 246 (30), 241 (74), 323 (281), and 290 (223) plants m-2• This however does not line up with seed yields, which were 664, 1162, 1412, and 869 kg ha-1 respectively. Fleenor (2011}
likely heavily impacted by soil type and different weather conditions. A. Pavlista et al. {2011) showed that planting date did not affect oil content. But it did effect oil composition, earlier sowing dates had higher concentrations of C 18:3 (linolenic acid) ranging from 37.1% down to 32% at later sowing dates. This is in direct contrast to C 18.1 (oleic acid) which increased from 14.9% at earlier sowing dates to 16.2% at later sowing dates and lower concentrations of C 18:2 (lino!eic acid) at earlier dates from 18.9 and increasing up to 21.1% at later sowing dates. A. Pavlista et al. (2011) also showed that Camelina matured within 7 days of each other regardlE!SS of sowing date. However A. Pavlista et al. (2011) did not test any autumn sown Camelin a but instead a range of dates ranging from spring to early summer, so results only reflect these time frames.
Berti et al. (2011) studied the effect of sowing date across a range of locations in Chile with sowing dates ranging from late autumn to early spring. The harvest index showed nearly no significant differences apart from one location which showed a significantly lower harvest index for the first sowing date in late autumn and a significantly higher sowing date for the last sowing date in early spring. This is in keeping with the range of harvest index figures found by R. Gesch and Cermak (2011) across a range of dates in autumn, which found that harvest index increased with later sowing dates before decreasing slightly in late autumn. Berti et al. (2011) found that all five locations showed significant differences of biomass yield with four of those five showing the earliest late-autumn sowing date as the highest biomass yielding and then decreasing gradually with a large decrease between the mid and late winter sowing dates. There was a large range of different biomass yields across locations ranging from 4,850 kgDM ha-1 to 12,380kgDM ha-1 at the earliest sowing date and
2158kgDM ha-1 to 5357kgDM ha-1 for the latest early-spring sowing date, with most
locations decreasing by about 50% from the first to last sowing date. The seed yield showed significance on 5 out of 7 of the trials, showing seed yield decreasing with later sowing dates with some increasing at the early winter sowing date before decreasing. Berti et al. (2011) also showed that there was an effect of sowing date on seed oil content in 3 out of 5
2.4.3 Planting Rate
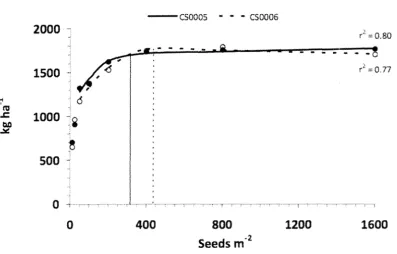
Johnson (2011) found that increased sowing rate had a positive effect on plant population (plants m-2) but at a decreasingly marginal rate. This means decreasing percentage
emergence of plants ranging from 59% at 12 seed m-2to 28% at 1600 seeds m-2. Johnson (2011) also found increasing seed yield with increasing planting rate up to 316 - 437 seeds
m-2 with a peak yield of 1716 to 1772 kg ha-1 before decreasing and flattening off at about 1700
kgha-1 regardless of increasing sowing rate. Planting rates of greater than 200 seeds m-2 was
also shown to decrease flowering time by 1 day and reduce maturity from 96 days to 89 to 90 days.
Wysocki and Sirovatka (2008) recommended sowing rates of 3.4-5.6 kg ha-1 and noted lower
sowing rates often resulted in poor plant stand. This is significantly lower than the 5-7kg ha-1
guide recommended by Josef Zubr (1997}
2000
-1500
"
6
1000
~i·~
500
-0
0
-CSOOOS • .. • CS0006
...
-
""'400
800
Seeds
m·
2r2 == Q_80
-
-
-
..
-r2=0.77
1200
1600
Figure 2.2 Relationship between planting density (seeds m -2) and camelina seed yield (kg
ha-1). (Johnson, 2011).
Pests
trial. McKenzie et al. (2011) also noted bird damage to Camelina but was also observed to be less than that of brown mustard and oilseed rape. However no actual data was recorded regarding the extent of the losses. Similarly A. Pavlista et al. (2011) noted no bird damage to Camelina but bird damage to both brown musta1·d and oilseed rape. Gugel and Falk (2006) advocated the choice of Camelin a as a crop resistant to insect pests however they found flea beetles but did not feed on the plants in contrast to nearby brassicas. This preference was also confirmed by A. Pavlista et al. (2011). Wysocki and Sirovatka (2008) noted that aphids and cabbage seed pod weevil which both comm:mly affect canola have not been observed to have any affect on Camelina. Berti et al. (2011) also observed cutworms (Agrotis spp.) severely damaging both mustard and canola but did not observe any damage to Camelina.
2.4.4 Diseases
Fasi et al. (2012) observed the presence of Rhizoctonia solani, which was believed to contribute to the significant drop in plant population along with the early bolting of plants. Wysocki and Sirovatka (2008) also noted that Camelina might be susceptible. Gugel and Falk (2006) observed Blackleg disease (Leptosphaeria maculans) on brassicas that were part of the same trial but none was observed on Camelina. Aster yellows disease was observed at <1% on both Camelina and the brassicas in 2001 and 2002 but was observed mainly on Camelina of up to 3% incidences. Berti et al. (2011) also found a susceptibility of Camelina to aster yellows disease. Gugel and Falk (2006} found there was not significant evidence of preference that the leafhopper vector {Macrosteles quadrilineatus) feeds preferentially on Camelina and more research needs to be done. Fleenor (2011) noted that Downy mildew has been observed in Camelina in the Pacific Northwest of the USA. It also noted the Camelina has a susceptibility to sclerotinia stem rot but there has been no reports of major outbreaks.
2.4.5 Weeds
are fall germinating and therefore for later sowing dates can be controlled prior to planting. Russian thistle (Salsa/a iberica) was a significant weed in a Washington experiment and was significantly higher at 24 plants m-2 in late-winter plantings and 6 plants m-2 in spring plantings.
2.4.6 lodging
Solis, Vidal, Paulino, Johnson, and Berti (2013) only found lodging to be a problem at one out of four of the locations they did trials at and only with > 75kgN ha-1 added N. However this
location already had significantly higher nitrogen levels than the other locations. Johnson {2011) visually rated their trial based on the degree of lodging and found that lodging
decreased with increasing sowing rates from 12 seeds m-2 to 800 seeds m-2 and then rising at 1600 seeds m-2• R. Gesch and Cermak (2011) found there was a significant effect of planting method on the occurrences of lodging and chisel ploughed Camelina was more likely to exhibit lodging than no till planted Camelina.
2.4. 7
FertiliserJohnson (2011) found that Camelin a responded positively to increasing nitrogen rates up to 95-116kgN ha-1 before plateauing. Which included the optimum of 100kgN ha-1 suggested by
Josef Zubr (1997). This is very similar to the optimum found by Wysocki and Sirovatka {2008) of 89-lOOkgN ha-1. Solis et al. (2013) found the highest seed yields at 150kgN ha-1 and
300kgN ha-1 depending on location. It is also worth noting that they did not have many
Nitrogen replicates around the optimum and only ran a trial with 0, 75, 150 and 300 kgN
ha-1. However they also found decreasing oil content with increasing nitrogen levels from 43.7%
at OkgN ha-1 added to down to 41.7% at 300kgN ha-1. This indicated that the increase in seed
yield may be countered by decreasing oil content. Solis et al. (2013) also found no effect of nitrogen levels on TSW. Biomass also showed a significant increase to 75kgN ha-1 but
plateaued off after that. The highest harvest index was received without any N applications indicating that N applications may increase the biomass yield more than the seed yield. In Solis et al. {2013) applications over 75kgN ha-1 also increased lodging. McKenzie et al. (2011)
noted that the higher N input of 150kgN ha-1 over 50kgN ha-1 resulted in higher seed yield
to 1650kg ha-1 with lOOkgP ha-1 and 1550 with lOOkgP ha-1 and 40kgS ha-1 added, however
this is likely to be because of current soil fertility levels.
2.4.8 Chemical Applications
Camelina is not tolerant of many herbicides, which can make weed control difficult. Johnson (2011) trialled many different herbicides and found them not suitable, these included; imazamethabenz, fluroxypyr-MCPA, 2,4-D Amine, MCPA Amine, bentazon, bromoxynil, 2,4-D
B, florasulam-MCPA, clopyralid, glufosinate, sulfentrazone, isoxaflutole, imazamox:
imazthapyr 1:1, thifensulfuron : tribenuron, clomazone and dimethanamid. So far Camelina has been found to be tolerant of three herbicides cledthodim, quizalifop-p-ethyl and
sethoxydim. One of these (quizalifop-p-ethyl) is also registered for grassy weed control of Camelina in Canada. Pendimethalin was also found to have 'acceptable levels of injury' but may have trouble getting registered. However as there are few or no registered herbicides for the use on Camelina, Wysocki and Sirovatka (2008) recommends using non-selective herbicides such as glysophate to kill all weeds before planting.
2.4.9 Dual and lntercropping
R. Gesch and Archer (2013) studied the potential for double cropping in the uppe~· Midwest
of the USA and looked at Camelina followed by soybeans, oilseed sunflower or forage millet. The results showed the most effective crop was soybean however the profitability was lower than a mono-crop of soybeans in the first year (approx. 77 to 84%) and slightly higher in the second {99 to 111%). However this would be highly variable depending on changing crop prices.
Akk and llumae (2005) trialled growing peas and Camelina together, there was no economic analysis but there did appear to be advantages from the peas fixing nitrogen and the weed suppression from the Camelina canopy. However the competition appeared to negate the positive impacts, but the experiment did not compare to monocropping and simply ran a dual-cropping trial.
2.4.10 Harvest
of the summer. Fleenor (2011) also recommends harvesting when moisture was 10% or lower, slightly higher than the 8% recommended by Wysocki and Sirovatka (2008) and lower than 11% recommended by Josef Zubr (1997}. Both Fleenor (2011) and Wysocki and
Sirovatka (2008) suggest oilseed rape moisture metre settings can be used for accurate readings. Fleenor (2011) stated Camelina is usually direct-combined but it can be swathed and windrowed after. Wysocki and Sirovatka (2008} stated this may be a good option when there are weed species present such as Russian thistle (Kali tragus). Fleenor (2011) stated when swathing it is recommended to be done when two thirds of the pods turn from green to yellow, and to leave as much stem as possible. Camelina can be harvested on the same settings as oilseed rape or Lucerne seed but the fan speed will need to be reduced due to the low seed weight. Due to the small seed sizes losses of Camelina may be higher than oilseed rape but no research has been conducted on this.
2.5 Conclusions
• Camelina is suited to marginal, low fertility land.
• Camelina does not yield well in wet conditions or in heavy soils and yields best in free draining soils and dry conditions and is drought tolerant.
• Camelina is very sensitive to herbicide applications. ,
• Early spring sowing has proven to have highest seed yields in most conditions
• Autumn sowing has proven to have highest biomass production.
• Camelina has very small seeds, thousand seed weight of 0.8g to 1.8g, this means it needs to be sown shallow and needs a fine seed bed.
• Pests and insects are not a significant problem for Camelina and they often do not feed on them.
3 MATERIALS AND METHODS
3.1 laboratory Experiment
A laboratory experiment was set up in the field service centre at Lincoln University, Lincoln, Canterbury, New Zealand. The experiment was run using th.ree different
Camelina sativa
cultivars; Accession number 4164, Calena and Suneson. Petrie dishes were lined with filter paper, moistened with water and 50 seeds of the relevant cultivar were placed as evenly as possibly on the top of the filter paper. These were then placed in a incubator to control temperature at eight different temperatures {S0c, 10 c, 15°c .. 20 c, 25°c, 30 c, 35°c, 40 c) with 3 replicates. Germination counts were then taken every 12 hours until the germination count plateaued for 3 successive periods. Germination was classed as the radicle or plumule visibly emerged from the testa.
3.l.1 Calculations
To calculate the cardinal temperatures first the rate of germination was calculated. This was doile by calculating the time in days (d) it took to reach 50% of the final germination of the replicate, using a straight-line method between the two points closest to 50% of the final recorded germination. This was then inverted to give the effective amount of the 50% germination achieved in a day (d-1). These figures were then plotted against temperature to
give different cultivar germination rate curves for each temperature. These plots also
allowed for a regression to establish a base temperature from the germination rates at lower temperatures, the number of data points used for the regression varied to maximise r2 value
for each replicate. The same process was done with the highest temperatures to find maximum temperature. Optimum temperature was taken to be the temperature where maximum germination rate was achieved.
3.2 Field Experiment
3.2.1 locations and Site History
Research, 2013). Full descriptions given by Riddell (1979}. The shallow Lismore stony silt loam is well drained with 60-89mm of total available water per metre of soil and a depth to hard soil of 200-450mm(Landcare Research, 2013}.
The experimental site was sown into a white clover and perennial ryegrass pasture mix in 2010 and grazed in rotation with the rest of the farm until May 2013. The trial area was prepared with Roundup (a.i. 360 g/I glyphosate) at 21/ha and Accelerate (a.i. Organo silicone) surfactant at 100 ml/100 I.
3.2.2 Experimental Design
The experiment was set up in a split plot design with sowing date (21 August, 13 September and 3 October) as the main plot and sowing rate (2, 4 or 6 kg/ha) and plant growth
regulators (with or without) making up the plot splits. The plant growth regulator was Cycocel® (a.i. 11.8% chlormequat (2-chlorethyl) trimethylammonium chloride) and was applied at 11/ha on 21 October, 31 October and 12 November for the August, September and October sowings respectively. The plots were 23m long and each split being llm long and all plots being 4.2m wide.
3.2.3 Sowing and Establishment
The plots were sown using an Oyjord cone seeder (coulter spacing 15 cm) from south to north, with sowing depths approximately 1- 1.5 cm. The Camelina sativa seeds used for this experiment were Calena and they were treated with Gaucho® at 12 ml/kg and Vitaflo® fungicide at 1 ml/400 g (a.i. 200 g/I carboxin and 200 g/I thiram and 50 g/I ethylene glycol}. A post sow herbicide (Roundup a.i. 360 g/I glyphosate at 21/ha and Magister® a.i. 480 g/L clomazone at 0.3 I/ha) was applied after or within 24 hours of sowing.
3.2.4 Agrichemical Use
3.2.5 Soil fertility
Soil samples to 15 cm depth were taken on 29 May sowing for a quick MAF soil test and results are shown in Table 3.1
Plant N samples were taken at GS30 (start of stem elongation), these were analysed by ground in a mill to pass through a 1 mm stainless steel sieve (Cyclotec Mill, USA). Near infrared spectroscopy (NIR) was used to determine crude protein after a cross calibration was generated between NIR measurements and wet chemistry techniques (Lincoln University Analytical Laboratory Unit). Crude protein was divided by 6.25 to get N%.
Table 3.1 MAF quick soil test results for Ashley Dene to 15 cm depth.
Soil Fertility
Season pH Olsen P Ca Mg K Na
s
2013-14 5.8 20 8.0 0.86 0.88 0.09 10
Note: Soil test Units Olsen P (mg/L), Ca (me/100g), Mg (me/lOOg), K (me/lOOg), Na (me/lOOg), S (mg/kg)
Table 3.2 Available soil nitrogen (kg/ha) at different depths for Ashley Dene and Plant nitrogen
at GS30.
Depth (cm) 2013-14
0-15 167
15-30 77
3.2.6 Measurements
Emergence was measured (where 5 sets of lm drill rows were counted per plot) for the August sown plots up to 50 days after sowing and up to 40 days for the September sowing and 26 days after the October sowing. Emergence measurements ceased once plant
population in the field became difficult to measure due to plant size and were subsequently recorded at 50% flower and final harvest. Growth stage was measured every 4-14 days after emergence measurements ceased.
At 50% flower plants were harvested from each sub plot by hand using secateurs and
quadrats (0.4m2/subplot). Plants were counted for each sample and a subsample of 5 plants was measured for height and growth stage. Samples were dissected into sown and weed components before being dried in an oven at 65 °C to a constant weight.
At final harvest 0.4 m2/subplot were harvested, plants were counted and a subsample of 10
plants was measured for height, secondary branching and harvest index. The 10 plants and the remainder of the sample were used to determine total dry matter. Plant samples at final harvest were hung to dry in a warm room until the sample weight was considered constant. Harvest index samples were threshed and cleaned by hand. Plots were harvested by a Winterseiger header (1.5 - 1.6m width). Seed moisture was measured immediately after harvesting at Lincoln University, seed moisture was considered high at heading due to green weed seed contamination, mainly fathen (Chenopodium album). Headed subsamples were further cleaned via a Kamas Westrup seed cleaner once seed was considered dry enough to flow through seed cleaner. Seed weight and weed contamination were measured after seed cleaning. The weed contamination was 0.3 - 23.4% and if samples had a weed
contamination of >5%, then they were re-cleaned before seed press. The seed yield was adjusted for seed moisture content determined at seed press.
Oils were extracted by cold pressing using a Komet screw press (screw speed 1.5, choke size 4 mm head temperature 80 °C). The cold pressed oil yield was determined after the crude oil was centrifuged and filtered through a 1 µfilter.
3.3 Meteorological data
Mean monthly air temperature, total monthly rainfall data, minimum and maximum daily temperatures were all collected from the nearby Broadfields meteorological station (43°62'5, 172°47'E).
The rainfall data for the experiment period was very volatile compared to long term means with an extreme rainfall event occurring in June that caused a delay of sowing and a very wet soil profile. As well as a particularly dry November and January period (Figure 3.1).
The temperatu1'e data for the experiment was within normal ranges of the long term mean (Figure 3.1).
3.4 Thermal time
Thermal time was calculated from the meteorological data and the equation GDD=l:[(T Max+ T Min)/2]- T Base sourced from McMaster and Wilhelm {1997). Where GDD =Growing Degree Days (°C d), l:=Sum of, T Max= maximum daily temperature, T Min= minimum daily temperature and Tbase=the relevant base temperature for the crop. The base temperature established from laboratory experiments was used as the base temperature.
3.5 Statisti<:al Analysis
18 (a}
16
14
-
12 0 0.._
Q) 10
'-:::;
...
ro '-Q) B0..
E
Q)E
I-4
2
0
Apr May June July Aug Sept Oct Nov Dec Jan Feb Mar
200
-
E E 150ro <+-c ro
Ci::'.
ro 100
-
0
I-50
Apr May June July Aug Sept Oct Nov Dec Jan Feb Mar Month
Figure 3.1 The bars are (a) mean monthly temperature (°C) and {b) total monthly rainfall
4 RESULTS
4.1 Determination of Cardinal temperatures
To determine the minimum, maximum and optimum temperature of C.
sativa,
germination tests were run on a range of temperatures at S°C intervals from S°C to 40°C. All cultivars reached over 90% germination for temperatures S°C -30°C, with 3S°C only reaching 37% for Suneson after 4.5 days and S2% for Calena and 4164 after 2.S days with no germination occurring at 40°C. Temperatures 20°C, 2S°C and 30°C were the fastest to germinate,Suneson and 4164 achieved 90% germination in 3 days while Calena did in 2.S days. At lS°C, 90% germination was achieved O.S days later across all cultivars. At S°C and l0°C slightly slower germination curves are present but are delayed and do not begin until 2.S and S.S days respectively for Suneson and Calena and 2.5 and 6.S days respectively for 4164 (Figure. 4.1).
120 120 100 80 60 40 20 100 80 60 40 20
0 2 4
0
0
~~+--+~·
F;r
..
o.:~/
0.,Jr
.
tl1
/
l/1 / o--a-o
/'181
/
cf'···
111
!
d/f
ff
/ /
0I /;
l
PI /; I /
. ! ,,fl
2 4
--¥~+--.·---+
~·.- / .
~/.· / /"' 0
I·*
r
0t /
0I/: I
I I
•1.
I I I..
H
--0 -ClI
I
I!
/.
11,
/
0-dfrjl 1 I
I I I
,1
/?
!/
cfl IIf I I 1 0
t
/
I2 4
6
Q .. 0 0
6
O· 0 o·
6
Days (d)
(a)
8 10
(b)
8 10
(c)
8 10
The time taken to 50% germination (days) was calculated from germination trials for all
three cultivars (Figure. 4.1) and this was used to show the rate of germination (days-1). From
5°C to 15°C cultivar 4164 has a significantly lower germination rate, but at 20°C and 25°C the rate was the same as Suneson, as Suneson began to plateau to a maximum of 0. 79 d-1
between 25°C and 30°C. In contrast 4164 increased to peak at an average rate of 1.06 d-1 at
30°C the same as Calena which maintained a significantly higher germination rate than 4164
peaking at 1.24 d-1. All cultivars significantly decreased in germination rate at higher than
35°C. No cultivars germinated at 40°C.
1.4
1.2
~ 1.0
'
-0
--
... Q)rn
0.8a::
c0 :;::::; 0.6
rn
c.E
'-Q)(.9 0.4
0.2
0.0
0 10
0 0 0
i
20Temperature (°C)
0 0'
•
• •
30 l!J Ti
•
40Figure 4.2 Rate to 50% germination (d-1) of Camelina sativa under eight different
temperatures for three different cultivars, Suneson ( •), Calena (;), and 4164 ('.- ).
A linear regression was plotted against the lower temperature germination rates and used to
calculated base temperatures with highest linear r2 value for each cultivar (first four values
for Suneson, first six values for Calena and 4164). There was no significant difference
between cultivars for base temperature (P=0.35). The base temperatures were therefore
The temperature the recorded the highest growth rate (maximum) for each replicate was regarded as the optimum. These optimum temperatures showed no significant difference across cultivars (P=0.08). Therefore all optimum temperatures were averaged to give an optimal growth temperature of 28.89 ± 1.35°C
Similar to the minimum temperature, a linear regression was plotted against the highest temperature rates to calculate a maximum temperatures from the trend line with highest linear r2 value. There was no significant difference (P=0.12) between the maximum
4.2 Field Experiment
For different sowing rates there was no significant difference in the maximum emergence count. However for the final counts across the all sowing rates there is no significant difference between the first and second sowing dates but the third sowing date is
significantly higher than the others. This is also reflected in the percentage survival where the third sowing date is significantly higher than all others sowing dates at 97% or higher across all rates, yet the highest survival for the other sowing dates was 56%, with at 2kg ha-1
sowing date 1 and 2 being insignificantly different and for 4 and 6kg ha-1 being significantly
higher at sowing date 2.
The maximum (P<.001) and final (P<.001) emergence counts were significantly different across sowing rates and increased with increasing sowing rate.
Table 4.1 Average maximum germination count, average final emergence count and
average survival from maximum to final count (%) under 3 different sowing rate treatments: 2kg ha-1, 4kg ha-1 and 6kg ha-1 and 3 different sowing date
treatments: 21st August 2013, 13th September 2013 and 3rd October 2013 from weekly field measurements at Ashley Dene, Canterbury, New Zealand taken from sowing until 50, 40 and 26 days after sowing respectively.
Sowing Rate Sowing Maximum Final Germination Survival (kg ha-1) Date Germination Count Count (%)
2 21/08/2013 12.9 4.8 37
13/09/2013 13.3 4.9 37
3/10/2013 16 15.6 96
LSD NS 2 9.3
4 21/08/2013 27 7.6 28
13/09/2013 23 12.5 55.5
3/10/2013 33.9 33 97
LSD NS 5.7 16
6 21/08/2013 37.4 11.3 31
13/09/2013 36.8 16 44
3/10/2013 45.5 44 97
LSD NS 6.7 6.9
At 50% flowering sowing date 3 had significantly (p=.007) less weeds than sowing date 1 and
2 with 261kgDM/ha compared to 484kgDM/ha and 480kgDM/ha respectively. The lowest sowing rate 2kg ha-1 also had significantly (p=.002) more weeds at SSkgDM/ha compared to
395 kgDM/ha and 255kgDM/ha for 4kg ha-1 and 6kg ha-1 respectively.
At harvest sowing date 1 had significantly (p=0.009} taller plants at 47cm compared to sowing dates 2 and 3 with 41.4cm and 42.4cm tall respectively.
Table 4.2 Average Camelina height (cm), total biomass (kgDM 1) and seed yield (kg
ha-1) under 2 different plant growth regulator rates 0 L ha-1, 1 L ha-1 from
measurements taken at final harvest which occurred on 15th January 2014 for sowing date 1 and 28th January for sowing date 2 and 3 at Ashley Dene, Canterbury, New Zealand.
Plant Growth Regulator Cycocel®
Height (cm)
0 L ha-1 55.68
1 L ha-1 52.97
LSD 2.65
Total Biomass 3697 3864 NS 923 915 NS Seed Yield
NS not significant. LSD values are for significant factors at 0.05 significance.
The amount of secondary branches formed was significantly (P<.001) greater for sowing date one and two with an average of 6.25 and 5.44 compared to 3.82 for the third sowing date. The sowing rate was also significant (P<.001) with 4~g ha-1 and 6kg ha-1 with 4.71 and 4.05
secondary braches per plant compared to 6.67 for 2kg ha-1.
Table 4.3 Camelina plant nitrogen levels (%) across 3 different sowing date treatments:
21st August 2013, 13th September 2013 and 3rd October 2013, Taken from field trials at growth stage 30 at Ashley Dene, Canterbury, New Zealand.
Table 4.4 Average Camelina plant density (plants m-2), Camelina total biomass (kgDM ha-1),
Seed Yield (kg ha-1), harvest index and thousand seed weight (g) under 3 different sowing rate treatments: 2kg ha-1, 4kg ha-1 and 6kg ha-1 and 3 different
sowing date treatments: 21st August 2013, 13th September 2013 and 3rd October 2013 and their interaction, measurements taken at final harvest which occurred on 15th January 2014 for sowing date 1 and 28th January for sowing date 2 and 3 at Ashley Dene, Canterbury, New Zealand.
Density Total Seed Harvest TSW (plants Biomass Yield Index (g)
m-2) (kgDM (kg ha-1)
ha-1)
Sowing 21/08/2013 98 4171 883 33.9 1.261 Date
13/09/2013 126.9 3252 577 36.5 1.314 3/10/2013 300.7 3786 1211 42.1 1.446 LSD 41.59 553.5 117.2 3.7 0.0291 Sowing 2 104.2 3669 744 37.2 1.34
Rate 4 183.6 3659 945 37.4 1.35
(kg ha-1) 6 251 4014 1068 38.1 1.34 LSD 37.62 NS 106.1 NS NS Sowing 21/08/2013 2 64.4 3916 638 32.8 1.19 Date x 4 102.8 4226 897 34.5 1.29 Sowing 6 126.9 4372 1115 34.5 1.31 Rate 13/09/2013 2 66.7 2843 397 39.3 1.4 (kg ha-1) 4 131.2 3036 554 33.9 1.29
As Table 4.4 shows density is significantly different across both sowing date (p<.001) and sowing rate (p<.001) as well as the interaction of both (p=.002). Density increased
significantly at later sowing dates from 98 plants m-2 to 126.9 plants m-2 to 300. 7 plants m-2 respectively. Density also increased with sowing rate from 104 plants m-2 at 2kg ha-1 to 183.6
plants m-2 at 4kg ha-1 to 251 plants m-2 at 6kg ha-1.
Total Biomass produced was significantly different for sowing date (p=.004) but not for sowing rate (p=.2777). Sowing date one had the highest biomass with 4171kgDM ha-1, with sowing date two having lowest biomass at 3252kgDM ha-1 and sowing date three having
3786kgDM ha-1.
Total seed yield is significant for both sowing date (p<.001) and sowing rate (p<.001). Sowing date 3 is the largest with 1211kgDM ha-1 followed by sowing date 3 with 883kg ha-1 and
again with the lowest value sowing date 2 with 577kgDM ha-1. For sowing rate seed yield significantly increases with sowing rate with 744kgDM ha-1, 945kgDM ha-1 and 1068kgDM
ha-1 for 2kg ha-1, 4kg ha-1 and 6kg ha-1 sowing rates respectively.
Harvest index shows the proportion of the plant that is the desired harvestable product, in this case it is only significant for sowing date (p<0.001) with both sowing date one and two on 33.92% and 36.48% being significantly lower than sowing date three on 38.09%.
TSW is significantly different across sowing dates with seed weight increasing with later sowing dates from 1.261 to 1.413 to 1.446 for sowing dates 1, 2 and 3 respectively.
There was also a significantly different (P<.001) number of seeds per hectare with sowing date three having 840,000, sowing date one having 700,000 and sowing date two having 450,000 seeds, nearly half as many as sowing date 3.
Seed moisture content was significantly (P<0.001) higher for the first sowing date on 8.2% than sowing date 2 and 3 on 7.75% and 7.4% respectively.