THE APPLICATION OF EXPERT SYSTEM
METHODOLOGY TO FEED MANAGEMENT
P L Nuthall
*
G
J Bishop-Hurley
**
*
ReaderDepartment of Farm Management
**
Research OfficerDepartment of Farm Management
Research Report No.229
October 1994
Agribusiness & Economics Research Unit PO Box 84
Lincoln University CANTERBURY
AGRIBUSINESS & ECONOMICS RESEARCH UNIT
The Agribusiness and Economics Research Unit (AERU) operates from Lincoln University providing research expertise for a wide range of organisations concerned with production, processing, distribution finance and marketing.
The AERU operates as a semi-commercial research agency. Research contracts are carried out for clients on a commercial basis and University research is supported by AERT.,J through sponsorship of postgraduate research programmes.. Research clients include Government Departments, both within New Zealand and from other countries, international agencies, New Zealand companies and organisations, individuals and farmers. Research results are presented through private client reports, where this is required, and through the publication system operated by the AERU. Two publication series are supported: Research Reports and Discussion Papers.
The AERU operates as a research co-ordinating body for the Department of Economics and Marketing, Department of Farm and Horticultural Management and the Department of Accounting and Valuation. This means that a total staff of approximately 50 professional
AERU MANAGEMENT COMMITTEE 1994
Professor AC Bywater, B.Sc., Ph.D.) (Professor ofFann Management)
Professor A C Zwart, B.Agr.Sc., M.Sc., Ph.D. (Professor of Marketing)
AERU STAFF 1994
Director
Professor A C Zwart, B.Agr.Sc., M.Sc., Ph.D. Senior Research Officer
J R Fairweather, B.Agr.Sc., B.A, Ph.D. Research Officer
G Greer, B.Agr.Sc. (HOllS)
people is potentially available to work on research projects. A wide diversity of expertise is therefore available for the AERU.
The major research areas supported by the AERU include trade policy, marketing (both institutional and consumer), accounting, finance, management, agricultural economics and rural sociology. In addition to the research activities, the AERU supports conferences and seminars on topical issues and AERU staff are involved in a wide range of professional and University related extension activities.
Founded as the Agricultural Economics Research Unit in 1962 from an annual grant provided by the Department of Scientific and Industrial Research (DSIR), the AERU has grown to become an independent, major source of business and economic research expertise. DSIR funding was discontinued in 1986 and from April 1987, in recognition of the development of a wider research activity in the agribusiness sector, the name of the organisation was changed to the Agribusiness and Economics Research
Contents
LIST OF TABLES
LIST OF FIGURES
PREFACE
ACKNOWLEDGEMENTS
CHAPTER 1 INTRODUCTION
CHAPTER 2 BACKGROUND TO THE SYSTEMS
2.1 Expert Systems as Decision Tools
2.2 Developing the Feed Management Systems
CHAPTER 3 DETAILS OF THE TRIAL SYSTEMS
3.1 Introduction
3.2 The Weaning Systems Developed for the Field Expert Trials
3.3 The Results of the Field Experts Trial 3.4 Details of the Presentation Aspects of the Systems Developed for Farm Use
CHAPTER 4 DETAILS OF THE FARMER RESPONDENTS
4.1 Introduction
4.2 Characteristics of the Farms and Farmers
Page
(i) (iii)
(v)
(vii)
1
5
5 8
11
11
11 20
26
41
Contents
(continued)
Page
CHAPTER
5
THE FARMERS' OPINIONS OF THE EXPERT SYSTEMS49
5.1
Introduction49
5.2
A Comparison of the Weaning Systems49
5.3
Farmers' Attitudes to the Ease of Use andthe Appearance and Layout of the Systems
51
5.4
Farmers' Attitudes to the Presentation,Help and Guidance Provided
52
5.5
Farmers' Attitudes to the Advice andExplanation Provided
55
5.6
Farmers' Attitudes to the Use and Valueof Expert Systems
59
5.7
Comments Offered by the Farmers68
CHAPTER
6
DISCUSSION AND SUMMARY69
REFERENCES
74
APPENDIX 1 Weaning Expert Questionnaire Used for Field
Experts' Comments on Alternative Systems
77
APPENDIX
2
Weaning Expert Questionnaire for Field Experts'Computer Experience and System Ratings
80
APPENDIX
3
Personality Test Used for the Field Experts 84APPENDIX
4
Farm and Farmer Details Questionnaire88
APPENDIX
5
Questionnaire Used to Obtain the Farmers' ViewsList of Tables
Page
1
Field Experts' Computer Use and Self Rated Computer Skills20
2
Field Experts' Scoring of the Four Trial Systems With Respect toVarious Presentation and Assistance Attributes
21
3
Field Experts' Ranking of the Four Trial Systems With Respect toVarious Presentation Attributes-
22
4
The Personality Features of the Field Experts 245
Farm Area Distribution42
6
The Stock Unit Distribution42
7
The Farmers' Age Distribution43
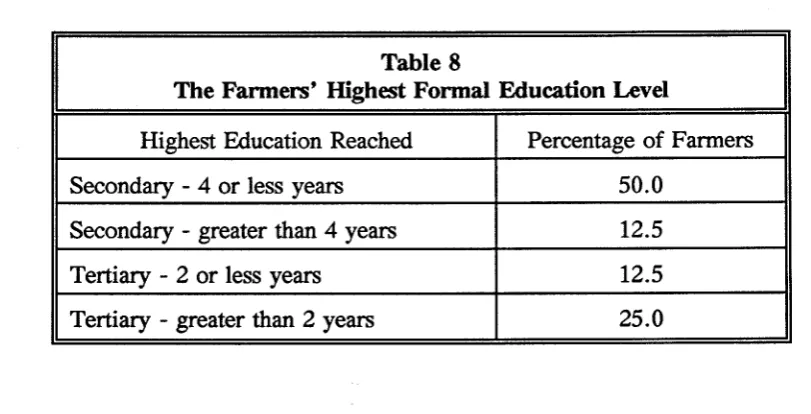
8
The Farmers' Highest Formal Education Level43
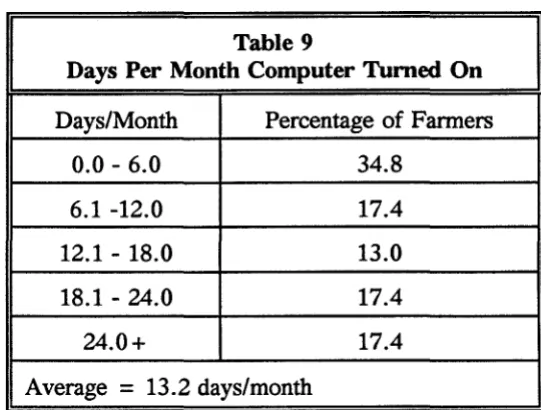
9
Days Per Month Computer Turned On 4410
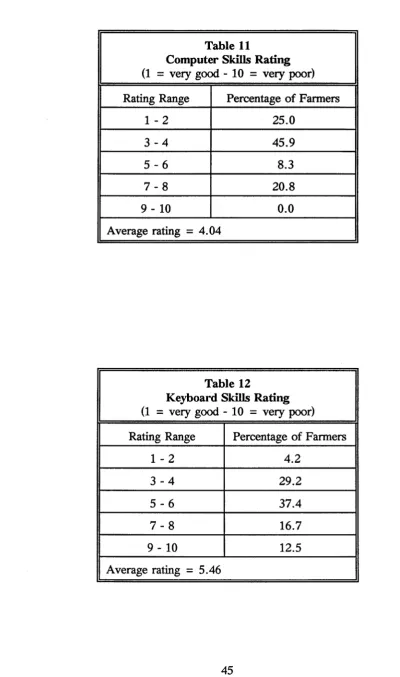
Hours Per Week Spent on a Computer 4411 Computer Skills Rating
45
12
Keyboard Skills Rating45
13 Frequency of Using a Mouse Ratings
46
14
Frequency of Using Graphical User Interface Ratings 4615
The Farmers' Personality Types47
16
The Farmers' Ranking of Wean One, Two and Three49
17
Comparison of Wean One, Two and Three(Ease
of Use, Appearanceand Layout, Advice Given)
50
18
Comparison of Wean One, Two and Three (Explanation Method,System 'Helps', Printout Importance)
50
19
Farmers' Scoring of theEase
of Use and the Appearance andList of Tables
(continued)
22
Fanners' Scoring of the Help and Guidance Provided, andthe Need for Printouts for Wean, Drench and Surplus.
55
23
Fanners' Agreement of the Advice and Explanations56
24 Fanners' Scoring of the Advice and Explanations Provided
in Wean, Drench and Surplus
56
25
Fanners' View on Whether the Advice Should be a Simple·1res/No Answer
57
26
Fanners' Comments on Various Questions About theExplanations Provided
58
27
Fanners' Views on the Frequency of Using Wean59
28
Fanners' Views on the Frequency With Which a TypicalFanner Would Use Wean, Drench and Surplus Over One 1rear
60
29
Fanners' Views on Whether the System Would Provide A Season Beginning Check, A Regular Reminder and Improved Ease ofDecision Making
60
30
Probability of a Fanner Believing an Expert System Would beUsed as a Beginning of Season Reminder
62
31
Probability of a Fanner Believing an Expert System Would be Used as a Regular Reminder of the Important Factors in aDecision
63
32
Probability of a Fanner Believing an Expert SystemWould Make a Decision Easier 64
33
Respondent's Belief in Various Economic Value Categoriesfor Wean, Drench and Surplus
65
34
Respondent's Belief in the Monetary Value of Wean,Drench and Surplus on a Per Ewe Basis
66
35
Fanners' Views on Whether Expert Systems Have Potentialin Agricultural Decision Making
67
List of Figures
Page
1
Experimental Weaning System One - Introduction and Data Entry12
2
Experimental Weaning System One - Data Entry and Result Presentation 133
Experimental Weaning System One - Explanation of a Conclusion,and Options Available Following a Consultation
14
4
Experimental Weaning Systems - Introductory Screen Systems Two,Three and Four
15
5
Experimental Weaning Systems - Data Entry Systems Two and Three16
6
Experimental Weaning Systems - Results, Systems Two, Three and Four17
7
Experimental Weaning Systems - Data Entry for System Three18
8
Experimental Weaning Systems - Instructions for SystemsTwo, Three and Four
19
9
Experimental Weaning Systems - System Four Data Entry19
10
Screen Excerpts from Wean One - Designed for Farmer Use28
11 Screen Excerpts from Wean Two - Designed for Farmer Use
33
12
Screen Excerpts from Wean Three - Designed for Farmer Use35
13 Screen Excerpts from Drench - Designed for Farmer Use
36
Preface
Computers are becoming an increasing part of the range of tools available to farmers in carrying out their farm management activities. However, there is a range of utilisation of computers within the farming sector. This Research Report provides an application which farmers would find of value in assisting with decision regarding feed conservation and feed surplus utilisation. Earlier publications in this Series present systems applicable to drenching decisions and weaning and a farmer evaluation of the use of the type of computer assistance.
This final publication in the series incorporates many of the developments described in earlier reports. This successful research subject has collected information from producers and developed computer based support systems which can provide valuable assistance in decision making.
Acknowledgements
We are grateful to all the fanners who took the time to complete the rather demanding experimentation and questionnaire answering processes. Without their co-operation the study would not have been possible. We hope the result of this work will be of benefit to them, and to the farmers of New Zealand.
We are also grateful to all the 'experts' who assisted with the project. Without their input the study would have been impossible. Those assisting included P. Beatson, E. Burtt, D. Elvidge, A. Familton, P. Fleming, G. Frengley, P. Gaul, N. Gow, R. McFarlane, J. Oliver, R. Plank, A. Spiers, K. Thompson and A. Whatman.
We would also like to express our appreciation to the people who typed and prepared the manuscript for publication (Mrs Judy Derby, Mrs Jan Clark and Miss Helen Clarke).
CHAPTER ONE
INTRODUCTION
The efficient production of animal feed and its utilisation is a vital component of the New Zealand economy. Pastoral products constitute some 72% of land based primary production exports which in turn make up 63% of all exports. This leaves pastoral products at 45% of all exports (Nuthall and Bishop-Hurley, 1994). Furthermore, it would appear from per hectare pasture production figures relative to animal numbers carried that greater efficiency is possible (Nuthall and Bishop-Hurley, 1994). This means either greater exports from the same resources, or a decrease in the inputs necessary to achieve a similar output, are possible.
Improving efficiency can result from greater physical production through better technology (for example, better cultivars, better fertilization policy, a better understanding of disease symptoms and so on), or through better utilisation (management) of what is produced. This study is concerned with the latter aspect of efficiency.
The majority of farmers make feed management decisions (when to shift stock, how much fodder to conserve, when to feed hay, and how much to feed, when to purchase additional animals, when to wean, how many animals to have grazing an area ... ) without any kind of formal analysis. That is, they rely on experience and hunches. This occurs despite the availability of simple management assistance techniques such as formal feed budgeting (calculating the period by period supply and demand for feed and subsequent adjustments to ensure demand does not exceed supply) through to quite complex planning utilities like linear programming and systems simulation. Effectively contemporary research and development scientists have not yet as yet succeeded in producing acceptable models. Part of the problem, no doubt, is the lack of appropriate computer power and the associated software. Currently some 19% of New Zealand farmers have a business computer (Nuthall and Bishop-Hurley, 1994), and some 21% maintain they use formal feed budgeting.
Another reason for not using formal analyses could be that currently available feed management techniques are too complex and time consuming to implement relative to the perceived gains. If systems that are rather more 'user friendly' were available, farmers might well find them acceptable. One such technique that many regard as having promise is a branch of artificial intelligence called 'expert systems'. Bramer (1986) defines such a system as:
, A computing system which consists of organised human knowledge concerning some specific area of expertise sufficient to perform as a skilful and cost effective consultant' .
Their decision and recommendation is based on stored knowledge built up through experience and consists of many IF-TIffiN rules (rules of thumb). An expert system, then, is a package which contains all this knowledge (rules) and can mimic the expert.
The study reported in this bulletin involves the evaluation of three feed management expert systems. The objective was to test the hypothesis that an appropriate expert system will provide practical on farm guidance to farm managers. An equally important objective was to actually develop some expert systems capable of use by farmers. Clearly, the two objectives go hand in hand.
Around the calendar whole farm feed management involves large numbers of problem areas and decisions. This complexity means it was necessary to select components of the total problem for development into suitable expert systems. Based on farmers' common problems (Nuthall and Bishop-Hurley, 1994) and an objective of exploring different types of systems, expert systems were developed for the three problem areas of lamb weaning decisions, deciding whether to drench a mob of ewes and lambs, and for the decision on how to utilise surplus pasture production. A full description of each of these expert systems is given in Bishop-Hurley and Nuthall, (1994 (a), (b) and (c». The drenching problem is a very specific and focused problem that involves diagnostic conclusions, whereas the weaning and swplus pasture problems are more general, though the weaning problem is to a certain extent specific in that the choice is to either wean or wait a while longer. Deciding whether a swplus exists, and if so, what to do with it involves considering many more options (conserve, sell, buy more stock, leave in-situ) and is therefore at the other end of the scale in terms of potential complexity. The choice of these systems meant the farmers were exposed to a full range of possibilities. Having developed and tested the systems, they were sent to a sample of farmers who were asked to experiment and use the systems prior to recording their use and views of the systems. These responses form the basis of this report and evaluation.
The interface of any computer system is likely to affect its acceptance and use. Questions such as 'does the user want to be able to easily move forward and backwards through the system to enable review and changes?, is it better to input data through the Keyboard or through the use of a mouse?, can summary data be requested (e.g. current level of stored dry matter), or is it better to request the components of summary data (paddock by paddock pasture heights and densities) and from this calculate the data required' all need to be addressed. The list of unknowns is quite extensive - this study provides answers to some of these design factors. Other questions of relevance include deciding on the appropriate form and length of decision explanations, the best way to present a conclusion, whether providing graphic and photographic representations of choices are useful, and so on.
There is a wide range of views of what constitutes personality and how it can be described. Similarly, the business of quantifying a personality has always been the subject of considerable discussion and research. For the purpose of this study personality has been (character and temperament) defmed according to Keirsey and Bates (1984) who provide a series of questions that can be used to elucidate an individual's categorization. Keirsey and Bates draw upon the work of several psychologists, but more particularly Myers (1962) and Jung (1923). According to these workers, individuals can be classified through considering four continuous parameters extroversion/introversion, sensation/intuitiveness, thinking/feeling and judging/receiving. The extroversion/introversion parameter is largely self explanatory, 'sensibles' rely on experience and facts whereas the intuitive person relies on hunches and imagination. Individuals can be classed, therefore, into being either extroverts or introverts, and either sensate or intuitive. In reality of course, there is a full spectrum between the extremes. Thinking people are defmed as being logical and objective whereas at the other end of this category, 'feeling' people make decisions based on emotion. Finally, 'judging' personalities make decisions quickly, deadlines are important to them and 'work before play' tends to be a maxim. In contrast, 'perceivers' keep their options open and feel uncomfortable if they have to make decisions before they are ready to do so.
Keirsey and Bates provide a battery of seventy questions, the answers to which enable classification of a subject into one of the sixteen basic personality types made up of the combinations of extroversion (E), introversion (I), sensation (S) or intuitive (N), thinking (T) or feeling (F) and judging(J) or perceiving (P). Two examples of the questions are 'are you more inclined to be easy to approach or somewhat reserved?', and 'are you drawn more to fundamentals or overtones?' The answer to each gives a mark towards one of the types. If there are more positive extrovert answers than introvert ones the individual is classified as extrovert. On the other hand, if the number are equal then the person is neutral so that the number of categories is in fact greater than sixteen. This approach, however, is a simplification as there is more than likely an wmite number of personalities.
The hypothesis proposed is that farmers' attitude to computer systems, their preferences and their views on expert systems could well be influenced by their character type. For example, introverts may be content to use packages that are long and involved, sensates may not accept computer based conclusions as they lack the imagination to conceive of how a software package can assist in their very practical problem. Judging people, on the other hand, may be quite happy to use a computer system as it assists them to make a quick decision, whereas feeling people might be quite the opposite as the computer package may appear to take too much of a clinical approach. This study, then, was also set up to explore whether personality was in fact relevant in assessing expert system packages and their value and use.
CHAPTER TWO
BACKGROUND TO THE SYSTEMS
2.1
Expert Systems as Decision Tools
The concept of a computer based expert system has been in existence for many years. Many agricultural systems have been developed. Despite this, very few have been extensively evaluated and few, if any, appear to have been used by farmers for any length of time. The process of creating an expert system is very simple in theory, but very much more difficult in practice for a number of reasons including the fact that very few experts can actually unambiguously describe the procedures and rules they use and, where they can approach this state, there are often such a large number of rules and 'ifs and buts' that the computer package necessary to encapsulate their procedure is often very complex.
Developing an expert system involves defining the bounds of the problem, isolating suitable experts, formalizing their knowledge and decision procedures, encapsulating this in, usually, a computer package and, fmally, validating the system. Many books have been written describing this system. In the farm management area Evans, Mondor and Flaten (1989) have produced a useful synopsis. In the end expert systems take many different forms as most problems are unique. Furthermore, different workers have a range of views of the best way to construct a system. Batchelor, McLendon and Wetzstein (1992), for example, compare and contrast two approaches to knowledge acquisition. One approach might be to find out the exact thought process an expert follows and then to mimic these, another might consider the end results and not be so concerned with exact mimicry. In that expert system development is not an exact science there will be a constant discussion on the best approach.
The types of agricultural problems that have been developed with expert systems are many and varied and range from purely fmancial analysis through to technical advice systems. Examples are McGrann, Karkosh and Osborne's (1989) system which proffers advice on whether a banker should lend to a farmer (based on past profitability and current indebtedness), Oltjen et al's (1990) package for deciding whether a particular cow should be culled (based on the expected value of each cow and various culling rules involving health, condition score and so on), and McGregor and Thorton's (1990) winter wheat cultivar selection package which enables a farmer to sort out an appropriate cultivar for specific fields.
some of the subtleties necessary in designing a successful crop rotation whereas there are no such strictures on an expert system. Indeed, whatever is appropriate and used by the experts as guidelines can be built in.
In Nero and Amir's case they defme and use what they call crop suitability factors. Furthermore, there is nothing to stop multi-faceted systems being developed and one such example is provided by Nevo, Oad and Podmore (1994) in which linear programming is combined with a traditional expert system to create an integrated crop planning system. Closer to the feed management problem Grayet al (1992) developed a dairy cow drying off expert system based on the more traditional IF-THEN rule system. Many more examples could be quoted of systems that have been reported in the literature. Those quoted, however, do indicate the range of work that has been undertaken. As a rule the reports talk about development and validation, but seldom about farmer use and experience.
With respect to feed planning and grazing management there have been only one or two systems developed. Gray et al, as noted above, worked on the cow drying off problem and this clearly has an important feeding component. Most feed planning work has concerned feed budgeting and associated models. Examples include Durham and Nieuwoudt (1982), Baars and Rollo (1987) Baars (1990), Nicol (1987), and Lodge and Frecker (1990). This latter work is termed an expert system but in reality it is an automated feed supply and demand calculator. Effectively, there is considerable scope for developing feed management systems for use in grazing situations. The work described in this Report is a step in this direction.
Formulating and committing to paper an expert's knowledge (knowledge acquisition) is, as noted earlier, the central and key component of developing an expert system. Furthermore, it is the most difficult component. Many authors have written in this area. Spangler et al (1989) is one such example and generally reviews the major approaches possible. In the end the knowledge acquisition must be regarded as much an art as a methodical and scientific procedure. One approach, however, that often seems to be ignored is the collation, integration and use of research results. While an expert should clearly build research results into their expertise, it is also possible to bypass the expert and use the published results in formulating rules in cases where the research provides a complete and logical answer. In this current work the case of drenching for internal parasites is an example. Essentially the rule set evolved from published work rather than experts, though they were used for checking purposes.
outlining their approach to validating a sow-herd perfonnance expert system, talk about some of the difficulties in evaluating a system that does not have an objective yardstick. In many cases the experts cannot agree on all aspects.
Thus, while every effort must be made to ensure experts agree with an expert systems' conclusion, in the end it is the fanner that must decide whether an expert system is useful. It is this approach that has been taken in this study. The procedure used did not involve an extensive fonnal validation, but rather an heuristic process of working with a range of experts to ensure they accepted the basis of the systems. Once this point was reached, the packages were given to the farmers for assessment. It must also be noted that for anyone problem there may be in fact a range of equally acceptable solutions even given a single objective. This is why, in some cases, experts will provide different answers that the majority of farmers might be indifferent between, or at least only distinguish between them on minor points and factors.
Acceptability to farmers probably depends on a number of factors including the efficacy of the results. Some of these factors will be the ease of use, the way in which the questions are presented, the degree and type of assistance and help provided, and so on. All these presentation factors can be collectively called the interface and provide as much of a challenge to the developer as the knowledge base itself.
A number of authors have produced articles on creating a good interface, but most of these have been personal views, even if based on years of experience. Few objective studies have been reported, though again it might be argued that the users have clearly indicated their preference through the types of software purchased and actually used. Furthennore, most commercial packages undergo extensive field testing over which time the testers provide strongly worded suggestions - again the development process is heuristic.
Indeed, most articles stress the need for the potential users to be a key component of any design and development procedure. Gould and Lewis (1985) for example talk about the 'early and continual focus on users' (p 300). Similarly, Morland (1983) stresses that systems should be designed 'for the people'. In another article Gould, Boies and Lewis (1991) note that their recommended procedures do not seem to have been followed and this might be due to managers not allowing sufficient iteration and heuristics. This could well be the case in time and budget constrained situations faced in most commercial operations. In the end this narrow view could be counterproductive. A fonnal validation process that simply analyses a package and concludes it is acceptable may not be appropriate (have details of an unacceptable system ever been reported?). In general, the principles for a good interface design in expert systems are unlikely to be different from those applicable to other applications. Cradwick (1991) specifically addresses expert system interfaces but in reality discusses principles that apply to all systems.
As noted, to date most work on evaluating and developing interfaces has been infonnal. This
evaluation relates to how easy it is to learn the package and so discuss evaluating the learning process itself. Davis and Bostrom (1993) emphasise this point and objectively compare two training methods. In the study described in this Report it was felt unnecessary to analyze training methods as it was believed the packages had been so well constructed that they were self evident. In that all the users had no problems in installing the system and subsequently using them without any personal contact at all, clearly indicates that this was in fact the case.
Finally, it should be noted that training has more than one component. There is the training related to using the package itself, but using the package may also provide training in the subject of the package. That is while the package can provide an answer to the decision problem, the provision of the answer may be secondary to the fact that using the package
trains the farmer in the components and analyses of the decision problem. Evidence will be presented later that indicates this decision training may well be as important as the decision conclusion itself. Indeed Gum and Blank (1990) go so far as to talk about designing an expert system specifically for extension purposes. This is an area that has not had sufficient attention in the past.
2.2
Developing the Feed Management Systems
It was initially assumed that an expert system to cover most aspects of grazing management would be developed. It was very soon obvious that this was an impossible task given the funds and time available. Discussions with a number of 'field experts', people with professional experience of farm consultancy, research, teaching and extension, indicated that a common sub-problem was that of deciding whether to wean a mob of lambs. Furthermore, this was a relatively easily bounded problem that was seen to be tractable and consequently eminently suitable for using as a means to evolve procedures for the development of further systems. The overall approach, then, was to divide the grazing management problem into a series of sub-problems.
As noted, interface design is important. Consequently four alternative forms of the weaning expert system were developed and exposed to the field experts for formal analysis. The rules and conclusions giving rise to the knowledge base were identical, thus allowing a comparison of the interfaces. One system was developed using an expert system shell (VPEXPERT (1987)), and the others using an objected orientated programming package (LevelS (1990)) as the latter allowed more sophistication and control in the interface. The differences are described in the next chapter, but essentially the frrst system had simple questions, one per screen, whereas system four was completely mouse controlled with all questions on one screen.
study are reported in Nuthall and Bishop-Hurley (1994). A stratified sample of 3097 properties was selected and each sent an extensive questionnaire.
Following the attainment of a response rate of 37.1 percent a non-responders survey was conducted. This suggested the responding sample was representative.
Besides enquiring about feed management problems information was obtained on the farmers' personal attributes, on their feed management practices, including feed budgeting and on their ownership and use of computers. Some 20 percent of the farmers indicated they carried out formal feed budgeting (it is suspected the definition of 'formal' was liberally interpreted. It was defined as calculating and writing down estimates of feed supply and demand), 24 percent said they had a computer and 19 percent used a computer for business. It was believed important to enquire about computer use as the development of management aids is very likely to depend on computer ownership and use. A wide range of other data was collected and analyzed. This is fully reported in the Report.
Of immediate significance is the fact that two feed related problems seen as being important were the management of surplus pasture and the drenching of stock for internal parasite control. The latter is no doubt seen as important due to the reports of the build up of resistant strains. While other important problem areas were also mentioned, the fact that these two represented quite different aspects of feed management meant they could be used to explore the full spectrum of feed management expert system possibilities. Thus the development of the drenching and feed surplus systems using KnowledgePro (1991) as the development tool was undertaken.
All packages were developed and validated in conjunction with a range of experts (as reported .in the Research Reports (Bishop-Hurley and Nuthall (1994), a, b and c). The drenching system relied heavily on a review of the literature as the source of the rules, but it was then checked using a committee of experts. The weaning system relied on research results, to a certain extent, for its knowledge base, but the experts also had an input through the validation process. On the other hand, the surplus system relied on experts for both its development and validation. Clearly, anyone system must be developed using the best information available, and this will vary from case to case.
CHAPTER THREE
DETAILS OF THE TRIAL SYSTEMS
3.1
Introduction
While full details of the knowledge bases are provided in Bishop-Hurley and Nuthall «1994) a, b and c), it is necessary to provide details of the appearances of the packages here to enable an appreciation of the analysis. The evaluation analyses of the package rules and advice, however, are self explanatory and do not require an understanding of the specific knowledge bases. This chapter contains these appearance descriptions largely through providing 'screen dumps'. As developing the fanner distributed packages relied on initial field expert trials, the results of these trials are also presented.
3.2
The Weaning Systems Developed for the Field Expert Trials
Seven field experts were asked to use four different versions of the initial weaning system and to comment on various factors. The responses were recorded using a questionnaire. In addition, the field experts were asked to record details of their computer experience and to answer a series of questions designed to ascertain their personality type as outlined in chapter one. Appendix one contains the questionnaire used for recording their general views and comments, appendices two and three the questionnaire obtaining computer experience, system comparison and personality data respectively.
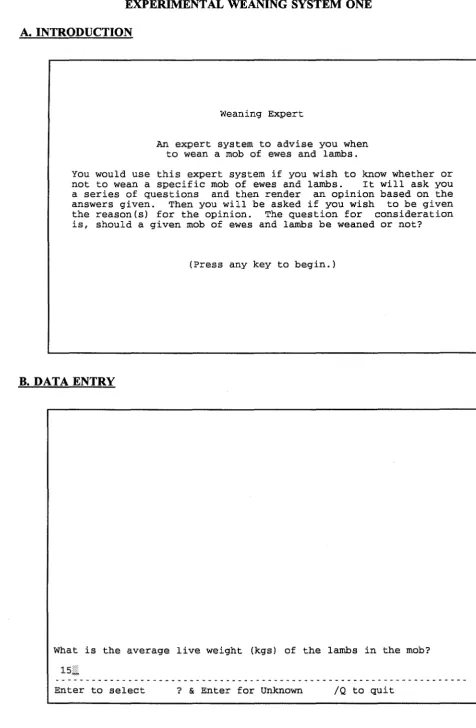
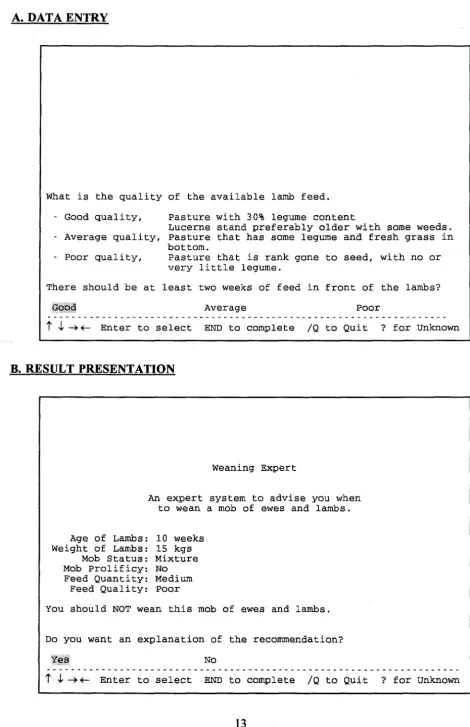
Figures one to nine contain screen excerpts from each of the four systems which, as noted earlier, had identical weaning rule bases and conclusions. An examination of these tables clearly indicates the differences between the versions. Figures one to three represent system one developed using the VPExpert (1987) shell. Figure one A is the introductory screen whereas Figure one B is an example of the questions asked on a one per screen basis. Figure two A is another data entry question example that contains some help instructions. Figure two B contains a list of all the questions asked and some example answers together with the conclusion emanating from the sample set of answers. Figure three A is an example of an explanation of the conclusion whereas Figure three B shows the options available after a particular consultation has been completed. Overall, the questioning procedure is rather slow given the one question per screen approach, and, furthermore, the new user is somewhat unsure where the process is leading as each question appears to be independent.
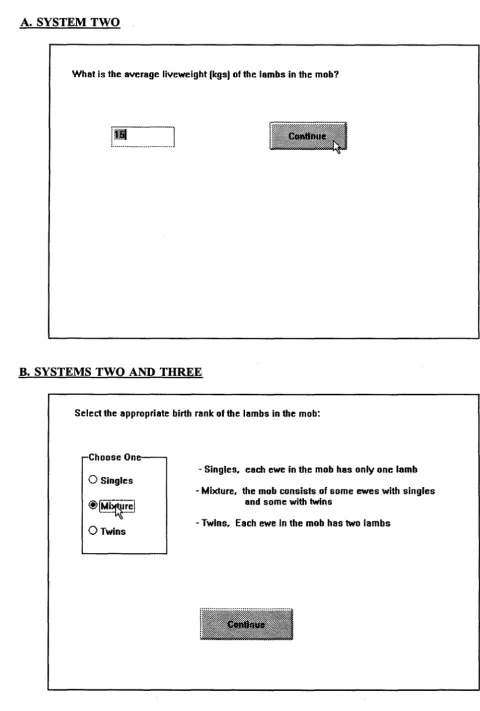
Systems two to four are quite different to system one and make varying degrees of mouse use (mechanical pointing device). System two has the same 'one question per screen' approach as system one but has a more professional look being coded in a modem graphical user interface (GUI) package (Level 5 (1990». It also requires some keyboard data entry. System three is similar in the questioning procedure, but uses a presented range of options
FIGURE ONE
EXPERIMENTAL WEANING SYSTEM ONE
A. INTRODUCTION
weaning Expert
An expert system to advise you when to wean a mob of ewes and lambs.
You would use this expert system if you wish to know whether or not to wean a specific mob of ewes and lambs. It will ask you a series of questions and then render an opinion based on the answers given. Then you will be asked if you wish to be given the reason(s) for the opinion. The question for consideration is, should a given mob of ewes and lambs be weaned or not?
(Press any key to begin.)
FIGURE TWO
EXPERIMENTAL WEANING SYSTEM ONE
A. DATA ENTRY
What is the quality of the available lamb feed.
- Good quality, Pasture with 30% legume content
Lucerne stand preferably older with some weeds. - Average quality, Pasture that has some legume and fresh grass in
bottom.
- Poor quality, Pasture that is rank gone to seed, with no or
very little legume.
There should be at least two weeks of feed in front of the lambs?
Average Poor
t .J.. ~ +-- Enter to select END to complete /Q to Quit ? for Unknown
B. RESULT PRESENTATION
Weaning Expert
An expert system to advise you when
to wean a mob of ewes and lambs.
Age of Lambs: 10 weeks Weight of Lambs: 15 kgs
Mob Status: Mixture Mob Prolificy: No Feed Quantity: Medium
Feed Quality: Poor
You should NOT wean this mob of ewes and lambs.
FIGURE THREE
EXPERIMENTAL WEANING SYSTEM ONE
A. EXPLANATION OF A CONCLUSION
TO wean early good quality legume pasture needs to be available for the lambs to go onto. Without good quality pasture for the lambs to go onto they are better left with the ewes. Ewes convert poor
quality feed into a high quality energy source for the lambs in the form of milk. By weaning time some good quality legume pasture needs to be ready for the lambs to go onto. One way of achieving this is to make supplements from the surplus feed. After a few weeks these paddocks will provide the high quality feed needed by the lambs at weaning time.
(Press any key to continue.)
B. OPTIONS AVAILABLE FOLLOWING A CONSULTATION
Please choose your desired action.
Exit Weaning Expert Restart Consultation Which variable do you wish to change.
m~~?i~
Prolific Breeddam
Lambwt
Feedquantity Priceewe
Change variable
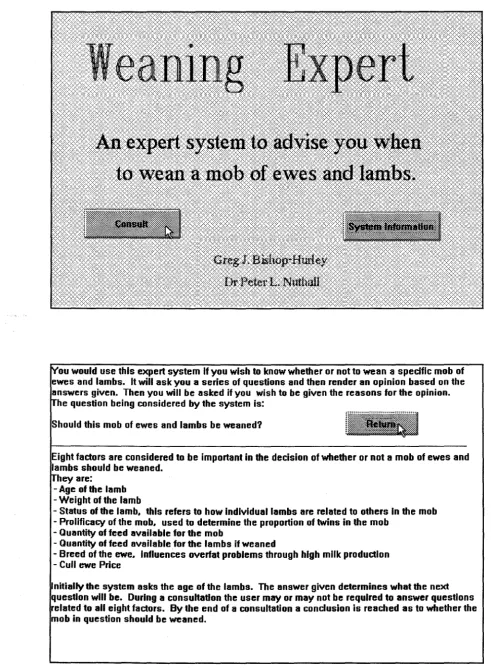
FIGURE FOUR
EXPERIMENTAL WEANING SYSTEMS - INTRODUCTORY SCREEN SYSTEMS TWO, THREE AND FOUR
. : .... .
:.: .. :.,:.
:,'
:: ... : ...
.... ":' , '.:' ... < .... .
ou would use this expert system If you wish to know whether or not to wean a specific mob of ewes and lambs. It will ask you a series of questions and then render an opinion based on the answers given. Then you will be asked if you wish to be given the reasons for the opinion.
he question being considered by the system is:
Should this mob of ewes and lambs be weaned?
Eight factors are considered to be important in the decision of whether or not a mob of ewes and lambs should be weaned.
hey are:
- Age of the lamb - Weight of the lamb
- Status of the lamb. this refers to how individual lambs are related to others In the mob - Prolificacy of the mob. used to determine the proportion of twins in the mob
- Quantity of feed available for the mob
- Quantity of feed available for the lambs if weaned
- Breed of the ewe. Influences overfat problems through high milk production - Cull ewe Price
.. : .. : ... .
FIGURE FIVE
EXPERIMENTAL WEANING SYSTEMS-DATA ENTRY SYSTEMS 2 AND 3
A. SYSTEM TWO
What is the average liveweight [kgs) of the lambs in the mob?
!_~~
________________________
l
B. SYSTEMS TWO AND THREE
Select the appropriate birth rank of the lambs in the mob:
Choose One
o
Singles®[Mi~re]
o
Twins- Singles. each ewe in the mob has only one lamb
- Mixture. the mob consists of some ewes with singles and some with twins
FIGURE SIX
EXPERIMENTAL WEANING SYSTEMS - RESULTS, SYSTEMS 2, 3 AND 4
A. SYSTEMS TWO AND THREE
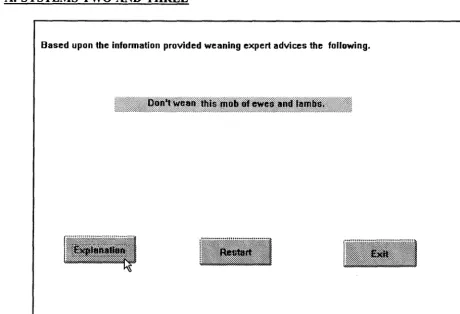
Based upon the information provided weaning expert advices the following.
B. SYSTEMS TWO, THREE AND FOUR
The following explains the advice given by the system.
FIGURE SEVEN
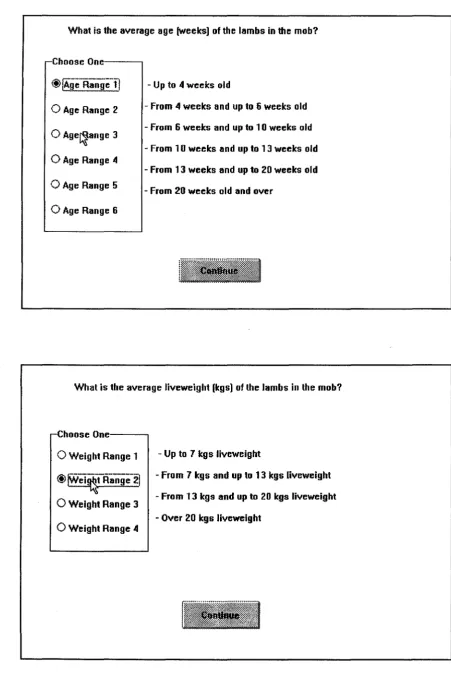
EXPERIMENTAL WEANING SYSTEMS - DATA ENTRY FOR SYSTEM THREE
What is the average age (weeks) of the lambs in the mob?
Choose One---,
o
Age Range 2o
Age~ange 3OAge Range 4
OAge Range 5
o
Age Range 6- Up to 4 weeks old
- From 4 weeks and up to 6 weeks old
- From 6 weeks and up to 10 weeks old
- From 10 weeks and up to 13 weeks old
- From 13 weeks and up to 20 weeks old
- From 20 weeks old and over
What is the average liveweight (kgs) of the lambs in the mob?
Choose One---,
o
Weight Range 1 @ lWei~ Rang~-21o
Weight Range 3o
Weight Range ...- Up to 1 kgs liveweight
- from 1 kgs and up to 13 kgs liveweight - from °13 kgs and up to 20 kgs liveweight
FIGURE EIGHT
EXPERIMENTAL WEANING SYSTEMS - INSTRUCTIONS FOR SYSTEMS TWO, THREE AND FOUR
Weaning Expert
This is a Expert system that can help you to decide when to wean a mob of ewes and lambs.
Start at the top left of the screen and select the value from each box that best describes your set of circumstances. When you have entered enough data the system will display the result down the bottom. You can then change any factors to see how this effrects the advice and explanation made by the system. Explanations can be viewed at any time.
To make aseler,:t!an move the mouse pointer to the factor and click the left button to make 8
selection.
To get a description of each of the factors move the mouse pointer to the heading and when the hand appears click the left mouse button.
FIGURE NINE
EXPERIMENTAL WEANING SYSTEMS - SYSTEM FOUR DATA ENTRY
A!~e of L!lrnh~! (wks) VildOht (If Lambs [koHl Feed Quantity Fet~d QuaUty
0: Oto'" 0:Ot07
o
Higho
Good0:4t06 0:7to13 ® Medium @Average
0:6to10
(!>: 13 to 20
o
Lowo
Poor@ ~-fOto-l31
0 : 20 plus
0:
13 to 200:
20 plusStatus ~amb Pmliiir.a(;y of Flock Price of Ewe BH~(~d (if Dam
o
Singles 0Veso
Higho
Higho
Mixture ONoo
Not Higho
Not Higho
TwinsFigure four gives the introductory screens for systems two, three and four (same in all cases), data entry screens for systems two and three are presented in Figure five, whereas an example of a conclusion and explanation for systems two, three and four are given in Figure six. Data entry screens for system three are presented in Figure seven, whereas Figure nine gives the entire data entry screen for system four. Finally, Figure eight shows the instruction screen used for systems two, three and four. While all the systems appear on the surface to be somewhat simple, the code consumed 500 .Kilobytes of storage indicating the complexity of the package necessary to provide ease of use and screen simplicity.
3.3
The Results of the Field Experts Trial
Only the results that relate to a comparison of the systems is presented. Many general comments on the weaning problem itself were made and many of these were subsequently incorporated into the systems developed for the farmers.
Table 1 gives the average computer use and self rated experience of the field experts.
Table 1
Field Ewert's Computer Use and Self Rated Computer Skills
I
MeanI
std*
I
Computer Use (days/month) 18.29 7.76 Computer Use (hours/week) 10.29 5.36General Computer Skills 5.43 2.06
(1 = very good, 10 = very poor)
Keyboard Skills 5.29 2.31
(1 = very good, 10 = very poor)
Mouse Use Frequency 1.57 0.73
(1 = never, 10=regularly)
GUI Use Frequency 1.57 0.73
(1 =never, 10=regularly)
*
Standard deviationTable 2 presents the experts' scoring of the four systems with respect to various presentation and assistance questions. Scores are based on 1
=
very good/excellent to 10=very difficult/not acceptable.Table 2
Field Experts' Scoring of the Four Trial Systems
With Respect to Various Presentation and Assistance Attributes (1
=
highest score, 10=
lowest score,Standard deviation in brackets)
System Number Attribute
1 2 3 4
Ease of Use 1.43 (0.49) 3.1 (2.29) 2.29 (1.75) 1.43 (0.73)
Appearance and Layout 2.71 (0.45) 2.00 (1.31) 1.86 (1.36) 1.71 (0.88) Advice given by Version 3.43 (1.50) 3.14 (1.25) 3.29 (1.39) 3.14 (1.25) Explanation to the Advice 3.57 (1.50) 2.86 (0.64) 3.00 (1.07) 3.00 (1.07) Help, Guidance, Messages 2.14 (0.64) 2.43 (0.49) 2.57 (0.49) 3.00 (1.51) Importance of a Printout 4.71 (3.15) 4.71 (3.15) 5.00 (2.88) 2.14 (2.90)
Table 3 contains the ranking averages for each attribute (1
=
highest rank, 4=
lowest rank) and the Friedman rank test probabilities.Table 3
Field Experts' Ranking of the Four Trial Systems With Respect to Various Presentation Attributes
(Ranked on a 1 to 4 scale, standard deviation in brackets)
System Number Attribute
1 2 3 4
Ease of Use, Functionality 2.86 (1.25) 2.57 (0.73) 2.00 (0.53) 1.14 (0.35)
Appearance and Layout 3.14 (0.83) 2.57 (0.49) 2.00 (0.53) 1.29 (0.70) Advice given by Version 1.86 (0.99) 1.71 (0.70) 1.86 (0.64) 1.57 (1.05) Overall best Version 3.00 (0.93) 2.71 (0.70) 2.14 (0.64) 1.14 (0.35)
Best Version (Fanner) 2.71 (0.88) 2.86 (0.83) 2.29 (0.70) 1.14 (0.35)
Friedman Rank Test Probability 0.027 0.016 0.815 0.021 0.028
The Ease of Use and Functionality ranking clearly places system four as the most preferred and these differences are significant. The same applies to Appearance and Layout, Overall Best Version, and Best Version (Farmer). This latter stems from asking how the field experts believed the farmers would rank the system. When it came to the advice preferred there is little difference in the average rankings and furthermore, the difference is not significant. It would be surprising if the result had been any different as the rules and advice were identical for each system.
The overwhelming conclusion must be that at least the field experts prefer a GUI based system that is mouse controlled with pick lists and has all questions displayed on one screen. There is, however, clearly a limit to how many questions can be presented at one time and screen cluttering, and consequent confusion, must eventually be a factor. For the weaning system this point has clearly not been reached.
Computer experience (Xl) was defined as:
Xl
=
(days of computer use/month+-
4.3) x (hours/week) Computer skill (XJ was defmed as:X2
=
(11 - general computer skills score)+ (11 - keyboard skills score)
+
(mouse use score)+
(GUI use score)(Note - the subtractions were necessary to convert the scale to an ascending one)
Extroversion/Introversion variable (XJ was defmed on a scale of 1
=
'extroversion', 0=
indifference and -1 = 'introversion'.Similarly the other personality attributes were defined:
X4
=
1 for, 'sensate' 0 for indifference, -1 for 'intuitive'Xs
=
1 for, 'thinking', 0 for indifference, -1 for 'feeling' ~ = 1 for, 'judging', 0 for indifference, -1 for 'perceiving'.The authors also scored the package on a one to ten scale for the following
factors:-X7
=
Professionalism (1=
unprofessional (setting out, grammar, spelling, colourcombinations, wording, screen simplicity), through to 10 = totally professional)
Xs
=
Data entry skills required (1=
all keyboard, through to 10=
all point and click from pick lists)~
=
On line help and advice (1=
no help, through to 10=
extensive, helpful and professional help and advice)XlO = Number of data entry items/screen (1 = an excessive quantity of information required with clutter and comprehension difficulty, through to 10
=
easily assimilable quantity but with a sufficient number of items to allow relationship to be clear).For variables X7 to XlO the trial systems were scored as follows:
System Number
Attribute One Two Three Four
Professionalism 3 4 7 8
Data entry skills 1 7 9 10
With respect to personality, Table 4 contains the field experts' characteristics.
Table 4
The Personality Features of the Field Experts (e
=
extrovert, i=
introvert; s=
sensate, n=
intuitive; t=
thinking, f=
feeling; j=
judging, P=
perceiving, 0=
neutral)Characteristics
Field Expert eli sIn tlf
j/p
1 e s t j
2 e s 0 j
3
i s t j4 e s f j
5
i s f j6 e n t j
7 i s t j
For the population at large, Keirsey and Bates (1984) note that 75 percent are extroverts, 75 percent are sensate, and 50 percent are thinking and judging. This sample tends towards these nonns except in the case of the judginglperceiving feature.
For the 'ease of use' score it was found the following relationship was useful in explaining the differences (two stars are used to indicate significance at greater than 1 percent, and one
star for greater than 10 percent).
Ease of use score
=
O.24Xz** - .20X3** - .15X4 - .51X7** + .36XlO**RZ = 0.82**
For the appearance and layout score the equation found to be most useful was:
Appearance and layout score
=
0.17X2** - 0.20X3** + 0.18~** - O.l1Xs R2=
0.91**Similar conclusions apply but note that the judging/perceiving factor
(XJ
comes into play and that an increasing use of the mouse (Xs) tends to lower the score (the users prefer this), though the variable is only significant at the 11.6% level.When it comes to scoring the advice offered (remember, each system had exactly the same rule set and advice), the score can be explained using:
Advice score
=
0.24X2** - 0.04XI** - 0.15X3** -0.14~*+
0.18Xs**+
0.53~** R2=
0.98**Effectively, personality (X3 to
XJ
plays an important part in how people view advice, as does their computer skill (XJ and experience (Xl)' though this latter factor only has a marginal effect.For explaining the different scores on the explanations to the advice it was found computer skill was the most significant variable. The equation was:
Explanation to the advice score
=
0.19X2** R2 = 0.75**Perhaps people with greater computer skills (self assessed) are less able to accept the 'computer advice' without a detailed justification.
In explaining the field experts score on whether a printout of the results was important the following equation was
obtained:-Printout importance score = 9.98**
+
0.12XI** - 0.82X2**+
0.58X3+
0.74X4** - 0.73~ **R2 = 0.92**
Most people clearly prefer a printout but those with more computer skill (XJ and a more judging
(XJ
personality tend to place a higher importance on printouts. Overall, the message is clear, however.The relationships discussed explain the one to ten scores provided. In interpreting the results it must be remembered that the scores are not absolute measures in that different subjects have non-comparable views on what is good and bad. Personality is probably important in explaining the difference, and this certainly seems to be the case. When it comes to ranking the systems the individual results are comparable in that if one system is preferred by all subjects it can be concluded that they all agree it is better. In contrast, if a system is given a score of say 8, by one subject and, say, 6 by another, this data in itself does not indicate one person believes anymore in the system than the other person.
Turning then to explaining the rankings it was found that:
Ease of use/functionality ranking
=
0.12Xz**
+
0.25X7**RZ
=
0.63**Appearance and layout ranking = 0.32X7**
RZ
=
0.59**
Overall best version ranking
=
0.10Xz*
+ 0.28X7**RZ
=
0.62**
and that a strong relationship did not exist for the advice ranking (as might be expected).
None of their relationships are particularly strong (see R2). Clearly the 'professionalism' (X7) variable is important, and to a lesser extent the computer skills measure. Note that
personality is not a factor in explaining the rankings which do not, of course, rely on a non-comparable scoring scale.
In reviewing the analysis as a whole, it is clear the field experts preferred system four (mouse driven, as many questions as possible on one screen, pick lists) and that components of personality are important in how they interpret the systems. This would suggest that it may be preferable to offer a range of systems to enable high acceptance levels. However, it must be remembered that the field expert trials were designed to provide information and experience that could be used in developing improved systems for use by farmers. This was certainly the case.
3.4 Details of the Presentation Aspects of the Systems Developed
for Farm Use
To further explore presentation aspects three different weaning packages were developed, though each included the lessons learnt from the field expert trials. All farmer systems were developed using Knowledge Pro (1991).
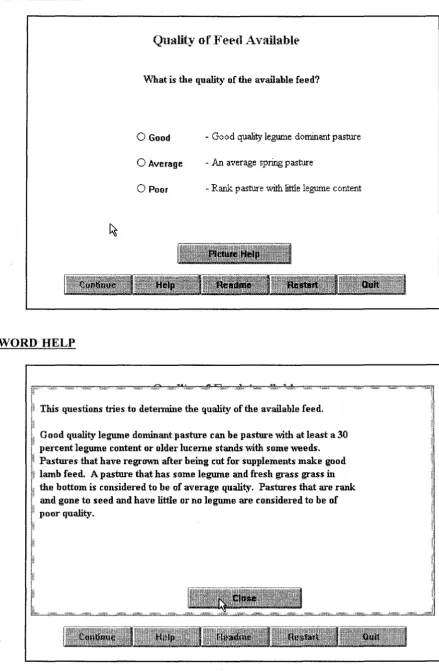
could then be called up on the screen on demand. The one most akin to the average lamb weight could then be selected (by pointing and clicking) in order to answer the question. Similarly, pictures of different pasture quantities and qualities were provided as 'help pictures'. A major question, then, was whether farmers would find this picture assistance beneficial. The cost of providing this assistance was the difficulty of obtaining suitable pictures and the extra disk storage required (520 Kilobytes).
In addition, as will be seen from the 'screen dump' figures, the KnowledgePro (1991) systems could be called rather more professional than the earlier systems in that the presentation is neater and more logical and extensive use is made of selection buttons.
Wean Two differs from Wean One in that picture help is not provided, and the questions are all presented on a single screen. Wean Three, to provide the contrast, is the same as Wean Two, except that picture help has been added back.
A study of Figures ten, eleven and twelve provides an understanding of how the three wean systems appear and operate including the picture help. Figure thirteen and fourteen indicate how the general procedures developed for the weaning systems appear when applied to the drenching and surplus feed problems. Each of these figures consists of more than one screen excerpt (each box is a snapshot of one screen display).
The farmers' views and opinions of all these systems are presented in Chapter Five. In analyzing this data it is necessary to quantify the features of the systems using the scales defined in Chapter Three. The authors, using these criteria, scored each system as follows:
System
Wean Wean Wean Drenc Surplus
One Two Three h
Professionalism 5 7 9 10 10
Data Entry Skills 7 9 9 10 10
On-line help 9 7 10 10 8
FIGURE TEN
SCREEN EXCERPTS FROM WEAN ONE - DESIGNED FOR FARMER USE
INTRODUCTION
You ,wuld use this e~ert system if you wish to know whether or not to wean
a specif'l£ mob of ewes and lambs. It will ask you a series of questions and
then render an ophrlon based on the answers given. Then you will be asked if
you wish to be given the reasons for the opinion.
The question being considered by the system is:
Should this mob of ewes and lambs be weaned?
Eight factors are considered to be important in the decision of whether or not a mob of ewes and
lambs should be weaned. They are: - Age of the lamb
- Weight of the lamb
- Status of the lamb, this refers to how individual lambs are related to others in the mob
- Pro1if'l£aCy of the mob, used to determine ~ proportion of twins in the mob
- Quantity of feed availabJe for the mob
- Quantity of feed availabJe for the lambs ifweaned
- Breed of the ewe, influences overfat probJems through high milk production
- Cull ewe Price
FIGURE TEN
(cont)
DATA ENTRY
Weight of the Lanlb
What is the average liveweight (kgs) of the lambs in the mob?
o
Up to 7 kgs liveweighto
From 7 kgs and up to 13 kgs liveweighto
From 13 kgs and up to 20 kgs liveweighto
Over 20 kgs liveweightPICTURE HELP - LAMB WEIGHTS
0-6 kgs
7-12 kgs
13-19 kgs
20+ kgs
Move the mouse pointer to the picture which best represents
the average lamb in the mob and click the left mouse button
to select it. Point and click on return to continue.
FIGURE TEN (cont)
DATA ENTRY
Quantity of Feed Available
Indicate how much feed you have for this mob now and in the future?
o
HighO~dium
o
lowPICTURE HELP - FEED QUANTITY
Low
- More than enough feed for maintenance - Only enough feed for maintenance - Not enough feed for maintenance
Medimn
High
~
FIGURE TEN (cont)
DATA ENTRY
Quality of
Fe~d Availabl~What is the quality of the available feed?
o
Good - Good quality legume dominant pastureo
Average - lUi average spring pastureo
Poor - Rank pasture with little legume contentWORD HELP
.. This questions tries to detennine the quality of the available feed. , Good quality legume dominant pasture can be pasture with at least a 30 ., percent legume content or older lucerne stands with some weeds.
Pastures that have regrown after being cut for supplements make good , lamb feed. A pasture that has some legume and fresh grass grass in , the bottom is considered to be of average quality. Pastures that are rank .• and gone to seed and have little or no legwne are considered to be of
FIGURE TEN (cont)
RECOMMENDATION AND ASSOCIATED CONDITIONS
An eAllert system to advise you 'when to -wean a mob of evves and lambs.
Age of Lambs: From 6 -weeks and up to 10 -weeks old Weight of Lambs: From 13 kgs and up to 20 kgs livevveight
Mob Status: Mixture Mob Prolificacy: No
Feed Quantity: Medium Feed Quality: Average Breed of Dam: Not High
PriceofE-we:NotHigh
Don't wean this Inob oj' ewes and IUlnbs.
RECOMI\lENDATION EXPLANATION
An expert system to advise you when to wean a mob of ewes and lambs.
Things appear to be going along quite nicely at the moment. Ensure good quality legwne pasture will be available for the lambs when they are weaned. Regr'owtb on ptldocks that have been cut for hay or silage makes good lamb feed.
FIGURE
ELEVEN
SCREEN EXCERPTS FROM WEAN T\VO - DESIGNED FOR FARMER USE
DATA ENTRY AND RECOMMENDATION
Age ofLamhs
o
Oupto4 04upto6@ 6 up to 10
o
10 up to 13 013 up to 20 020 pluso
Singles@:t/.uxture
o
TVMSWeight of Lamhs OOupto7 07 up to 13
@ 13 up to 20 020 plus
Prolificary @No
o
YesFeed Quantity
o
High@Medium
o
Low.PriCp. of Culls
o
High@NotHigh
Don't ·wean this nloh of ewes and lalnhs.
RECOMMENDATION EXPLANATION
ii
~ Things appear to be going along quite nicely at the moment. Ensure
~~ good quality legume pasture Viill be available for the lambs when
r
they are weaned. Regrowth on paddocks tllat have been cut for hayr
or silage makes good lamb feed.r
~
r
i~
r
Don't wean tills lnob of ewes and lambs.
:Feed Quality
o
Good@Average
o
PoorBreed of Dam
o
HighFIGURE ELEVEN
(cont)
WORD HELP
Select the range that best CO\"ers the weight of the Iambs in the mob.
If none of the choices available cover tlte range of weights of the
lambs in the mob then choose tlte one that is closest. Consider
what is the average weight of the Iambs in the mob and choose the
option that covers tlrls value.
If you are uncertain of the weight then make an estimate and see what
ruhice the system gives you. Standing on bathroom scales holding a few
of the Iambs is a good way to estimate Iamb weight.
If you are still uncertain of the weight you can run the system several
times to see how sensitive it is to tlrls factor.
EXAMPLE INSTRUCTIONS
You have not provided enough information for weaning expert to advise you.
FIGURE TWELVE
SCREEN EXCERPTS FROM WEAN THREE - DESIGNED FOR FARMER USE
DATA ENTRY AND RECOMMENDATION
Age of Lambs OOupto4 04upto6
@ 6 up to 10
o
10upto 13o
13 up to 20020 plus
nllilt
o
Singleso
:Mixtureo
T"vinsWeight of Lamhs OOupto7
@ 7 up to 13 013 up to 20
020 plus
Prolificary ONo
o
YesFeed Quantih-'
o
Higho
Mediumo
Low."P.:ric P. of Culls
o
Higho
Not HighDon't wean this nIob of ewes and lmnbs.
RECOl\-IMENDATION EXPLANATION
. These lambs are too small to be weaned. Even ifthere is a feed shortage it is not advisable to 'We31llaIllbs that have not reached 13 kgs. Should a feed shortage not be the cause of these lambs being so small then you should seek expert help in trying to detennine wbat the problem is.
Don~t'vean
this nwb of ewes and laulbs.
:Feed quality
o
Goodo
Averageo
Poor"Breed of .Dam
o
HighFIGURE THIRTEEN
SCREEN EXCERPTS FROM DRENCH - DESIGNED FOR FARMER USE
INTRODUCTION
< .,"::' .,. .:~." ;:;:;::~./::::.<":.; :":"':\:/-:::.::::.: ":.:.: : ::>::.t:.:.
-:-!:pre:ticfiiBg!iJt~p~~{>
DATA ENTRY
-, ...
Pastuxc l\'Hc
o
New Pastureo
Forage Cmpso
Crop Residueso
Cut for Hay/Silage @Pastureo
ChicorylLw:erne. .
Period Sl)elled
o
Spelled <: 12: w}",o
Spelled" 12: w}",o
1-4wee}",o
5-8wee}",o
9-12wee}",@ 13-16",ee}",
017 -20"",e}'"
o
2:l - 52 weebSpedes
o
Goatso
Deero
Cattle @Sheepo
Otherl~~~=
..
~
...
~. =~~=~b~~~
....
=~1
Age
@Adult
o
Lactating O<2yrs, S e a s o n Pasture Heigbt .0 Spring
o
Summer@Autumn
o
Wintero
ShOItFIGURE THIRTEEN (cont)
DATA ENTRY - ALTERNATIVE FORM
... . . . . . .
Class of Stocli
@ Works Lambs
o
Repl. Lambso
Hoggetso
EweslLambso
Adult SheepStodi Condition
o
Good<..~ Average
o
PoorRECOMMENDATION
. .
Reason t.o Drench
@ Scouring
o
III Thrifto
Shiftingo
Due to beo
Traditionalo
Ret.lNewFt"ed Stress
o
High@Moderate
o
Low. ..
Faecal Egg COlmt
. 0 Low «2S0eggs/g)
o
Ave (2S0-S00eggs/g)o
High (>500eggs/g)@ No FEe Value
. .
S:tfe Pastu.re
o
Safe@ Safer
o
UnsafePreveution Pro~.
o
Dueo
Not Due@NoProgram
... .. .
Stoddng Rate
o
Low «lOsu/ha)o
Ave (lO-lSsu/ha)FIGURE FOURTEEN
SCREEN EXCERPTS FROM SURPLUS - DESIGNED FOR FARMER USE
FIGURE FOURTEEN (cont)
FURTHER DATA ENTRY
r
''' ... , ... o.> . . . , •• , . . . ' . . . , . . . , . . . ' . . . m ... , ... , ... ,_ ... , ... ''' ... ] '.'m ... ' ... , ... _., .. _ ... , ... .
S C O l U 1 . I t , ' 'Voo} Condition
'j
Body Couilltio:no
Severe@Moderate
o
Not Seoming@ Bright/Good
o
DuIIJPoorDATA ENTRY - ANOTHER EXAMPLE
Season Reliahmt),'
o
Reliable@Unsure
o
UmllliableSoil .Moisture
o
Saturated@Moist
o
DryRainf~n
o
High@Average
o
LowOWann
OA~rage
o
Coldo
Increasingo
Srtleo
DeereasillgT~lnperatu.re