Increased Behavior Problems Associated With Delayed School Entry and
Delayed School Progress
Robert S. Byrd, MD, MPH*; Michael Weitzman, MD*; and Peggy Auinger, MS‡
ABSTRACT. Objective. To investigate whether stu-dents who are old-for-grade have higher rates of reported behavior problems and to investigate whether this asso-ciation is independent of having been retained a grade in school.
Methods. Cross-sectional analyses of parental reports from the nationally representative sample of 9079 chil-dren ages 7 to 17 years who participated in the Child Health Supplement to the 1988 National Health Inter-view Survey. Students older than the modal age for their grade were considered old-for-grade, either due to de-layed school entry (those without grade retention) or to delayed school progress (with history of grade retention). Behavior problems were defined as scores>90th percen-tile on a well-utilized, standardized Behavior Problem Index (BPI).
Results. Twenty-six percent of 7- to 17-year-old chil-dren in the United States are for-grade. Being old-for-grade is more common in males (31%), blacks (33%), Hispanics (32%), those living in single-parent house-holds (31%) or poverty (43%), and those with mothers with low educational attainment (42%). Most children (84%) who repeated a grade are old-for-grade, but only 54% of old-for-grade students have been retained. For children who were old-for-grade, 19% of those grade-retained and 12% of those nongrade-retained had extreme BPI scores, and for those not old-for-grade, 17% of grade-retained and 7% of nongrade-retained children had extreme BPI scores. Although rates of extreme BPI scores were con-sistently lower for children who were neither old-for-grade nor old-for-grade-retained, and consistently higher for those with both, these rates increased with age for chil-dren who were old-for-grade without being retained. Controlling for multiple potential confounders with lo-gistic regression, both old-for-grade status and grade re-tention are independently associated with increased rates of behavior problems. Separate logistic regression anal-yses for blacks and whites showed that these findings pertained only to white children.
Conclusions. Whereas grade retention is associated with increased rates of behavior problems in children and adolescents, simply being older than others in one’s class, without having experienced grade retention, is also associated with increased rates of behavior problems, most noticeably among adolescents. These data suggest that there may be latent adverse behavioral outcomes that result from delaying children’s school entry.
Pediatrics 1997;100:654 – 661; behavior problems, educa-tional status, grade retention, school readiness.
ABBREVIATIONS. BPI, Behavior Problem Index; OR, odds ratio.
D
ecisions regarding the age that children enter school rely largely on anecdotal reports. Data that exist to guide decisions are limited by either short follow-up or small sample size.1– 6Al-though some studies have found increased rates of academic and developmental hazards among the youngest in the class as compared with the oldest,1,6
others have found little long-term differences by the third and fourth grades.2–5 Parents and educators
must choose whether to hold back children whose birthdays are near the age cutoff that would other-wise place them among the youngest in their class. Although health, academic, and social benefits of early educational (preschool) experiences for youth have been demonstrated,7,8 it is unknown whether
children gain any long-term advantage by being older than the majority of their classmates.
There are some data to suggest that adolescents who are older than the majority of their classmates (old-for-grade) are more likely than those who are the same age as their classroom peers to smoke, drink, and use drugs,9 –10to engage in high-risk
sex-ual activities,10 to have suicidal intentions,10 and to
engage in violent behaviors.10These studies have not
distinguished the reason why the adolescents were old-for-grade. Many are old-for-grade by virtue of having been retained a grade or more in school; others were held back because they were deemed intellectually or emotionally delayed and thus not ready for school. Some take 2 years to transition from kindergarten (in transitional prefirst grade pro-grams), and others were held back in attempts to provide an intellectual or physical advantage of an extra year. The independent association of being old-for-grade and grade retention with adolescent be-haviors of concern is of importance, as it may help elucidate antecedents of adolescent mental health problems or risk behaviors and help identify strate-gies for prevention and intervention.
Since 1970, the proportion of students in the United States ages 6 to 8 years who are older than their same grade peers has doubled, from 11% in 1971 to a peak of 22% in 1990 to 18.7% more recently in 1993.11The proportion of adolescent students who
are old-for-grade also has increased during the last 2 decades from 22.5% in 1971 to 32% in 1993. Males,
From the *Department of Pediatrics, University of Rochester School of Medicine and Dentistry; and the ‡Department of Pediatrics, Rochester General Hospital, Rochester, New York.
Received for publication Oct 17, 1996; accepted Mar 13, 1997.
Reprint requests to (R.S.B.) Department of Pediatrics, Rochester General Hospital, 1425 Portland Ave, Rochester, NY 14621.
minorities, and children for whom English is a sec-ond language are disproportionately older than their same-grade peers.12In most cases, old-for-grade
sta-tus is largely determined by third grade. Very few programs exist that focus attention on accelerating remediation;13 thus, once children are old-for-grade,
they rarely catch up to their same age peers. There are few data to suggest why these trends exist and what impact this may have on adolescent behaviors. This article presents the results of analy-ses of nationally representative data to investigate whether being old-for-grade is associated with in-creased rates of behavior problems, and if so, to determine when during childhood and adolescence the behavior problems increase and to test whether this association is independent of having been re-tained a grade or more in school.
METHODS
Data from the 1988 Child Health Supplement to the National Health Interview Survey14were analyzed for this study. These
data represent the most recently collected, complete child health supplement to the National Health Interview Survey. The com-plex, multistage probability sampling design provides data on a nationally representative sample of 17 110 children and youth ages 0 to 17 years. Parents, predominately mothers (80%), re-sponded for their children. There were no medical examinations of children or review of medical records. The overall response rate for the child health supplement was 91%.
Analyses were confined to children ages 7 to 17 years, thereby limiting the sample to children who were old enough to have attended school for at least 1 year. Responses for 9131 children met this age criterion, but missing data reduced the sample studied by less than a percent to 9079 children. The variables investigated included demographic characteristics, such as age, gender, and race; family structure, mobility, and poverty status; maternal age at the birth of the sample child; current maternal educational level and employment status; and selected child health information (reported health status, birth weight, and exposure to cigarette smoke). Racial comparisons were limited to black versus white, using the variables as recoded by the National Center for Health Statistics.14White included Spanish origin persons unless they
were definitely black, Indian, or other nonwhite; black included African-American, Afro-American, Haitian, Jamaican, West Indian, and so on; other included other than black or white, such as Japanese, Chinese, American Indian, Korean, and Eskimo.
The primary independent variables of interest were age-for-grade and age-for-grade retention. Old-for-age-for-grade status was based on children’s birth dates, dates of interview, and reported grade levels. Students older than the modal age for their grade were considered old-for-grade. The modal ages for 3rd, 6th, 9th, and 12th grades based on national data are 8, 11, 14, and 17 years, respectively, using a cutoff of October 1. Actual cutoff dates for school entry vary by school system, and children whose birthdays are near the cutoff date will be among either the oldest or the youngest in their class, but at least 12 months separate students who are old-for-grade from those who might be considered young-for-grade.
Grade retention was assessed by parental report. Parents were asked whether their child had repeated any grades, and if so which ones. Old-for-grade students who had a history of grade retention were considered to have delayed school progress, whereas old-for-grade students without such history were consid-ered to have had delayed school entry.
The primary outcome studied was parentally reported behav-ior problems, using a standardized 32-item, parent-reported Be-havior Problem Index (BPI), developed by Zill15,16for children 4
years and older. Most BPI items were modeled after items from the Child Behavior Checklist of Achenbach and Edelbrook17and
were chosen because of their reliability and adaptability to the interview situation. Parents were asked whether each behavior is often true, sometimes true, or not true of their child, for each of the behaviors listed in the Appendix. These behaviors included the
following: “has sudden change in mood or feelings,” “feels or complains that no one loves him/her,” “cheats or tells lies,” “has a very strong temper and loses it easily,” and “cries too much.” The scoring system, as previously described, coded each item as either 1 if the parent responded often true or sometimes true or as 0 if not true. BPI scores were tallied by adding the 1 or 0 for each response, and the total was compared with the 90th percentile for age, a cutoff that has been associated in other studies with an increase in mental health referrals.18The BPI has been used in a
number of previous studies as a measure of significant behavioral problems.19 –24
Statistical Analyses
Analyses using SUDAAN (Research Triangle Institute, Research Triangle Park, NC) software permitted precise estimations of confi-dence intervals that account for the complex, two-staged design of the survey.25x2tests were used to test for differences in weighted
proportions.26To estimate the independent association that various
combinations of old-for-grade status and grade retention have with extreme BPI scores, logistic regression analyses were done to control for potentially confounding factors: age, gender, race, Hispanic eth-nicity, poverty status, maternal age and education, family structure, urban status, region of country, mobility since birth, low birth weight status, and household exposure to cigarette smoke. Additional logis-tic regression models were constructed to assess whether the associ-ations of behavior problems with old-for-grade status and grade retention vary by race or by age group. All analyses were conducted on an IBM-compatible PC.
RESULTS
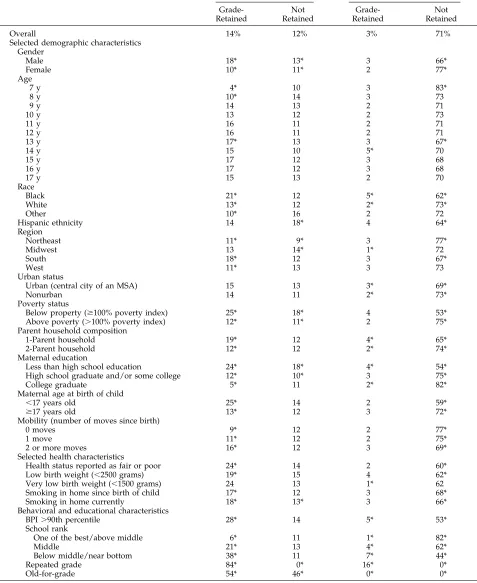
In this nationally representative cross-sectional sample of children ages 7 to 17 years, 26% were old-for-grade, approximately one half of whom had been retained a grade in school (14%) and the other half of whom had not (12%). The majority of children (71%) were neither retained nor old-for-grade, and a small proportion (3%) had been retained without becoming old-for-grade. Table 1 displays the esti-mated prevalence of old-for-grade and grade reten-tion by selected demographic, health, and behavioral characteristics. Males were more likely than females and black youth more likely than white youth to be old-for-grade, largely attributable to increased rates of grade retention. Hispanic children were more likely to be old-for-grade than non-Hispanic children despite similar rates of grade retention. Additionally, old-for-grade with grade retention varied by region, family structure, maternal age at birth of the child, number of times that the family had moved, parent-reported child health status, birth weight, household tobacco exposure, extreme score on the BPI, and rank in school. Being old-for-grade with and without re-tention was more common among children living in poverty and among children with less educated mothers.
To permit age-specific comparisons on the basis by which children become old-for-grade, the proportion of children who were old-for-grade are plotted for each year of age by grade retention status in Fig 1.
Age-specific comparisons of grade level at retention are made in Fig 2. At every age level, approximately 10 to 15% of children were old-for-grade without having been retained in school. The majority of
old-TABLE 1. Estimated Prevalence of Old-for-Grade and Grade-Retained United States Children, Ages 7 to 17 Years, by Selected Characteristics (n50.079) (Child Health Supplement to the 1988 National Health Interview Survey)
% Old-for-Grade % Not Old-for-Grade
Grade-Retained
Not Retained
Grade-Retained
Not Retained
Overall 14% 12% 3% 71%
Selected demographic characteristics Gender
Male 18* 13* 3 66*
Female 10* 11* 2 77*
Age
7 y 4* 10 3 83*
8 y 10* 14 3 73
9 y 14 13 2 71
10 y 13 12 2 73
11 y 16 11 2 71
12 y 16 11 2 71
13 y 17* 13 3 67*
14 y 15 10 5* 70
15 y 17 12 3 68
16 y 17 12 3 68
17 y 15 13 2 70
Race
Black 21* 12 5* 62*
White 13* 12 2* 73*
Other 10* 16 2 72
Hispanic ethnicity 14 18* 4 64*
Region
Northeast 11* 9* 3 77*
Midwest 13 14* 1* 72
South 18* 12 3 67*
West 11* 13 3 73
Urban status
Urban (central city of an MSA) 15 13 3* 69*
Nonurban 14 11 2* 73*
Poverty status
Below property ($100% poverty index) 25* 18* 4 53*
Above poverty (.100% poverty index) 12* 11* 2 75*
Parent household composition
1-Parent household 19* 12 4* 65*
2-Parent household 12* 12 2* 74*
Maternal education
Less than high school education 24* 18* 4* 54*
High school graduate and/or some college 12* 10* 3 75*
College graduate 5* 11 2* 82*
Maternal age at birth of child
,17 years old 25* 14 2 59*
$17 years old 13* 12 3 72*
Mobility (number of moves since birth)
0 moves 9* 12 2 77*
1 move 11* 12 2 75*
2 or more moves 16* 12 3 69*
Selected health characteristics
Health status reported as fair or poor 24* 14 2 60*
Low birth weight (,2500 grams) 19* 15 4 62*
Very low birth weight (,1500 grams) 24 13 1* 62
Smoking in home since birth of child 17* 12 3 68*
Smoking in home currently 18* 13* 3 66*
Behavioral and educational characteristics
BPI.90th percentile 28* 14 5* 53*
School rank
One of the best/above middle 6* 11 1* 82*
Middle 21* 13 4* 62*
Below middle/near bottom 38* 11 7* 44*
Repeated grade 84* 0* 16* 0*
Old-for-grade 54* 46* 0* 0*
for-grade, had been either delayed entry to school or retained a grade level by third grade, as seen in Fig 2. Among old-for-grade 17-year-old children, 77% were old-for-grade by third grade.
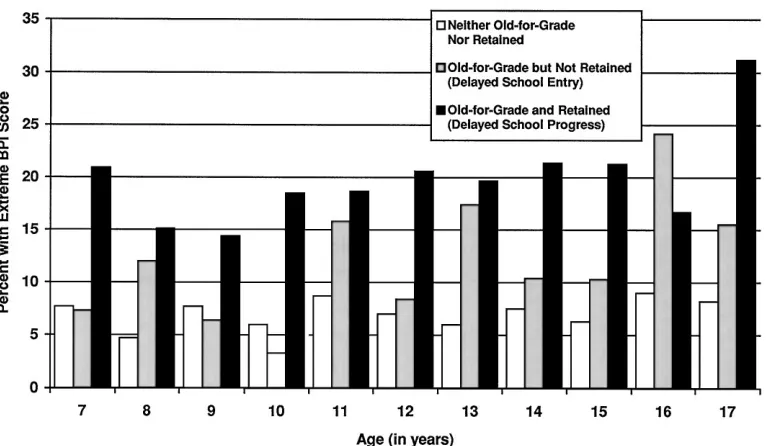
Comparing rates of extreme BPI scores with vari-ous combinations of old-for-grade and grade reten-tion status reveals that both factors are associated with increased rates of reported behavior problems. Old-for-grade children who had been retained a grade or more had the highest rate of reported ex-treme BPI scores (19%); those who were
old-for-grade without retention had a rate of 12%; of those who were not old-for-grade, children without a his-tory of grade retention had the lowest rate of extreme BPI scores (7%), whereas children who had been retained had a rate of 17% (P, .001 for these com-parisons that are not shown in the Figures or Tables). Figure 3 shows the rate of extreme BPI scores by age for groups based on old-for-grade and grade reten-tion status. Children who are neither old-for-grade nor grade-retained have lower rates of elevated BPI scores that are consistently lower across all age
Fig 1. Proportion of children, by age, who are old-for-grade by history of grade retention (n59079) (Child Health Supplement to the 1988 National Health Interview Survey).
groups. Children who are both old-for-grade and grade-retained have uniformly high rates of elevated BPI scores (more than twice the rate of the lowest risk group). Children who are old-for-grade without hav-ing been retained have a rate of elevated BPI scores that increases with age, with rates similar to the lowest-risk group (neither old-for-grade nor re-tained) when they are younger and approaching the rate for the highest-risk group (old-for-grade youth who had been retained) in the adolescent years.
Table 2 shows that extreme BPI scores are inde-pendently associated with being old-for-grade and having experienced grade retention [odds ratio (OR)
5 2.5], with grade retention alone (OR 5 2.2), and with being old-for-grade without having been re-tained (OR 5 1.5), controlling for multiple poten-tially confounding factors (P, .01 for each of these three independent associations). Logistic regression analyses conducted for each of three age categories (7 to 10 years, 11 to 13 years, and 14 to 17 years) revealed that old-for-grade without grade retention was independently associated with extreme BPI scores only in the oldest age category, whereas the combination of old-for-grade and grade retention consistently was independently associated with ex-treme BPI scores in all age groups (not shown in
Tables). These findings are consistent with the find-ings of the bivariate analyses illustrated in Fig 3.
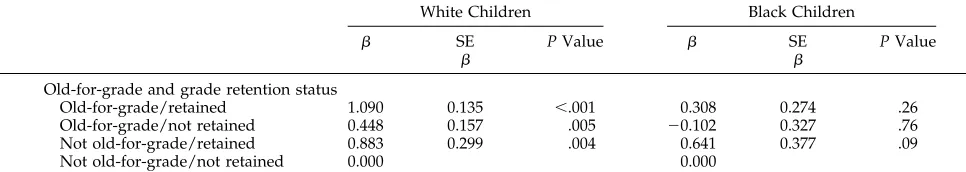
Logistic regression analyses were conducted sep-arately for black and white children and adolescents to test for racial differences in the association of old-for-grade status and grade retention with in-creased behavior problems. Table 3 shows that among black children and adolescents, neither old-for-grade status nor grade retention were indepen-dently associated with increased rates of extreme BPI scores. In contrast, these factors, either separately or in combination, were independently associated with extreme BPI scores among white children.
CONCLUSIONS
“At what age should children start first grade?” is a question that can have a lifelong impact on a child. This study suggests that being older than the major-ity of one’s classmates can adversely affect children’s behavior and that this effect is independent of having been retained a grade in school. These findings per-tain only to white children, as neither old-for-grade status nor grade retention were independently asso-ciated with increased reported behavior problems in black children. Furthermore, the emergence of be-havior problems among those who are old-for-grade
Fig 3. Age-specific rates of extreme Behavior Problem Index (BPI) scores by old-for-grade and grade retention status (n59079) (Child Health Supplement to the 1988 National Health Interview Survey).
TABLE 2. Independent Associations of Old-for-Grade Status and Grade Retention With Extreme Behavior Problem Index Scores (n59079)* (Child Health Supplement to the 1988 National Health Interview Survey)
b SE
b P Value OddsRatio 2
95% Confidence
Interval 1
95% Confidence Interval
Old-for-grade and grade retention status
Old-for-grade/retained 0.902 0.113 ,.001 2.5 2.0 3.1
Old-for-grade/not retained 0.414 0.151 .007 1.5 1.1 2.0
Not old-for-grade/retained 0.801 0.238 ,.001 2.2 1.4 3.6
Not old-for-grade/not retained 0.000 0.000 1.0
without having experienced grade retention seems to be concentrated among adolescents.
Timing of school entry is an emotionally charged issue for which there are minimal data to support various decisions that parents and school systems must make. Often, these decisions are based on a desire to give certain groups of children the advan-tage of an extra year of maturity before having to compete with others. Earlier studies have shown that adolescents who are old-for-grade, irrespective of grade retention, have higher rates of adolescent risk behaviors.9,10This study shows an independent
asso-ciation of old-for-grade status with extreme scores on the BPI, a standardized measure of behavior prob-lems, among adolescents. Extreme BPI scores, as de-termined by maternal report, are highly correlated with adolescents’ self-reported emotional distress, social-deviance, and health-risk behaviors.27 Thus,
the elevated rates of extreme BPI scores noted in old-for-grade adolescents are likely to be indepen-dently associated with problems in other domains of competency. These data suggest that there may be latent disadvantages for children who are older than the rest of their classmates, disadvantages that are realized during high school, well after the decisions regarding timing of school entry were made.
The limitations of this study warrant some discus-sion. As a retrospective and cross-sectional study, the temporal relationships inferred by increasing rates of extreme BPI scores with increasing age may be at-tributable instead to a cohort effect; this supposes that being old-for-grade was a risk factor in the past affecting only the older children and that for the younger children, it is not a factor. There is no evi-dence to support this possibility; however, a longi-tudinal study would be necessary to fully establish that a temporal relationship does exist. This study is further limited by the measurable outcomes avail-able in the source data. The outcome of parentally reported behavior problems scored by the BPI may reflect racial or cultural biases toward acceptable behavior.28Although the BPI is correlated with other
measures of competency, the limitations of data pre-clude us from directly investigating the association of old-for-grade status with adolescent reported be-haviors or with other measures of competency. These are questions for further study. This study, however, shows that from at least one perspective (parental perception of behavior), children who are older
than their peers are more likely to have behavior problems.
Although old-for-grade status was shown to be an independent risk factor for increased rates of behav-ior problems, one cannot conclude that all old-for-grade children would have done better if they began school with their same-age peers. The finding that neither old-for-grade status nor having been retained a grade in school was independently associated with increased rates of behavior problems among black children and adolescents was unexpected. Black chil-dren, who on average face more environmental and social adversity than do white children, did not have increased rates of parentally reported behavior prob-lems associated either with being old-for-grade or with grade retention. In other studies of risk factors, the number of risk factors present in a child’s or youth’s life has been shown to increase the likelihood of adverse outcomes;29 –31 thus, one might expect the
association of old-for-grade status and behavior problems to be stronger for black (than white) chil-dren and adolescents. Although this lack of associa-tion may be attributable to differential parental re-porting of behavior,28 the explanation may be that
other factors, such as poverty and family structure, are more strongly associated with reported behavior problems, as was shown in an earlier study of pre-dictors of early grade failure.20
How might being older than one’s classmates con-fer risk to an adolescent? One possible explanation might be that peer relationship formation may be altered by differences in the child’s age compared with his or her same grade peers. Biologic matura-tion (eg, puberty) occurs in earlier grades among students who are old-for-grade, and this may affect peer networks and self-concept and ultimately affect psychosocial functioning of adolescents.32 For some,
delaying school entry may also delay detection and treatment of previously undiagnosed developmental delays or learning disabilities.33 Such delays may
predispose children to later problems.
Understanding the mechanism for such associa-tions is important for devising intervention strate-gies. Old-for-grade adolescents, whether by delayed school entry or delayed school progress, are shown in this study to have higher rates of behavior prob-lems as reported by their parents and have been shown in previous studies9,10to have higher rates of
risky behaviors, including drug use. Given the long
TABLE 3. Racial Comparison of Independent Associations of Old-for-Grade Status and Grade Retention With Extreme Behavior Problem Index Scores (n59079)* (Child Health Supplement to the 1988 National Health Interview Survey)
White Children Black Children
b SE
b P Value b SEb P Value
Old-for-grade and grade retention status
Old-for-grade/retained 1.090 0.135 ,.001 0.308 0.274 .26
Old-for-grade/not retained 0.448 0.157 .005 20.102 0.327 .76
Not old-for-grade/retained 0.883 0.299 .004 0.641 0.377 .09
Not old-for-grade/not retained 0.000 0.000
lead time between becoming old-for-grade, and the subsequent increase in adolescent risk behaviors, old-for-grade youth may be the population to target with primary and secondary prevention strategies before their behavior problems spill over to other domains. Focus on behavior problems before the development of youth risk behaviors may be one avenue worth exploring with children who become old-for-grade.
One logical response to these findings by health care providers is to focus on school readiness as part of well-child visits. Children in the United States, on average, see their health care providers 2 to 3 times a year;34,35young children see them more often,
result-ing in approximately 12 to 15 opportunities for as-sessment and intervention. Often, pediatric health care providers are the only professionals consistently assessing preschoolers’ progress throughout multi-ple stages of early development and are often the only professionals in a position to intervene to im-prove school readiness. There are many points of intervention before school entry that a health care provider may initiate, from promotion of early liter-acy,36,37to early intervention,38,39to facilitation of
en-rollment in Head Start.40
The findings of this study may have relevance to pediatricians in assessing school readiness of pre-schoolers, in offering parents advice about age of school entry, and in monitoring the development of school-aged youth. In all of these activities, pediatri-cians may wish to include the major finding of the study, namely, that delaying school entry seems to have inadvertent latent adverse behavioral conse-quences for children and adolescents who are old-for-grade.
APPENDIX
Questions Asked in the Behavior Problem Index§14 1. Has sudden changes in mood or feeling.
2. Feels or complains that no one loves {child’s name}. 3. Is rather high-strung, tense, or nervous.
4. Cheats or tells lies. 5. Is too fearful or anxious. 6. Argues too much.
7. Has difficulty concentrating, cannot pay attention for long. 8. Is easily confused, seems to be in a fog.
9. Bullies, or is cruel or mean to others. 10. Is disobedient at home.
11. Is disobedient at school.
12. Does not to feel sorry after {child’s name} misbehaves. 13. Has trouble getting along with other children. 14. Has trouble getting along with teachers. 15. Is impulsive, or acts without thinking. 16. Feels worthless or inferior.
17. Is not liked by other children.
18. Has a lot of difficulty getting {child’s name} mind off certain thoughts, has obsessions.
19. Is restless or overly active, cannot sit still. 20. Is stubborn, sullen, or irritable.
21. Has a very strong temper and loses it easily. 22. Is unhappy, sad, or depressed.
23. Is withdrawn, does not get involved with others.
If child is 121years old, go to 29.
24. Breaks things on purpose, deliberately destroys {child’s name} own or other’s things.
25. Clings to adults. 26. Cries too much.
27. Demands a lot of attention. 28. Is too dependent on others.
If child is under 12 years old, stop.
29. Feel others out to get {child’s name.}
30. Hangs around with kids who get into trouble. 31. Is secretive, keeps things to himself/herself. 32. Worries too much.
§The interviewer reads the following statement: “Now I am going to read some statements that describe the behavior of many children. Please tell me whether each statement has been OFTEN true, SOMETIMES true, or NOT true of {child’s name} during the past 3 months.”
“The first statement is: ”Has sudden changes in mood or feel-ings.“ Has that been OFTEN true, SOMETIMES true, or NOT true of {child’s name} during the past 3 months?”
The interviewer records the response and continues with state-ment 2.
The interviewer reads the list repeating categories and/or time reference as needed.
ACKNOWLEDGMENT
We thank Sharon M. Carver, PhD, for reviewing this manu-script.
REFERENCES
1. Breznitz Z, Teltsch T. The effect of school entrance age on academic achievement and social emotional adjustment of children: follow up study of fourth graders. Psychol Sch. 1989;26:62– 68
2. May D. Relationships between the Gesell School Readiness Test and standardized achievement and intelligence measures. Educ Psychol
Meas. 1986;46:1051–1059
3. May DC, Welch E. Developmental placement: does it prevent future learning problems? J Learn Disabil. 1984;17:338 –341
4. May DC, Welch E. Screening for school readiness: the influence of birthdate and sex. Psychol Sch. 1986;23:100 –105
5. Wood C, Powell S, Knight RC. Predicting school readiness: the validity of developmental age. J Learn Disabil. 1984;17:8 –11
6. Maddux CD, Green C, Horner CM. School entry age among children labeled learning disabled, mentally retarded, and emotionally dis-turbed. Learning Disabilities Focus. 1986;2:7–12
7. Berruetta-Clement JR, Schweinhart LJ, Barnett WS, Epstein AS, Weikart DB. Changed Lives: The Effects of the Perry Preschool Program on Youths
Through Age 19. Ypsilanti, MI: Monographs of the High/Scope
Educa-tional Research Foundation; 1984:Number 8
8. Schweinhart LJ, Weikart DB. Young Children Grow Up: The Effects of the
Perry Preschool Program on Youths Through Age 15. Ypsilanti, MI:
Mono-graphs of the High/Scope Educational Research Foundation; 1980: Number 7
9. Byrd RS, Weitzman M, Doniger AS. Increased drug use among old-for-grade adolescents. Arch Pediatr Adolesc Med. 1996;150:470 – 476 10. Byrd RS, Weitzman M, Doniger AS. Increase in risk taking behaviors
among old-for-grade adolescents. Arch Pediatr Adolesc Med. 1994;148: P78. Abstract
11. U.S. Bureau of the Census. School Enrollment—Social and Economic Characteristics of Students: October 1993. (Table A-3). Current
Popula-tion Reports. October 1994:P20 – 479
12. U.S. Department of Education. The Condition of Education, 1992. Washington, DC: National Center for Education Statistics; 1992 13. Levin HM. Educational acceleration for at-risk students. In: Huston AC,
ed. Children in Poverty: Child Development and Public Policy. New York, NY: Cambridge University Press; 1991:222–240
14. National Center for Health Statistics. Public Use Data File Documentation,
Part I, National Health Interview Survey. (Machine readable data file and
documentation). Hyattsville, MD: National Center for Health Statistics (Producer). Springfield, VA: National Technical Information Service, US Department of Commerce, (Distributor); 1989
15. Zill N. Behavior Problem Scales Developed From the 1981 Child Health
Supplement to the National Health Interview Survey. Washington, DC:
Child Trends; 1985. Working paper
16. Zill N. Behavior Problem Index Based on Parental Report. Washington, DC: Child Trends; 1990. Working paper
17. Achenbach TM, Edelbrook C. Manual for the Child Behavior Checklist and
Revised Behavior Profile. Burlington, VT: Queen City Printers; 1983
socioeconomic risks, and behavior problems in children and adoles-cents. Pediatrics. 1990;117:687– 693
19. McGaughey PJ, Starfield B, Alexander C, Ensminger ME. Social envi-ronment and vulnerability of low birth weight children: a social-epidemiological perspective. Pediatrics. 1991;88:943–953
20. Byrd R, Weitzman M. Predictors of early grade retention among chil-dren in the United States. Pediatrics. 1994;93:481– 487
21. Weitzman M, Gortmaker S, Sobol A. Maternal smoking and behavior problems of children. Pediatrics. 1992;90:342–349
22. Simpson GA, Fowler MG. Geographic mobility and children’s emotional/behavioral adjustment and school functioning. Pediatrics. 1994;93:303–309
23. McCormick MC, Workman-Daniels K, Brooks-Gunn J. The behavioral and emotional well-being of school-age children different birth weights.
Pediatrics. 1996;97:18 –25
24. Peterson J, Zill N. Marital disruptions, parent-child relationships, and behavior problems in children and adolescents. J Marriage Fam. 1986; 48:295–307
25. Shah BV, Barnwell BG, Hunt PN, LaVange LM. SUDAAN User’s
Man-ual, Release 6.20. Research Triangle Park, NC: Research Triangle
Institute; 1992
26. Fleiss JL. Statistical Methods for Rates and Proportions. 2nd ed. New York, NY: John Wiley & Sons; 1981
27. Byrd R, Weitzman M, Auinger P. Mental health, social deviance, and risk-taking behaviors among adolescents with maternally reported be-havior problems. Pediatr Res. 1996;39:3A
28. Zill N. Developmental, learning, and emotional problems: health of our nation’s children, United States, 1988. Adv Data. 1990;190:7– 8 29. Sameroff AJ, Chandler MJ. Reproductive risk and the continuum of
caretaking casualty. In: Horowitz FD, Hetherington M, Scarr-Salapetak S, Siegel, eds. Review of Child Development Research. Chicago, IL:
Univer-sity Press; 1975;4:187–244
30. Sameroff A, Seifer R. Familial risk and child competence. Child Dev. 1983;54:1254 –1268
31. Escalona SK. Babies at double hazard: early development of infants at biologic and social risk. Pediatrics. 1982;70:670 – 676
32. Stattin H, Magnusson D. Social transition in adolescence: a biosocial perspective. In: Ribaupierre A de, ed. Transition Mechanisms in Child
Development: The Longitudinal Perspective. New York, NY: Cambridge
University Press; 1989:147–190
33. Palfrey JS, Singer JD, Walker DK, Butler JA. Early identification of children’s special needs: a study in five metropolitan communities.
J Pediatr. 1987;111:651– 659
34. Stoddard JJ, St Peter RF, Newacheck PW. Health insurance status and ambulatory care for children. N Engl J Med. 1994;330:1421–1425 35. Newacheck PW, Hughes DC, Stoddard JJ. Children’s access to primary
care: differences by race, income, and insurance status. Pediatrics. 1996; 97:26 –32
36. Needleman R, Fried L, Morely D, Taylor S, Zuckerman B. Clinic-based intervention to promote literacy. Am J Dis Child. 1991;145:881– 884 37. Needleman R, Zuckerman B. Fight illiteracy: prescribe a book! Contemp
Pediatr. 1992;9:41– 60
38. Blair C, Ramey CT, Hardin JM. Early intervention for low birthweight, premature infants: participation and intellectual development. Am J
Ment Retard. 1995;99:542–554
39. Campbell FA, Ramey CT. Effects of early intervention on intellectual and academic achievement: a folup study of children from low-income families. Child Dev. 1994;65(2 Special Issue No):684 – 698 40. Lee VE, Brooks-Gunn J, Schnur E, Liaw FR. Are Head Start effects
sustained? A longitudinal follow-up comparison of disadvantaged chil-dren attending Head Start, no preschool, and other preschool programs.
DOI: 10.1542/peds.100.4.654
1997;100;654
Pediatrics
Robert S. Byrd, Michael Weitzman and Peggy Auinger
School Progress
Increased Behavior Problems Associated With Delayed School Entry and Delayed
Services
Updated Information &
http://pediatrics.aappublications.org/content/100/4/654
including high resolution figures, can be found at:
References
http://pediatrics.aappublications.org/content/100/4/654#BIBL
This article cites 26 articles, 7 of which you can access for free at:
Subspecialty Collections
l_issues_sub
http://www.aappublications.org/cgi/collection/development:behaviora Developmental/Behavioral Pediatrics
following collection(s):
This article, along with others on similar topics, appears in the
Permissions & Licensing
http://www.aappublications.org/site/misc/Permissions.xhtml
in its entirety can be found online at:
Information about reproducing this article in parts (figures, tables) or
Reprints
http://www.aappublications.org/site/misc/reprints.xhtml
DOI: 10.1542/peds.100.4.654
1997;100;654
Pediatrics
Robert S. Byrd, Michael Weitzman and Peggy Auinger
School Progress
Increased Behavior Problems Associated With Delayed School Entry and Delayed
http://pediatrics.aappublications.org/content/100/4/654
located on the World Wide Web at:
The online version of this article, along with updated information and services, is
by the American Academy of Pediatrics. All rights reserved. Print ISSN: 1073-0397.