Diksha Saitwal et al. J Sci Res Pharm, 2019;8(7):75-84 World Inventia Publishers
J
ournal of
S
cientific
R
esearch in
P
harmacy
http://www.jsrponline.com/
Vol. 8, Issue 7, 2019 ISSN: 2277-9469 USA CODEN: JSRPCJ
Research Article
FORMULATION AND EVALUATION OF COLON TARGETED SULFASALAZINE MICROSPHERES Diksha Saitwal *, Dr Surajj Sarode, Dr. S.D. Barhate
Shree Sureshdada Jain Institute of Pharmaceutical Education and Research, Jamner. (424206), INDIA.
Received on: 24-05-2019; Revised and Accepted on: 09-07-2019
ABSTRACT
S
ulfasalazine is an anti-inflammatory drug used in the treatment of ulcerative colitis. It is metabolised in colon by the bacterial enzyme azoreductase to sulfapyridine and 5-amino salicylic acid. It is rapidly absorbed in the intestine, hence it is necessary to develop colon targeted drug delivery system. Sulfasalazine releases 5-ASA which decreases the inflammation of intestine & thus helpful in ulcerative colitis. The main objective of the present research is formulated and evaluated colon targeted sulfasalazine microspheres by emulsion solvent evaporation method by using 2-factor central composite design. Optimized formulation S2 showed highest drug release (92.36%) at the end of 12 hours, maximum entrapment efficiency (91.27%) and particle size was in acceptable range (64.1 to 74.5 µm) at medium level of concentration of eudragit s 100 (1000mg) and concentration of span 80 (1%). FT-IR and DSC study indicates that drug is compatible with excipients and there is no interaction between them. The release kinetics of optimized formulation shows first order release followed by non-fickian diffusion.KEYWORDS: Emulsion solvent evaporation method, Sulfasalazine, Microspheres, Eudragit S100 and Span 80.
INTRODUCTION
P
harmaceutical invention and research areincreasingly focusing on delivery system which enhances desirable therapeutic objectives while minimising side effects. The last two decades, there has been a remarkable improvement in the field of novel drug delivery system. Nowadays, a new approach has been made of delivering a drug directly into the colon without exposure in the upper GI tract. These are known as colon targeted drug delivery system. Microspheres are the novel drug delivery system & played vital role in the development of sustained and controlled release drug delivery system. Sulfasalazine is an anti-inflammatory drug used to treat inflammatory bowel disease, such as
ulcerative colitis and mild-to-moderate Crohn's disease.
Ulcerative colitis affects the innermost lining of large intestine (colon) and rectum. Small ulcers can develop on the colon’s lining and can bleed and produce pus. Multi-particulate drug delivery system such as microspheres for colonic delivery shows several advantages over single unit dosage forms. Being a smaller size, it is expected to provide less inter and intra
* Corresponding author: Diksha Saitwal
Shree Sureshdada Jain Institute of Pharmaceutical Education and Research, Jamner. (424206), INDIA.
* E-Mail: [email protected]
DOI: https://doi.org/10.5281/zenodo.3370363
individual variability, more rapid and uniform gastric emptying, more uniform dispersion and reproducible transit through GI tract. In multi-particulate delivery systems, it is challenging to develop a colon-targeted sustained release dosage form.
MATERIALS AND METHODS
S
ulfasalazine was obtained as gift sample from JiuzhouPharmaceutical co. Ltd., China. Eudragit S 100, Span 80, Ethanol, Liquid Paraffin, Dibutyl Pthalate were purchased from Jinendra Scientific Pvt. Ltd , Jalgaon.
Preparation of Sulfasalazine Microspheres:
Table No. 1: Formulation of preliminary Trial Batches of Sulfasalazine Microspheres
Ingredients Formulation Batches
F1 F2 F3 F4 F5
Sulfasalazine (mg) 500 500 500 500 500 Eudragit S100 (mg) 500 1000 1500 2000 2500
Span 80 (%) 0.5 1 1.5 0.5 1
Liquid Paraffin (ml) 25 25 25 25 25
Dibutyl Pthalate (ml) q.s q.s q.s q.s q.s Ethanol (ml) q.s. q.s. q.s. q.s. q.s. Formulation of colon targeted sulfasalazine microspheres by 2 Factor Central Composite Design
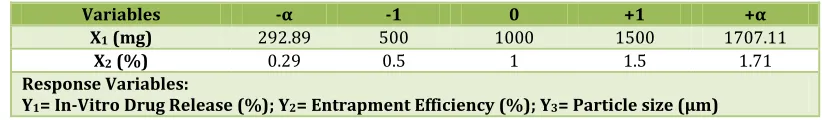
Table No. 2: Formulation Variables with their actual coded values
Variables -α -1 0 +1 +α
X1 (mg) 292.89 500 1000 1500 1707.11
X2 (%) 0.29 0.5 1 1.5 1.71
Response Variables:
Y1= In-Vitro Drug Release (%); Y2= Entrapment Efficiency (%); Y3= Particle size (µm)
Table No. 3: Formulation of Optimized Batches of Sulfasalazine Microspheres
Ingredients Formulation Batches
S1 S2 S3 S4 S5 S6 S7 S8 S9
Sulfasalazine (mg) 500 500 500 500 500 500 500 500 500 Eudragit S100 (mg) 1500 1000 1707.11 500 500 1500 292.89 1000 1000
Span 80 (%) 0.5 1 1 1.5 0.5 1.5 1 1.71 0.29
Liquid Paraffin (ml) 25 25 25 25 25 25 25 25 25
Dibutyl Pthalate (ml) q.s q.s q.s q.s q.s q.s q.s q.s q.s Ethanol (ml) q.s q.s q.s q.s q.s q.s q.s q.s q.s
Characterization of Sulfasalazine Microspheres: 1. Drug Polymer Interaction Study:
a. DSC Spectra Study: It measures the amount of energy absorbed or released by a sample when it is heated or cooled, providing quantitative and qualitative data on endothermic (heat absorbed) and exothermic (heat released) processes.
b. FT-IR Spectra Study: FT-IR identifies chemical bonds in a molecule by producing an infrared absorption spectrum. The spectra produce a profile of the sample , a distinctive molecular fingerprint that can be used to screen and scan the samples for many different components.
2. Particle Size:
Particle size of the microspheres was determined by using optical microscope fitted with a calibrated eyepiece micrometer.
3. Micromeritics properties of Microspheres:
a. Bulk Density and Tapped Density: Bulk density and tapped density was calculated by using following formula,
Bulk Density = Weight of sample(g)/ Bulk volume(ml)
Tapped Density = Weight of sample(g) / Tapped Volume(ml)
b. Compressibility Index (Carr’s Index): Compressibility index (C.I) is an important measure that can be obtained from bulk and tapped densities. C.I. is calculated by using following formula,
Carr’s Index =(Tapped density–Bulk density/Tapped density)×100
c. Hausner’s Ratio: It indicates the flow properties of the powder and is measured by the ratio of tapped density to bulk density.
Hausner’s Ratio= Tapped Density / Bulk Density
d. Angle of Repose: Angle of repose was calculated by fixed funnel method. Angle of repose was calculated by using following formula,
θ = tan-1(h/r)
Where,
h= height, r= radius , θ = angle of repose
4. Percent Yield of Microspheres:
Thoroughly dried microspheres were collected and weighed accurately. The actual weight of microspheres divided by the total amount of all material that involved in the preparation of microspheres was calculated.
% yield = (Practical yield / Theoretical yield) ×100
5. Entrapment Efficiency:
Microspheres containing equivalent to 10 mg of drug was crushed in glass mortar and pestle and allowed to equilibrate in 100 ml of phosphate buffer pH 7.4for 24 hr. the solution was filtered using whatman filter paper. The resulting solution was analysed using an ultraviolet spectrophotometric method at 359 nm in the presence of blank.
6. In-Vitro Dissolution Studies:
In vitro drug release study were conducted in 0.1N HCL for 2 hours, next 3 hour in phosphate buffer pH 6.8 and phosphate buffer PH 7.4 up to 12 hours using USP dissolution apparatus type II ( Paddle type) under sink condition. Accurately weighed samples of microspheres were added to dissolution medium and temprature was maintained at 37 °c ±0.5°C and fluid was agitated at 100 rpm. An adequate sample was withdrawn every one hour and replaced with equal quantity of fluid and maintain constant volume. After suitable dilution, the sample withdrawn were analysed at 359 nm.
7. Release Kinetics:
Drug release kinetics is the application of mathematical model to the drug release process. Data obtained from in vitro release studies were fitted to various kinetics equations (zero order, first order, Higuchi and Peppas model) to find out the mechanism of drug release from microspheres.
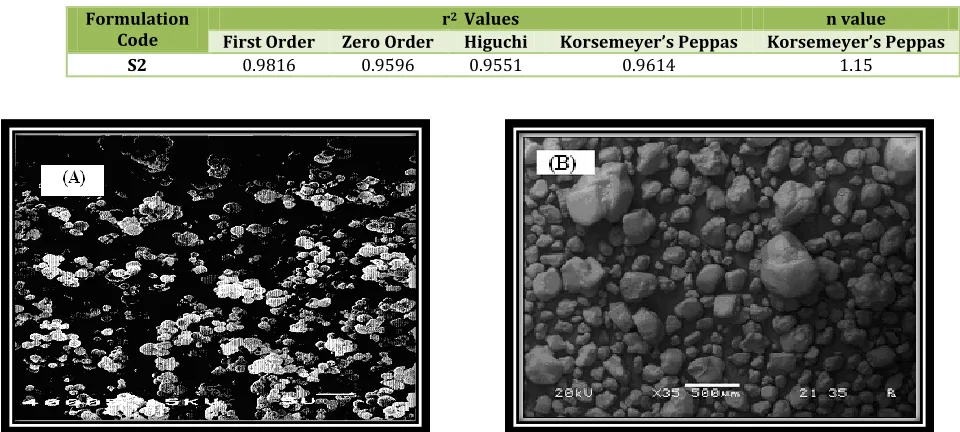
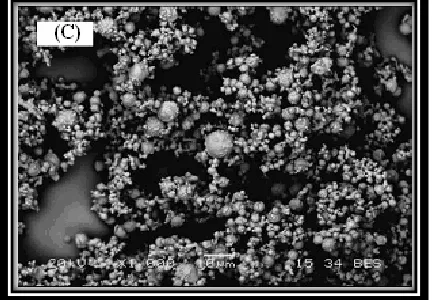
8. Scanning Electron Microscopy:
A Scanning Electron Microscope (SEM) uses a focussed beam of electrons to create a magnified image of a sample. The electron beam is scanned in a regular pattern across the surface of the sample and the electrons that come out of the sample are used to create the image. The microspheres were spread on a double-sided adhesive plate one side of which was stuck to a glass slide. Excess microspheres were removed and the slide was kept on the sample holder and the scanning electron micrographs were taken using an electron microscope. The photomicrograph was taken with the help of SEM analyser.
9. Stability Study:
The microspheres were charged for the accelerated stability studies according to ICH guidelines (40±2°C and 75 ± 5% RH) for a period of 1 month in a stability chamber. Microspheres were placed in screw capped glass container and the sample was withdrawn after 1 month and evaluated for drug release, entrapment efficiency and percent yield.
RESULT AND DISCUSSION
D
SC of pure sulfasalazine shows characteristic, sharpendothermic peak at 260°C which is associated melting point of drug. The thermogram of physical mixture of Sulfasalazine indicated that there is no interaction between the drug & excipients used in the formulation & they are compatible each other (Fig. 1 & 2).
The FTIR spectra of physical mixture did not show any significant difference from those for the pure drug. These results
clearly indicate the usefulness of the utilized polymer for the preparation of Microspheres of sulfasalazine. Hence, it shows that no incompatibility reaction took place between drug and polymer (Fig. 3).
The λmax of the drug was determined by scanning 10
µg/ml solution concentration in the range of 200-400 nm using
UV spectrophotometer. The λmax of the drug was found to be
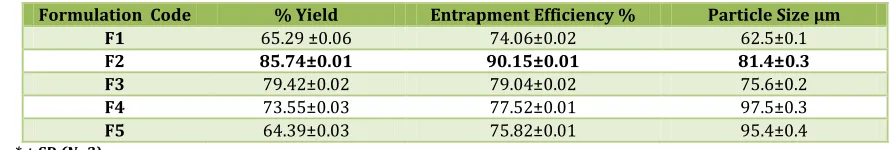
359nm (Fig. 4). From the above result it was observed that formulation F2 showed high entrapment efficiency due to increase in the concentration of polymer. As the concentration of span 80 increases then decreased in entrapment efficiency was observed in other batches. Particle size of the microspheres was found in the range i.e 62.5±0.1 to 97.5±0.1. particle size of the microspheres increases as polymer concentration increases because increase in the viscosity of polymer which results in formation of larger emulsion droplet which results in larger size of microspheres. F2 showed 85.74±0.01% yield which is highest in all batches. From the result formulation F2 was selected as best batch (Table 4).
From the above result it showed that drug release from the microspheres in acidic medium was slow or negligible in comparison to an alkaline medium. Slight increase in drug release was observed when pH changes from 6.8 to 7.4. Below the pH of polymer solubility slow drug release was observed. At the end of 12 hr formulation F2 showed maximum drug release among all batches. And hence from the result it was concluded that formulation F2 is the best batch among all (Table 5 & Fig. 5).
From the above result it was shown that formulation S2 showed maximum entrapment efficiency and percent yield among all batches. As polymer concentration increases entrapment efficiency increases up to certain limit. Particle size of all formulation was found in range i.e. 64.1±0.1 to 74.5±0.1. Hence Formulation S2 selected as a best batch among other
batches (Table 6).
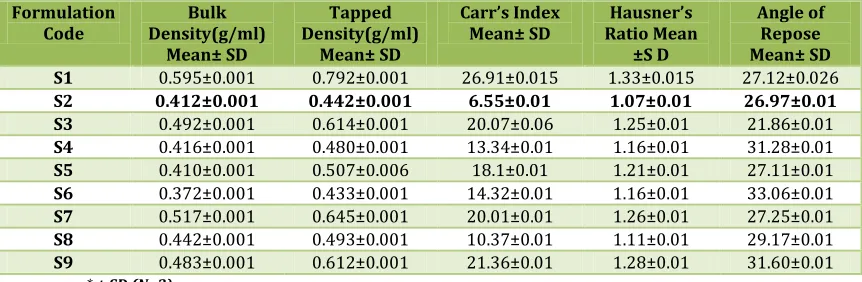
From the above result it was showed that formulation S2 showed excellent flow properties of the microspheres (Table 7).
From the above result, optimized formulation shows
first order drug release kinetics having r2 value 0.9816. Hence it
shows that the release of drug take place in sustained manner. The n value (1.15)from the Korsemeyer’s Peppas shows that the release mechanism of drug release and it shows that the optimizes formulation follow anomalous non-fickian diffusion (Table 8).
Fig. 2: DSC Thermogram of physical mixture
Fig. 3: FT-IR Spectra of physical mixture(Sulfasalazine +Eudragit S100)
Fig. 4: UV-Spectrum of Sulfasalazine
Table No. 4: Evaluation Parameter for Preliminary Trial Batches of Sulfasalazine Microspheres
Formulation Code % Yield Entrapment Efficiency % Particle Size µm
F1 65.29 ±0.06 74.06±0.02 62.5±0.1
F2 85.74±0.01 90.15±0.01 81.4±0.3
F3 79.42±0.02 79.04±0.02 75.6±0.2
F4 73.55±0.03 77.52±0.01 97.5±0.3
F5 64.39±0.03 75.82±0.01 95.4±0.4
* ± SD (N=3)
400 500 600 700 800 900 1000 1100 1200 1300 1400 1500 1600 1700 1800 1900 2000 2200 2400 2600 2800 3000 3200 3400 3600 3800 4000 cm-1 50.0 52.5 55.0 57.5 60.0 62.5 65.0 67.5 70.0 72.5 75.0 77.5 80.0 82.5 85.0 87.5 90.0 92.5 95.0 97.5 100.0 102.5 %T 31 34 .3 3 30 24 .3 8 29 49 .1 6 28 25 .7
2 2763.99
17
24
.3
6 1676
.1 4 16 33 .7 1 16 14 .4 2 15 85 .4 9 15 35 .3 4 14 83 .2 6 14 62 .0
41433
.1 1 13 92 .6 1 13 55 .9 6 12 59 .5 2 11 93 .9 4 11 70 .7 9 11 26 .4 3 10 78 .2 1 99 9. 13 96 4. 41 84 2. 89 79 2. 74 76 5. 74 72 7. 16 70 5.
95 663.51
61 3. 36 57 0. 93 51 8. 85 44 3. 63
Sample S + ES
Table No. 5: Micromeritics Properties of Preliminary Trial Batches of Sulfasalazine Microspheres
Formulation
Code Density(g/ml) Bulk Density(g/ml) Tapped Compresibility Index (%) Hausner’s Ratio Angle of Repose
F1 0.514±0.001 0.643±0.001 20.07±0.01 1.25±0.01 22.93±0.01
F2 0.522±0.002 0.548±0.001 5.11±0.01 1.03±0.01 20.12±0.01
F3 0.582±0.001 0.661±0.001 12.35±0.01 1.12±0.02 35.54±0.01
F4 0.586±0.002 0.688±0.002 14.84±0.02 1.19±0.02 25.82±0.02
F5 0.420±0.001 0.514±0.002 18.15±0.02 1.23±0.01 23.83±0.01
* ± SD (N=3)
Fig. 5: Comparative In-Vitro Drug Release Study of Preliminary Trial Batches of Colon Targeted Microspheres of Sulfasalazine (Batch F1-F5)
Optimized Batches of Sulfasalazine Microspheres:
Table No. 6: Evaluation Parameter of Optimized Batches of Sulfasalazine Microspheres
Formulation
Code % Yield Mean ±SD Entrapment Efficiency (%) Mean ±SD Particle Size (µm) Mean± SD
S1 84.37±0.04 83.92±0.01 67.6±0.2
S2 86.23±0.01 91.27±0.01 74.5±0.1
S3 82.66±0.01 77.42±0.02 68.6±0.1
S4 77.05±0.02 64.51±0.01 71.5±0.1
S5 83.08±0.06 71.92±0.03 69.5±0.1
S6 78.53±0.01 70.38±0.2 64.5±0.2
S7 72.25±0.02 79.4±0.01 73.5±0.3
S8 79.12±0.03 72.51±0.03 65.5±0.1
S9 69.29±0.01 82.43±0.01 64.5±0.2
* ± SD (N=3)
Table No. 7: Micromeritics Properties of Optimized Batches of Sulfasalazine Microspheres
Formulation
Code Density(g/ml) Bulk Mean± SD
Tapped Density(g/ml)
Mean± SD
Carr’s Index
Mean± SD Ratio Mean Hausner’s ±S D
Angle of Repose Mean± SD
S1 0.595±0.001 0.792±0.001 26.91±0.015 1.33±0.015 27.12±0.026
S2 0.412±0.001 0.442±0.001 6.55±0.01 1.07±0.01 26.97±0.01
S3 0.492±0.001 0.614±0.001 20.07±0.06 1.25±0.01 21.86±0.01
S4 0.416±0.001 0.480±0.001 13.34±0.01 1.16±0.01 31.28±0.01
S5 0.410±0.001 0.507±0.006 18.1±0.01 1.21±0.01 27.11±0.01
S6 0.372±0.001 0.433±0.001 14.32±0.01 1.16±0.01 33.06±0.01
S7 0.517±0.001 0.645±0.001 20.01±0.01 1.26±0.01 27.25±0.01
S8 0.442±0.001 0.493±0.001 10.37±0.01 1.11±0.01 29.17±0.01
S9 0.483±0.001 0.612±0.001 21.36±0.01 1.28±0.01 31.60±0.01
Fig. 6: Comparative In Vitro Drug Release Study of Optimized Batches of Sulfasalazine Microspheres (S1-S9)
Fig. 7: Drug Release Kinetics Study
Table No. 8: Kinetic Data of Optimized Sulfasalazine Microspheres
Formulation
Code r
2 Values n value
First Order Zero Order Higuchi Korsemeyer’s Peppas Korsemeyer’s Peppas
S2 0.9816 0.9596 0.9551 0.9614 1.15
Fig. 9: SEM Image of Optimized Sulfasalazine Microspheres
Optimization and Data Analysis:
During these batches it found that these selected independent variables had a great influence on drug release, entrapment efficiency and particle size of microspheres and hence decided to select as an independent variables. On the basis of these preliminary trials 2 Factor Central Composite Design was employed to study the effect of independent variable i.e concentration of Eudragit S100 (X1) and concentration of span 80 (X2) on dependent variables i.e. In Vitro Drug Release (Y1), Entrapment Efficiency (Y2) and Particle Size (Y3). 2D and 3D response surface plots were constructed to study the main and interaction effects between factors and responses. Analysis and Optimization were done by Design Expert Software (version 7.1.5, State- Ease Inc, Minneapolis, USA).
Optimization of Dependent Variables: Response 1 (In- Vitro Drug Release):
The maximum drug release was observed at the medium level of polymer and surfactant concentration. The pH dependent drug release was observed when the pH changes from 6.8 to 7.5 at the end of 12 hr. Drug release is increases when the surfactant concentration is at optimum level. On applying Central Composite Design, quadratic model suggested by software and found that model F value 197.39 implies the model is significant. There is only a 0.01% chance that a Model F-Value” this large could occur due to noise. Value of “Prof>F” less than 0.0500 indicate model terms are significant.
Following polynomial equation could describe the % drug release response,
Y1= +92.36+1.79X1-0.26X2-1.18X1X2-2.15X12-2.39X22
From the above regression equation, negative (-) value of X1 (Eudragit S100) indicate inverse relationship with response Y1(In Vitro drug release) while positive(+) value of X2(Span80) indicate direct relationship with response Y1(In Vitro drug release). That is % Drug release increases with decrease in Eudragit S100 concentration and decreases with decreases in span 80 concentrations.
The contour and 3D response plots shows the combined effect of concentration of eudragit s100 and span 80 on % drug release. These plots are valuable to study the interaction effects of the independent variables X1 and X2 on the response. Hence the span 80 concentration had more significant positive effect on response Y1. Formulation S1
contain medium amount of eudragit s 100 and span 80 which shows the highest drug release at the end of 12 hr.
Response Y2 (Entrapment Efficiency):
Entrapment efficiency is the percentage of drug that is successfully entrapped within microspheres. The entrapment efficiency of the microsphere increases as the concentration of polymer increases. Highest entrapment efficiency was observed at medium level of polymer and surfactant concentration.
The model F value of 11.91 implies the model is significant. There is only 0.26% chance that Model F-Value” this large could occur due to noise. Value of “Prob>F” less than
0.0500 indicate model terms are significant. In this case X2, X12
and X22 are significant model terms. Values greater than 0.1000
indicate the model terms are not significant.
Following polynomial equation could describe the entrapment efficiency response,
Y2 = +91.27+1.88 X1-4.37 X2-1.53 X1X2-7.74 X12-8.22 X22
From the above regression equation, positive (+) sign of X1 (eudragit s 100) indicate that factor X1 has positive effect on response Y2 (entrapment efficiency) and negative (-) sign of X2 (span 80) indicate that factor X2 has negative effect on response Y2 (entrapment efficiency). That is entrapment efficiency increases with increase in concentration of eudragit s 100.
Response Y3 (Particle Size):
These responses revealed that all these formulations yielded acceptable particle size for the developed microspheres formulation and observed range was 64.1 to 74.5 µm. The model F value of 141.76 implies the model is significant. There is only 0.01% chance that “Model- F Value” this large could occur due to noise. Value of “Prob>F” less than 0.0500 indicate
model terms are significant. In this case X1, X1X2, X12 and X22
are significant model terms. Value greater than 0.1000 indicate the model terms are not significant.
Following polynomial equation could describe the particle size response,
Y3 = +74.50–1.95 X1+0.078 X2-1.12 X1X2-1.69 X12-4.81X22
80) for response Y3 (particle size) represent an effect that favours the optimization. That is particle size increases with increase in the concentration of X1 (span 80) and decreases with increases in the concentration of X1 (eudragit s100).
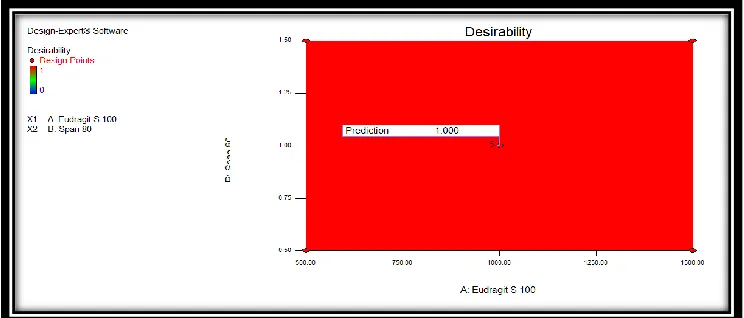
The optimized formulation was chosen based on the condition of achieving the particle size within observed range, maximum drug entrapment efficiency and maximum % drug release.
Fig. 10: Contour Plot for Desirability of Optimized Formulation S2
Fig. 11: Response Surface Plot for % DR of Optimized Formulation S2
Fig. 13: Response Surface Plot for Particle Size (µm) of Optimized Formulation S2
Fig. 14: Overlay Plot of Optimized Formulation (S2) of Sulfasalazine Microspheres
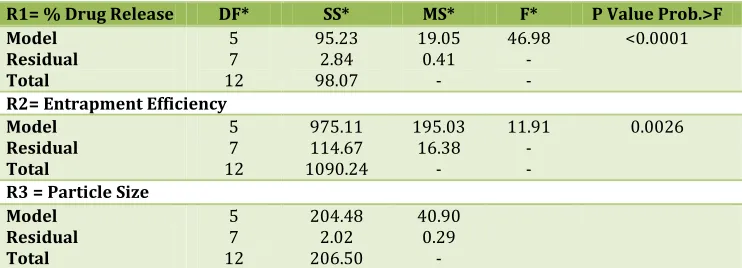
Table No. 9: Results of Analysis of Variance (ANOVA) for Central Composite Design Batches of Colon Targeted Sulfasalazine Microspheres
R1= % Drug Release DF* SS* MS* F* P Value Prob.>F Model
Residual Total
5 7 12
95.23 2.84 98.07
19.05 0.41
-
46.98 - -
<0.0001
R2= Entrapment Efficiency Model
Residual Total
5 7 12
975.11 114.67 1090.24
195.03 16.38
-
11.91 - -
0.0026
R3 = Particle Size Model
Residual Total
5 7 12
204.48 2.02 206.50
40.90 0.29
-
* DF indicates degree of freedom, SS sum of square, MS mean sum of square, F Fischer’s ratio and model P value less than 0.05 indicate the significance of model term.
Table No. 10: Stability Study of Optimized Batch
Evaluation Parameter Optimized Batch S2
Intial After Storage at 40°c /75%RH for 1 month % Drug Release at end of 12 hr 92.36 91.45
% Entrapment Efficiency 91.27 90.18
% yield 86.23 85.52
CONCLUSION
T
he present study reports the development of colontargeted sulfasalazine microspheres by emulsion solvent
concentration of span 80(1%). From the FT-IR and DSC studies it is concluded that the drug is compatible with excipients and there is no interaction between them. The release kinetics of optimized formulation shows first order release with followed by non-fickian diffusion. Results of overall studies demonstrated that microspheres are capable of sustaining the release of sulfasalazine until it reaches colon. Hence from the present study it was concluded that the sulfasalazine microspheres were successfully prepared for colon targeting.
ACKNOWLEDGEMENT
T
he authors would like to thanks Shree. SureshdadaJain Institute of Pharmaceutical Education and Research, Jamner for providing the adequate facility to carrying out this work.
REFERENCES:
1. Chakradhari Manish Kumar, Sharma Anurag, Agrawal
Dilip, Khinchi MP, Sharma Natasha, Gupta MK. Colon Targeting Microspheres : A Review. Asian J Pharm Edu & Res 2012;1(2): 16-30.
2. Kolte Bhushan Prabhakar, Tele Kalyani V, Mundhe
Vinayak S, Lahoti Sandeep S. Colon Targeted Drug Delivery System-A Novel Perspective. Asian J Biomed & Pharm Sci 2012;2(14):21-28.
3. Kadam NR, V. Suvarna. Microspheres: A Brief Review.
Asian J Biomed & Pharm Sci 2015;5(47):13-19.
4. Goutam Kumar Jena, Sunit Kumar Sahoo, Ch. Niranjan
Patra, Kahnu Charan Panigrahi, Swatilekha Sahu, Prasanna Kumar Dixit. Design, Optimization and
Evaluation of Capecitabine-loaded Chitosan
Microspheres for Colon Targeting. Asian J Pharm 2017; 11(3):S592.
5. R. Deveswaran, Katta Rajesh, S. Bharath, BV. Basavaraj.
Development of Mesalazine Microspheres for Colon Targeting. Int J Appl Pharm 2017;9(4):1-9.
6. Sanka Krishna, Veerareddy Vaishnavi, Athukuri Swetha,
Bakshi Vasudha. Formulation and Optimization of Flurbiprofen Loaded Eudragit S100 Delayed Release Colon Specific Microspheres using Box- Behnken Experimental Design. Der Pharmacia Letter 2016;8(21): 7-18.
7. Deore Kishori L, Thombre Nilima A, Gide Parag S.
Formulation and Development of Tinidazole
Microspheres for Colon Targeted Drug Delivery System. J Pharm Res 2013;158-165.
8. British Pharmacopoeia, The Department of Health, Social
Service and Public Safety, British Pharmacopoeia Commission Office, London, 2009;2:1947-1949.
9. http://www.webmd.com/drugs/2/drug-6260/sulfasalazine-oral/details
10. Sean C Sweetman. Martindale The Complete Drug
Reference, Thirty Fourth Edition , Published by Pharmaceutical Press, 2005; pp. 1291-1292.
11. Raymond C Rowe, Paul J Sheskey. Handbook of
Pharmaceutical Excipient, Sixth Edition, Pharmaceutical Press and American Pharmacist Association, 2009.
12. Maryadele J.O Nell, Ann Smith, Patricia E, Heckelman,
John R. Obenchain, Jo Ann D, Arecca and Susan Budavari. The Merck Index- An Encyclopedia of Chemicals, Drugs and Biologicals, Thirteenth Edition, Merck Research Laboratories Division of Merck and Co.INC, Whitehouse, NJ, 2001; 9028, 7267 and 8796.
13. Brahmankar DM, Jaiswal SB. Biopharmaceutics and
Pharmacokinetics A Treatise. Third edition, Vallabh Prakashan, Delhi. 2015; pp. 435-436.
14. Gary L. Lampman, Donald L. Pavia, George Kriz Vyan.
Spectroscopy, Fourth edition, Department of Chemistry Western Washington University, Bellingham, 15-87.
15. Naik Jitendra B, Waghulde Mrunal R.
Poly-e-caprolactone-loaded Miglitol Microspheres for the Treatment of Type-2Diabetes Mellitus using Response Surface Methodology. J Taibah University Med Sci 2016; 11(4):364-373.
How to cite this article:
Diksha Saitwal, et al. FORMULATION AND EVALUATION OF COLON TARGETED SULFASALAZINE MICROSPHERES. J Sci Res Pharm
2019;8(7):75-84. DOI: https://doi.org/10.5281/zenodo.3370363
Conflict of interest: The authors have declared that no conflict of interest exists.