PETFEN: A Performance Evaluation Tool for Flow-Level
Network Modeling of Ethernet Networks
Fabien Geyer
1,2Stefan Schneele
1Georg Carle
21Airbus Group Innovations 2Technische Universität München
Dept. TX4CP Institut für Informatik, I-8
D-81663 München, Germany D-85748 Garching b. München, Germany
{fabien.geyer, stefan.schneele}@airbus.com
[email protected]
ABSTRACT
We present in this paper PETFEN, a Performance Evalua-tion Tool for Flow-level network modeling of Ethernet Net-works. Flow-level network models are a useful tool to di-mension and predict various performances of networks with TCP and UDP flows, providing information such as mean flow bandwidths, link utilizations or queue sizes. While the literature on flow-level network models is extensive, there is still a lack of tools for numerical evaluations on user pro-vided topologies. In this paper, we describe the three com-ponents of PETFEN: (i) an effective domain specific lan-guage used for algorithmically describing topologies,(ii)a mathematical toolbox for the numerical evaluation of flow-level network models on the provided topologies,(iii) mod-ules for the evaluation of the topologies with external tools. Via various numerical evaluations, we compare the results of PETFEN with results of SimGrid, another tool based on flow-level network models, as well as results of the discrete event simulator OMNeT++.
Categories and Subject Descriptors
I.6 [Computing Methodologies]: Simulation and Model-ing; C.2 [Computer Systems Organization]: Computer-Communication Networks
General Terms
Theory, Measurement, Performance
Keywords
Flow-level network modeling, Network traffic modeling, Per-formance evaluation
1.
INTRODUCTION
While tools for performance evaluation of networks with TCP or UDP flows are abundant, they are generally based on packet-level discrete event simulation, with only a few tools using flow-level network models. The use of flow-level
models has risen with the recent need of scalability for the evaluation of large networks, where traditional simulators are too slow to cope with the large number of nodes, such as for instance grid networks. Mathematical models of network also enable research to better understand, adjust and opti-mize the behavior and performance of network protocols.
We propose here a tool with the following goals: (i)provide a convenient way to describe Ethernet topologies and flows which is human writable and readable, while enabling re-searchers to perform parameter studies in the most flexible way; (ii) evaluate those topologies with the so-called flow-level network mathematical modeling framework described later in Section 3,(iii)provide a convenient way to compare numerical evaluations of mathematical models with other tools, such as discrete event simulators or emulators. This paper presents PETFEN, our solution for achieving those goals. PETFEN was programmed in Java, and uses a special Lisp-based domain specific language to describe and gener-ate network topologies and flows procedurally.
This work is structured as follows. In Section 2, we present related work. Section 3 presents partially the mathematical models used by PETFEN. Section 4 gives an overview of the internal architecture of the tool. With Section 5, we present the main interface of PETFEN, namely its dedicated domain specific language for describing topologies. In Section 6, we compare PETFEN with another similar tool as well as the results of the discrete event simulator OMNeT++. Finally Section 7 summarizes and concludes our work.
2.
RELATED WORK
We present here the few tools using flow-level network mod-els. To the best of our knowledge, there are no other avail-able tool using similar mathematical models for modeling a network.
OptorSim [5] is a tool designed to study data replication on grids, where communications are modeled using a flawed fair bandwidth sharing. As noted by the authors themselves, and documented in the BUGS file of the OptorSim distri-bution, the implemented bandwidth sharing give too pes-simistic results on networks with more than one bottleneck.
SimGrid [8] is a more general tool for the study of grids. Various mathematical models of flow-level networks can be used, the default one being a modified max-min bandwidth sharing fitted to grid networks [19], which supports the effect 3HUPLVVLRQWRPDNHGLJLWDORUKDUGFRSLHVRIDOORUSDUWRIWKLVZRUNIRU
SHUVRQDORUFODVVURRPXVHLVJUDQWHGZLWKRXWIHHSURYLGHGWKDWFRSLHV DUHQRWPDGHRUGLVWULEXWHGIRUSURILWRUFRPPHUFLDODGYDQWDJHDQGWKDW FRSLHVEHDUWKLVQRWLFHDQGWKHIXOOFLWDWLRQRQWKHILUVWSDJH7RFRS\ RWKHUZLVHWRUHSXEOLVKWRSRVWRQVHUYHUVRUWRUHGLVWULEXWHWROLVWV UHTXLUHVSULRUVSHFLILFSHUPLVVLRQDQGRUDIHH
9$/8(722/6'HFHPEHU%UDWLVODYD6ORYDNLD &RS\ULJKWk,&67
'2,LFVWYDOXHWRROV
Tool Mathematical Model Results Par. study Cr. traff. Sched. Int. w/ other tools
OptorSim [5] Fair sharing with bug Traces No flex.
SimGrid [8] B:[15] (max-min), D:[19] Traces Some flex. GTNetS, ns3
fs [18] B:[7, 16] Traces No flex.
PETFEN B:[7, 17], D:[10, 11] Mean perf. High flex. OMNeT++, ns2, mininet
Table 1: Comparison of existing tool using flow-level network modeling. Abbreviations used: “perf.”= per-formances,“B:”= Base model,“D:”= Detailed model,“Par. study”= Parameter study,“flex.”= flexiblility, “Cr. traff”= Cross traffic modeling,“Sched.”= Packet scheduling modeling,“Int. w/”= Interaction with.
of cross-traffic on TCP. Results of SimGrid for the evalua-tion of TCP flows were shown to be accurate in [19]. Like PETFEN, it also includes modules for interacting with ex-ternal tools (ns3 and GTNetS).
fs [18] was proposed more recently, with the goal of gener-ating representative flow export records of various applica-tions, with also a focus on scalability. While using a similar approach than ours, fs requires the user to predefine the packet drop probability of flow, which in case of Ethernet networks is not straightforward.
While those tools propose some interesting features, we found that they do not meet all of our requirements for the study of Ethernet networks, namely: (i)no tool supports packet-level scheduling, nor the evaluation of queue sizes in switches,
(ii)parameter studies are often not flexible enough and re-quire computer generated configuration files to be really effi-cient,(iii)those tools can be viewed as simulators, meaning that the results they produce are based on traces of prede-fined or pseudo-random events, while we aim at having mean performances. Table 1 summarizes the comparison between the various tools.
3.
FLOW-LEVEL NETWORK MODELING
We present in this section the underlying mathematical mod-els used and implemented in PETFEN. We give here only a brief overview of how to model an Ethernet network with switches supporting a drop-tail policy, and with long-lived TCP flows. We refer to [10] for more details on the mathe-matical modeling.
Flow-level modeling is based on previous efforts on TCP packet-level models, where the throughput of a TCP connec-tion is defined as a funcconnec-tion of loss probability and round-trip time (RTT). The two prominent packet-level models are the so-called square-root formula [16], and the PFTK formula [17]. Using those packet-level models, flow-level models have been developed using fixed point evaluations in order to eval-uate the steady-state throughput of multiple TCP flows. We refer to [4, 6, 9, 12] for early work on the subject.
We target the performance evaluation of networks where entities communicate using standard Ethernet. Computers are connected through switches and communicate with each other either by using protocols on top of TCP, or by using fixed rate flows (streaming) which is considered here to be UDP based. For the scope of this paper, we consider that all communications are unicast and that the routing is static.
The network is composed of Ethernet switches functioning
on the principle of store-and-forward. Links between nodes of the network are standard Ethernet cables, and can have different link speed. As we study Ethernet LANs with low latencies, meaning networks where queuing delay has a large influence on end-to-end delays, we do not neglect queuing delay in switches. When discussing packet size and flow throughput in the rest of the paper, we consider them from the Ethernet point of view.
3.1
Flow-level network model
Our flow-level network model consists ofservers, which rep-resent queues of the network, as well asflows, which repre-sent communications between the nodes of the network.
We define a server as an entity receiving packets and for-warding them on a link. A server, noted hereskwithk∈N, is defined by the following parameters: Ck is the maxi-mum output bandwidth, Dk is an additional delay (which can be used to model propagation and processing delay),
Fk = {fn}k is the set of flows going through this server,
Qk the buffer size of the server as the result of the
func-tion HkQ(F) depending on a set of flows F, pk the drop probability of the server as the result of the functionHkp(F) depending on a set of flowsF. Details about the functions
HQ
k and Hkp depend on which model to use. The case of a
drop-tail queue is addressed in Section 3.3.
We define a flow as a sequence of packets sent from a par-ticular source to a parpar-ticular unicast destination of a spe-cific transport connection or media stream. A flow, noted here fi withi∈N, is defined by the following parameters:
Si ={sn}i the path of servers traversed by the flow from source to destination, andri the bandwidth of a flow at its source as the result of the functionρi(S) depending on the path of serversS. The definition ofρifor infinite TCP flow is addressed as an example in Section 3.2. We also define the throughput of a flow as the rate of successful messages delivered to the destination. According to this definition, if a protocol is specified by requests and replies, two flows have to be used. We also defineSi as the path which will be used for the reply packets offi.
Based on those parameters, we describe the behavior of a network using the axioms presented hereafter.
Axiom 1. The end-to-end drop rate e2ep of the path of
serversS is defined by:
e2ep(S) = 1−
k∈S
(1−pk) (1)
Axiom 2. The aggregated ingress bandwidth of server sk
is defined by the sum of bandwidth of the set of flows Fk traversing the server:
Binpk =
i∈Fk
[ri·(1−e2ep(U(Si, sk)))] (2)
whereU(Si, sk) corresponds to the set of servers the flow i traverses before reachingsk.
Axiom 3. The egress bandwidth of serverskis equal to:
Bout
k = (1−pk)·Binpk (3) and must satisfy the constraint:
Bout
k ≤Ck (4)
Axiom 4. The end-to-end delay e2eD of a frame of size
M along the set of servers S is defined by:
e2eD(S, M) =
k∈S
((M+Qk)·Ck+Dk) (5)
We account in Equation (5) for the forwarding time of the frame (M·Ck), the time needed to process the queue (Qk·Ck) as well as propagation and processing delay (Dk).
Axiom 5. The round-trip delay time for a flow with a
request frame of sizeMreq and a reply size ofMrsp is:
RT T(S, Mreq, Mrsp) =e2eD(S, Mreq) +e2eD(S, Mrsp) (6)
3.2
Long-lived TCP flow model
For this small overview, we consider here that TCP is used to transfer large data, meaning that we only account for the
congestion avoidance phase, and we call this type of flows
long-lived TCP flows.
We propose to use here a well-known TCP model based on TCP Reno. Other congestion-avoidance algorithms may be included following the same methodology. We defineW as the maximum window size of a TCP connection, in number of packets.
Axiom 6. In case of a network without loss (e2ep(S) =
0), the average bandwidth of TCP is limited by:
ρe2ep(S)=0(S) = RT T(S, MSS, MMSS·W
ACK) (7) with MSS the maximum segment size, W the maximum windows size andMACK size of a TCP ACK packet.
In case of packet loss, we use the bandwidth model devel-oped in [17], also known as the PFTK formula which mod-els the bandwidth of the TCP Reno protocol. We use here the approximated version of the PFTK formula, where the bandwidth of TCP connection is defined as the minimum of Equations (7) and (8).
MSS RT T2bp
3 +T0min
1,3
3bp
8
p(1 + 32p2) (8)
with p the drop probability, T0 the sender timeout delay, and b the number of packets that are acknowledged by a received ACK.
We note that whilefsuses a model similar to Equation (8), it lacks the part presented in Equation (7). For an increased accuracy, the bandwidth of the flow of acknowledgments has also to be taken into account. We refer to [10] for how to model such behavior. This approach has also been used in SimGrid, but not infs.
3.3
Drop-tail First-In-First-Out queue
With a drop-tail FIFO queue, packets are served in their order of arrival. When the queue has no more space avail-able for storing arriving packets, packets are simply dropped. The bandwidth available to the queue is notedCQ.
3.3.1 Packet drop function
Hp(F)We consider here that the queue drop packets as soon as the incoming bandwidth is superior to the allowed output bandwidth.
Axiom 7. The packet drop function of a drop-tail FIFO
queue is expressed as followed:
Hp(F) =
Binp−C Q+
Binp (9)
with[x]+=xifx≥0, and0otherwise.
Equation (9) guarantees thatBout≤CQas defined in Equa-tion (4).
3.3.2 Queue size function
Hq(F)We model the queue size as follows:
Axiom 8. The queue size function of a drop-tail FIFO
queue is expressed as followed:
Hq(F) = MQ ifBinp> CQ
maxqBout(q) = maxBout otherwise (10)
The queue is considered to be full (and equal to the maxi-mum buffer size MQ) when the incoming bandwidth is su-perior to the allowed output bandwidth. This is modeled by the first case of Equation (10). When the queue is not full, the queue size will depend on how many packets may be transfered by the flows. The queue size corresponds then to the maximum number of bits that has no impact on the bandwidth of the flows going through the queue. This is modeled by the second case of Equation (10).
3.4
Solving the model
As presented by our axioms previously listed, we have the following relation: flows react on network changes by ad-justing their packet sending rate, while the network reacts on flows by queuing and dropping packets.
The performance evaluation of the system is equivalent to finding the valuesQk,pkandriof the different servers and
flows which lead to an equilibrium or fixed point of the sys-tem described by the different axioms previously enumer-ated.
Algorithm 1 describes the procedure to find the equilibrium of the system. We distinguish two parts in the algorithm. The first part (lines 1 to 5) initializes the variablesQk, pk andri to 0. The second part (lines 6 to 13) evaluates the functions until the fixed point is reached.
While a proof of existence of an equilibrium point was al-ready given in [4], we define a safeguard function in order to avoid an infinite loop (line 12) in case an equilibrium can-not be reached. The simplest function to achieve this is to limit the number of iteration of the loop (line 6 to 13). An alternative way is to look at the evolution ofQk,pkandri, and determine if an equilibrium is reachable.
Algorithm 1Equilibrium algorithm
Require: Set of serversS
Require: Set of flowsF 1: for allk= 0 :|S|do
2: Qk←0 3: pk←0
4: for alli= 0 :|F|do
5: ri←0
6: whileequilibrium not reacheddo
7: for allk= 0 :|S|do
8: Qk←HkQ(Fk) 9: pk←Hkp(Fk) 10: for alli= 0 :|F|do
11: ri←ρi(Si)
12: safeguard() Function to avoid infinite loop
13: end while
4.
PETFEN GENERAL ARCHITECTURE
PETFEN is a Java based tool for the numerical evaluation of networks, using the mathematical tools and axioms pre-sented in Section 3. Its architecture can be divided into four parts, as presented in Figure 1. Classes for describ-ing an Ethernet topology and its attributes form its base: computer, network card, queue and scheduler. A topology corresponds to a graph of those classes. Additionally, there are classes for TCP and UDP flows, which use this graph for the routing. A topology can be created either directly by using the available Java API, or via a domain specific language as detailed later in Section 5.
This graph of objects representing the various elements of the network is used by the flow-level network modeling tool-box, which is our implementation in pure Java of the results presented in [10, 11], and briefly summarized in Section 3.
The graph is also used by various modules for interacting with external tools. Namely we developed modules for ns2 [3], OMNeT++/INET [2, 1], as well as experimental mod-ules for mininet [14] and SimGrid [8]. The modmod-ules handle the following tasks: (i)export of the topology and configu-ration of the flows sources and destinations for the external tool, (ii) execution of the external tool with the specified topology, (iii) import of the results of the tool for easier
External tool export and results
import
External tool
(ns2, mininet, OMNeT++, SimGrid)
Lisp-based Domain
Specific Language
PETFEN
Topology description base classes Flow-Level
Network Modeling Toolbox
Figure 1: Architecture of PETFEN
comparison with the results of the mathematical toolbox. This enables us to easily validate and compare the numeri-cal results from the mathematinumeri-cal toolbox against other well established methods and tools.
5.
PETFEN DSL AND SCRIPTING
In order to describe the studied topologies, tool creators generally use one of the following solutions: (i) a Graphi-cal User Interface (GUI),(ii)a markup language (ex: XML, JSON, CSV),(iii)a dedicated Application Programming In-terface (API),(iv)a Domain Specific Language (DSL). One important aspect of a tool is to enable so-called parameters studies, meaning that having a base network, researchers are generally interested into how it behaves when parameters change (ex: number of users using the network, or latency of a link). While the first two solutions can offer such capa-bility, they generally lack in term of flexibility. This is why we focused on the two last solutions for PETFEN.
As PETFEN is written in Java, we can take advantage of the Java Virtual Machine (JVM) and its interoperability with a variety of languages for defining a DSL. We chose to use Clojure [13] for this task, a functional Lisp dialect. Being a Lisp dialect, it enables us to have: (i)a compact programing and markup language which is easily understood and used, as shown in Section 5.1; (ii) the ability to define and use functions and macros, giving us great flexibility when doing parameters studies, as shown in Section 5.2.
5.1
Basic commands
PETFEN DSL is based on a few number of Clojure functions for describing a network topology and its flows.
1: (node <name> <o p t .>)
2: (l i n k <node 1> <node 2> <s p e e d> <o p t .>) 3: (tcpflow <name> <s o u r c e> <d e s t .> <o p t .>) 4: (udpflow <name> <s o u r c e> <d e s t .> <o p t .>) 5: (queue <o p t .>)
6: (scheduler <t y p e> <q u e u e 1> . . . <o p t .>)
Thanks to Clojure’s named keywords, options can be easily specified (notedopt. in the previous list). For example, for defining a drop-tail FIFO queue with a maximum number of 50 packets and a weight of 2, we have:
1: (queue : q t y p e DROPTAIL :K 50 :W 2 )
We describe below a small example of a dumbbell topology, as illustrated in Figure 2.
1: (node C l i e n t 1 ) (node C l i e n t 2 ) 2: (node S e r v e r 1 ) (node S e r v e r 2 )
Cli2
SW1 SW2
Srv1
Srv2
Cli1 TCP FlowF
1
TCP FlowF2
Variable latency
Figure 2: Dumbbell topology
3: (node S1 ) (node SW2)
5: (l i n k SW1 SW2 (Mbps 1 0 0 ) ) 6: (l i n k C l i e n t 1 SW1 (Mbps 1 0 0 ) ) 7: (l i n k C l i e n t 2 SW1 (Mbps 1 0 0 ) ) 8: (l i n k S e r v e r 1 SW2 (Mbps 1 0 0 ) ) 9: (l i n k S e r v e r 2 SW2 (Mbps 1 0 0 ) )
11: (tcpflow Flow1 C l i e n t 1 S e r v e r 1 ) 12: (tcpflow Flow2 C l i e n t 2 S e r v e r 2 )
5.2
Parameter studies and scripting
Thanks to the use of a full programing language for de-scribing the topologies, parameter studies can be easily done with PETFEN. Topologies can be procedurally constructed using any standard Clojure function. The example below describes the same dumbbell topology, but with a variable number of client/server pairs. With lines 1 to 12, we first write a function which generates a topology according to
N, the desired number of clients and servers. Lines 6 to 11 correspond to the loop generating theN clients, servers and flows. On line 12 that we trigger the evaluation of the generated topology, either with mathematical models or via external tools. Then with lines 14 and 15, we evaluate this function against the desired values ofN, here from 1 to 100.
1: (defn g e n e r a t e T o p o l o g y [N]
2: (newTopology (s t r ”Topology N=” N) )
4: (node SW1) (node SW2) 5: (l i n k SW1 SW2 (Mbps 1 0 0 ) ) 6: (dotimes [ i N]
7: (l e t [ c l i (node (s t r ” C l i e n t ” i ) ) 8: s r v (node (s t r ” S e r v e r ” i ) ) ] ) 9: (l i n k c l i SW1 (Mbps 1 0 0 ) )
10: (l i n k s r v SW2 (Mbps 1 0 0 ) )
11: (tcpflow (s t r ”Flow ” i ) c l i s r v ) ) 12: (performAnalysis) )
14: (doseq [N (range 1 1 0 0 ) ] 15: ( g e n e r a t e T o p o l o g y N) )
6.
EVALUATION
We present here an evaluation of PETFEN across various Ethernet topologies. As noted in Section 2, there are only a few tools to compare it with. We decided to focus on SimGrid1, as it is the only tool which also models the ef-fect of cross-traffic on TCP, and hence the one which is the most likely to give the most accurate results out of the other tools. In order to have a reference to which we can compare the analytical results of the two tools, we used the discrete event simulator OMNeT++/INET [2, 1]. We focus here on
1SimGrid 3.11.1 (2014-06-02 07:47), C version
OMNeT++ PETFEN SimGrid
0 25 50 75 100
2.5 5.0 7.5 10.0 2.5 5.0 7.5 10.0 2.5 5.0 7.5 10.0
Latency between SW1 and Srv2 (ms)
Throughput (Mbps)
Flow F1
F2
PETFEN SimGrid
0.0 0.5 1.0
20 40 60
2.5 5.0 7.5 2.5 5.0 7.5
Latency between SW1 and Srv2 (ms)
Relativ
e error (%)
Flow F1
F2
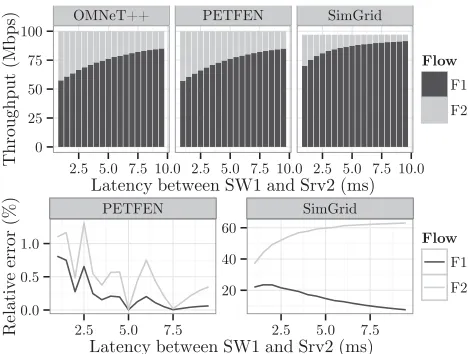
Figure 3: Bandwidth sharing between the two flows with different round-trip times and relative error with OMNeT++ as a reference
standard switched Ethernet networks, where switches use a drop-tail policy. We used the default values for SimGrid and created a scenario where large messages are sent, following the example located in the folder examples/msg/gtnetsof the SimGrid distribution.
We first look at the dumbbell topology presented in Figure 2, where the latency between SW2 and Srv2 varies between 1 ms and 10 ms. The results of the evaluation are presented in Figure 3. As expected, this topology is a good exam-ple to illustrate the unfairness of TCP regarding round-trip times. As queue sizes are not modeled in SimGrid, it gives large relative error compared to the simulations, as queue sizes largely influence round-trip times in Ethernet. PET-FEN, which models queue sizes, gives accurate results with a relative error between 0 and 1.5%.
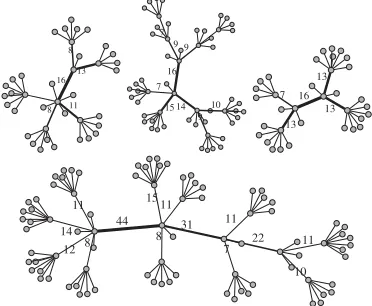
We then proceed to evaluating four randomly generated tree topologies as illustrated in Figure 4. The number of nodes and their links are taken randomly between two extremal values. Each node will then establish TCP communications with at least one random destination. Details about how those topologies were generated can be found in [10]. The results are presented in Figure 5, where we look at the rela-tive error between the analytical results and the OMNeT++ simulations. Those errors are comparable with the ones of the dumbbell topology. PETFEN gives results with a rela-tive error below 6% for all flows of the topologies. SimGrid gives error of up to 100%, leading us to the conclusion that SimGrid is more adapted to topologies where queuing delays can be ignored.
7.
CONCLUSION
We presented in this paper PETFEN, a Performance Evalu-ation Tool for Flow-level network modeling of Ethernet Net-works. While there are already some tools using flow-level modeling, PETFEN is the first one focusing on Ethernet networks and its particularities, such as taking into account queuing delays and packet-level scheduling algorithms.
16 8
13
11
8 14
7 15 16
9 10 9 9 7
13 13 16
13 7
22 11
7 31
11
10 15
44 8
11
12 11 14
8
Figure 4: Four randomly generated topologies. The width and the label of the edges represent the num-ber of TCP flows (for edges with more than 5 flows).
PETFEN SimGrid
0.01 1.00
1 10 100
0 20 40 60 0 20 40 60
Flow ID (ordered by increasing relative error)
Relativ
e error (%)
Topology 0 1 2 3
Figure 5: Relative error between the tools and OM-NeT++ on the tree topologies of Figure 4
We presented in this paper the mathematical framework be-hind PETFEN and its general architecture. Its domain spe-cific language based on a functional Lisp dialect was pre-sented, allowing researchers to perform parameter studies in a flexible and efficient way. PETFEN was then set side by side to SimGrid on some topologies, highlighting the advan-tage of PETFEN compared to SimGrid for the evaluation of Ethernet networks. We refer the readers to [10, 11] for further numerical evaluations of PETFEN.
We would like to extend PETFEN in order to work with more advanced traffic patterns, such as web or video stream-ing traffic. Finally we wish to perform an intensive compari-son between PETFEN and emulations or real testbed evalu-ations. PETFEN is still under active development, and will be released soon under an open-source license.
8.
REFERENCES
[1] INET Framework for OMNeT++/OMNEST. http://inet.omnetpp.org/, Accessed 01.08.2014. [2] OMNeT++ 4.5 Network Simulation Framework.
http://www.omnetpp.org, Accessed 01.08.2014. [3] ns-2, Network Simulator (ver. 2.35).
http://nsnam.isi.edu/nsnam/index.php/Main Page, Accessed 04.04.2014.
[4] E. Altman, K. Avrachenkov, and C. Barakat. TCP Network Calculus: The case of large delay-bandwidth product. InProceedings of INFOCOM 2002, volume 1, pages 417–426. IEEE, June 2002.
[5] W. H. Bell, D. G. Cameron, A. P. Millar, L. Capozza, K. Stockinger, and F. Zini. OptorSim – A Grid Simulator for Studying Dynamic Data Replication Strategies. International Journal of High Performance Computing Applications, 17(4):403–416, Nov. 2003.
[6] T. Bu and D. Towsley. Fixed Point Approximations for TCP behavior in an AQM Network. InACM
SIGMETRICS Perform. Eval. Rev., volume 29, pages 216–225. ACM, 2001.
[7] N. Cardwell, S. Savage, and T. Anderson. Modeling TCP Latency. InProc. of INFOCOM 2000, volume 3, pages 1742–1751. IEEE, Mar. 2000.
[8] H. Casanova, A. Legrand, and M. Quinson. SimGrid: a Generic Framework for Large-Scale Distributed Experiments. InProceedings of the Tenth International Conference on Computer Modeling and Simulation, UKSIM ’08, pages 126–131, Washington, DC, USA, 2008. IEEE Computer Society.
[9] V. Firoiu, I. Yeom, and X. Zhang. A Framework for Practical Performance Evaluation and Traffic Engineering in IP Networks. InIEEE International Conference on Telecommunications, 2001.
[10] F. Geyer, S. Schneele, and G. Carle. Practical Performance Evaluation of Ethernet Networks with Flow-Level Network Modeling. InProc. of the 7th International Conference on Performance Evaluation Methodologies and Tools (VALUETOOLS), pages 253–262. ICST, ACM, Dec. 2013. [11] F. Geyer, S. Schneele, and G. Carle. Towards Stochastic
Flow-Level Network Modeling: Performance Evaluation of Short TCP Flows. InProc. of the 39th IEEE Conference on Local Computer Networks (LCN), pages 462–465. IEEE, Sept. 2014.
[12] R. Gibbens, S. Sargood, C. Van Eijl, F. Kelly, H. Azmoodeh, R. Macfadyen, and N. Macfadyen. Fixed-Point Models for the End-to-End Performance Analysis of IP Networks. InITC specialist seminar, 2000. [13] R. Hickey. The Clojure Programming Language. In
Proceedings of the 2008 Symposium on Dynamic Languages. ACM, July 2008.
[14] B. Lantz, B. Heller, and N. McKeown. A Network in a Laptop: Rapid Prototyping for Software-Defined Networks. InProceedings of the 9th ACM SIGCOMM Workshop on Hot Topics in Networks, Hotnets-IX, pages 19:1–19:6. ACM, Oct. 2010.
[15] L. Massouli´e and J. Roberts. Bandwidth Sharing: Objectives and Algorithms.IEEE/ACM Trans. Netw., 10(3):320–328, 2002.
[16] M. Mathis, J. Semke, J. Mahdavi, and T. Ott. The Macroscopic Behavior of the TCP Congestion Avoidance Algorithm.ACM SIGCOMM Comput. Commun. Rev., 27(3):67–82, June 1997.
[17] J. Padhye, V. Firoiu, D. F. Towsley, and J. F. Kurose. Modeling TCP Reno Performance: A Simple Model and Its Empirical Validation.IEEE/ACM Trans. Netw.,
8(2):133–145, Apr. 2000.
[18] J. Sommers, R. Bowden, B. Eriksson, P. Barford,
M. Roughan, and N. Duffield. Efficient Network-wide Flow Record Generation. InProceedings IEEE INFOCOM 2011, pages 2363–2371, Apr. 2011.
[19] P. Velho and A. Legrand. Accuracy Study and Improvement of Network Simulation in the SimGrid Framework. InProceedings of the 2nd International Conference on Simulation Tools and Techniques, SIMUTOOLS. ICST, Mar. 2009.