A Comparative View Of Applying Linear And
Non-Linear Visualisation Approaches To Protein Dataset
Saba Manzoor
1, Fawwad Hassan Jaskani
2,*and Omer Riaz
31Author, Co-Author, Islamia University of Bahawalpur, Bahawalpur, Pakistan
2Co-Author, Khawaja Fareed University of Engineering and Information Technology, Rahim Yar Khan 3Co-Author, Islamia University of Bahawalpur, Bahawalpur, Pakistan
Abstract
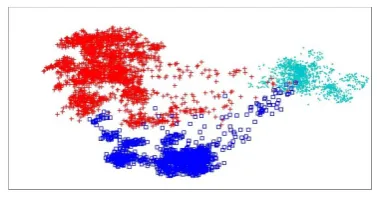
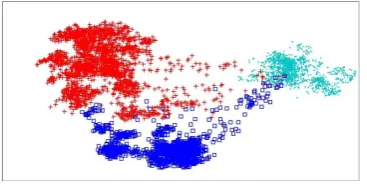
This novel method enlivened via cartographic maps in the geology area and this technique has been utilized to reintroduce in the visualization space lost data in which the non-linear mapping brings about. The diagnostic measurement of such a bending has been communicated as Magnification Factors, and after that computed then envisioned together as the Cartogram maps We improved interpretability Linear model apply through drtoolbox where cyan circles represent HLA-A, red plus sign represents HLA-B and blue square represents HLA-C. Basic purpose behind this study was that previously for large amount of data set, clustering and classifications techniques were used, but through drtoolbox, it is used in MATLAB. The researcher has visualized data for better understanding. This data was aligned in class I HLA-A, HLA-B and HLA-C. Data was available in the form of groups, when it was aligned horizontally then there were 372 rows and 12458 columns. After sorting of data 180 columns remained, Then this data was checked column wise check. The dashes present in the data was replaced by the alphabet displayed at the top of each column. The data coding was done on 12458 rows and data was converted into nominal form. Consensus sequence of data was checked later, the purpose of this sequence is to check the occurrence of each alphabet in a column. The alphabet that was maximum was converted to binary code 1 and remaining were converted to 0. When the data was converted in to binary then models were applied on the data. If the data is in linear form then linear model is better and if the data is in non linear form then non linear model is better, it depends on the results of the data. But in case of this study non linear models showed worst visualization. PCA which is a linear model has showed much better visualization.
Keywords:Linear Model, Visualization, Neural Networks, Deep Learning.
Received on 05 March 2019, accepted on 22 March 2019, published on 26 April 2019
Copyright © 2019 Saba Manzoor et al., licensed to EAI. This is an open access article distributed under the terms of the Creative Commons Attribution licence (http://creativecommons.org/licenses/by/3.0/), which permits unlimited use, distribution and reproduction in any medium so long as the original work is properly cited.
doi: 10.4108/eai.13-7-2018.161109
have been utilized to describe the measurable variety of a specific protest in a given populace (or set of populaces) [8]. The fundamental thought in these is to comprehend the variety of comparative protests through analysis of the distortion fields required to twist one question onto another.
They are intriguing options in contrast to different methods since when connected specifically to pixel powers, they can possibly evaluate both surface and, to some degree, shape data consolidated [9]. Specifically, there has been proceeding with push to grow quick and dependable methods for processing transportation related separations. While the computational many-sided quality of these methods ranges from quadratic to linear
Creative Technologies
Research Article
*Corresponding author. Email:[email protected]
1. Introduction
regarding image estimate, the calculations are as yet costly, specifically for harsh images, and there are issues with intermingling
2. Research Objectives
The objective of this research is to execute the following experiments and tests:
1. WeightedIso and Iso+Ada accomplish execution results focused to other classification techniques yet in significantly bring down dimensional space;
2. WeightedIso and Iso+Ada permit to significantly reduction the dimensionality of the first feature space, in this manner permitting the utilization of ordering information structures to perform productive closest neighbour look,
3. Literature Review
Ongoing exploration in the field of bioinformatics has given a broad arrangement of protein amino corrosive groupings accessible as succession databases, for example, Swiss-Prot3, TrEMBL4, and IMGT/HLA5 and so on. In the February 2012 discharge, there are 534; 695 and 20; 127; 441 and 7; 274 known succession sections individually. The capacity of not very many protein arrangements in these databases are known today. In this way, anticipating the elements of protein successions is vital and is often accomplished via looking for the most comparative arrangements with definitely known usefulness [15].
Two courses of action with high comparability in fundamental progressions are depended upon to have similar three-dimensional structure however two near three-dimensional structures might not have strong closeness in their amino destructive progressions [16]. For example, the three-dimensional structures of the human _-globin and myo_-globin are essentially the same as anyway their amino destructive game plans simply have 26% identity [17]. Predicting protein work from structure is known to be more productive than envisioning limit from amino destructive game plan; there are two clarifications behind this. Beginning, three-dimensional structures are more apportioned than amino destructive courses of action [18]. Second, the areas where a protein can connect with a ligand6 are controlled by three-dimensional structure [19]. X-pillar Crystallography [20], Nuclear Magnetic Resonance Spectroscopy [21] and Electron Microscopy [21] are the standard strategies for choosing three-dimensional protein structures. These test strategies are costly and dull [22]. In this way, not a lot of three-dimensional protein structures are known conversely with the sweeping number of known protein amino destructive courses of action [7]. The database that holds three-dimensional protein structures is the Research Collaboratory for Structural Bioinformatics (RCSB) protein database [23]
3.1 Local Embedding
Local Embeddings attempt to tackle this problem. Isomap is a procedure that maps high-dimensional objects into a lower dimensional space, while preserving as well as possible the neighborhood of each object, as well as the 'geodesic' distances between all pairs of objects. Isomap works as follows:
1. Calculate the K closest neighbours of each object 2. Create the Minimum Spanning Tree (MST) distances of the updated distance matrix
3. Run MDS on the new distance matrix. 4. Depict points on some lower dimension
3.2 Bio-Informatics
In bioinformatics, we analysed every single accessible datum and locate the normal features. Wellsprings of information utilized in bioinformatics is Raw DNA arrangement, protein succession, metabolic pathway, macromolecular structure, Genomes and quality expressions.[23] Essential groupings of DNA, RNA and protein masterminding through succession arrangement method to discover the similitudes that are consequence of useful, arrangement or auxiliary. Adjusted protein groupings are generally speak to in type of lines and segments. [24]
3.3 Human Leukocyte Antigen (HLA)
Encoding human leukocyte antigen complex is the human Major histocompatibility complex (MHC).because these antigen identified using alloantibodies against leukocyte. HLA primary role in biological of HLA is in the regulation of immune system.
HLA map the short arm of chromosome 6(6p21), and divided into three regions.
• Class-I • Class-II • Class- III
Figure 1. Structure of a HLA MHC Complex
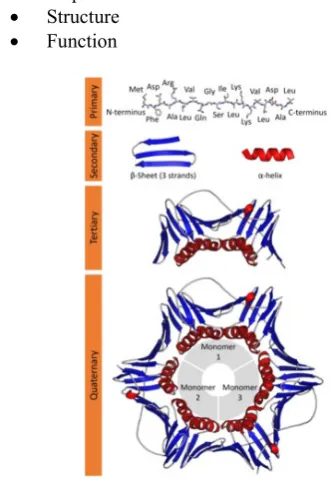
3.4 Proteins
Protein are the basic building blocks of living organisms. The protein is derived from the Greek word “protos” which means “primal”.
Proteins are macromolecules consist on amino acids. There are 20 different type of amino acids are present that used to generate number of protein sequences. Protein play a vital role in the regulation of biological process and that are characterized by 3 key attributes.
• Sequence • Structure • Function
Figure 1. Structure of a Protein Molecule
4. Methodology
To visualize Protein sequences we will take a Aligned data set. After that pre-processing will be done to encode the data properly. After Pre-processing and cleaning of data set consensus sequence will be find that will be essential to find the binary. When the data set will be convert into binary form than linear and nonlinear models will be applied to visualize the data
Figure 2. Proposed Methodology
4.1 Prediction Method
Prior work was done on determining focuses for basic genomics in light of visualization. Here we will consider the utilization of the visualization of protein datasets displayed in the past part towards target selection. Now and again, there is no evident likeness to any protein grouping in the fundamental database, in which cases the protein is set apart as "Disconnected" and isn't viewed as any further.
4.2 Dimensionality Reduction
In statistics, information theory and machine learning, dimension reduction or dimensionality reduction is the way toward diminishing the quantity of arbitrary factors under thought [40] by acquiring an arrangement of vital factors. It is very well may be divided into feature selection and feature extraction.
Feature selection methods ought to be recognized from feature extraction. Feature extraction makes new features from elements of the first features, while a subset of the features was restores by feature selection. Feature selection procedures are regularly utilized in areas where there are numerous features and nearly few examples. Prototype cases for the utilization of feature selection incorporate the examination of composed writings and DNA microarray data, where there are a large number of features, and a couple of tens to several examples.
4.4 Filter Methods
In any case, filter techniques have a tendency to choose repetitive factors since they don't think about the connections between factors. Along these lines, they are mostly utilized as a pre-process technique
Figure 3. Filter Methods
4.5 Wrapper Method
Wrapper techniques assess subsets of factors which permits, not at all like filter approaches, to identify the conceivable connections between variables.[46] The two principle impediments of these strategies are :
The expanding overfitting hazard when the quantity of perceptions is inadequate.
The critical calculation time when the quantity of factors is extensive.
Figure 4. Wrapper Method
4.6 Embedded Method
Embedded techniques have been as of late recommended that attempt to consolidate the benefits of both past strategies. A learning calculation exploits its own particular variable selection process and performs feature selection and grouping all the while.
4.7 Feature Extraction
Feature extraction incorporates diminishing the proportion of benefits required to delineate a broad course of action of data. When performing examination of complex data one of the critical issues originates from the amount of components included. Examination with a considerable number of variables generally requires a great deal of memory and computation control, also it may make a request estimation over fit to getting ready tests and aggregate up insufficiently to new precedents. Feature extraction is a general term for methods for building mixes of the elements to get around these issues while up 'til now depicting the data with sufficient accuracy.
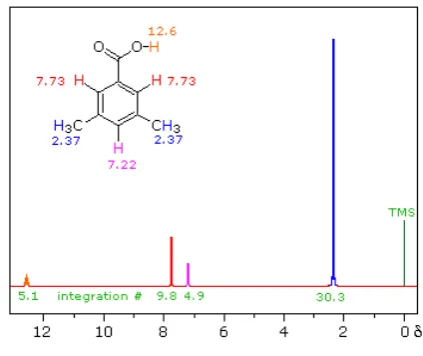
4.8 Pre-processing NMR Spectra
The NMR spectra data of human CSF was pre-prepared, which regularly incorporates gauge amendment, arrangement, binning, standardization and scaling. Least Square technique was used for standard rectification of NMR spectra [22]. Next, with a particular ultimate objective to empty varieties in top position, NMR spectra were balanced by using connection enhanced twisting
Figure 5. Preprocessing NMR Spectra
5. Results
understand through previous methods rather the visualization technique is the best suitable to understand.
First of all the data was collected from website. This data was aligned in class I HLA-A, HLA-B and HLA-C. Data was available in the form of groups, when it was aligned horizontally then there were 372 rows and 12458 columns. After sorting of data 180 columns remained, Then this data was checked column wise check. The dashes present in the data was replaced by the alphabet displayed at the top of each column. The data coding was done on 12458 rows and data was converted into nominal form. Consensus sequence of data was checked later, the purpose of this sequence is to check the occurrence of each alphabet in a column. The alphabet that was maximum was converted to binary code 1 and remaining were converted to 0. When the data was converted in to binary then models were applied on the data.
The conversion of data to nominal form and then to binary form is also shown in the figures below. The sources of this data is also shown The FTP directory is available at the following address,
• ftp://ftp.ebi.ac.uk/pub/databases/ipd/imgt/hla/
This data was aligned in class I HLA-A, HLA-B and HLA-C. Data was available in the form of groups. Data was available in the form of groups, when it was aligned horizontally then there were 372 rows and 12458 columns.
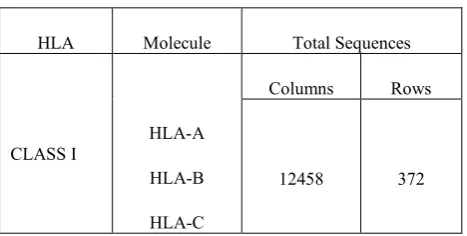
Table 1. HLA Protien Sequences fpr CLASS I
HLA Molecule Total Sequences
CLASS I HLA-A
HLA-B
HLA-C
Columns Rows
12458 372
After cleaning of data set there were 372 rows and 12458 columns. The dashes present in the data was replaced by the alphabet displayed at the top of each column. The data coding was done on 12458 rows and data was converted into nominal form. Consensus sequence of data was checked later, the purpose of this sequence is to check the occurrence of each alphabet in a column. The alphabet that was maximum was converted to binary code 1 and remaining were converted to 0. When the data was converted in to binary then models were applied on the data.
Table 2. HLA protein sequences
HLA Molecule Total Sequences
CLASS I HLA-A HLA-B
HLA-C
Columns Rows
12458 180
5.1 Linear data projection technique
Data which has linear relationship is called as linear data and others are called as nonlinear data. There are number of techniques available to handle this type of linear data. This section deals with LDA and PCA.
5.2 Principle Component Analysis
Let X=[x1…xm] T be the input vector that denotes X as the
m-dimensional data input data. The sample mean of the given input is calculated as in (8),
(8)
Where, denotes the Mean of the sample data X and n denotes the number of samples. The covariance of the matrix is identified by using equations (4) and (5).
(9)
(10)
PCA is performed by finding the Eigen values and Eigen vectors of the covariance matrix and rearranged in descending order according to the corresponding Eigen values using a transformation matrix T, which can produce the new form of input vector X.
(11)
Figure 7. PCA (Principal Component Analysis)
A case of traditional multidimensional scaling connected to voting designs in the United States House of Representatives. Every red spot speaks to one Republican individual from the House, and each blue dab one Democrat.
Despite the fact that the customary PCA is performed in numerous applications, it has a few issues. The fundamental issue of PCA is that the Mean Square Error (MSE) is ruled with the substantial number of blunders. PCA in light of L2-standard winds up delicate to anomalies. To defeat this issue PCA in light of L1-standard is proposed to enhances the power [17] [18]. In [15], [20], [21], the projection takes after Laplacian appropriation and L1-PCA is figured by applying Maximum probability estimation to the first given data. The issue of L1-PCA is fathomed by utilizing weighted middle technique and curved programming strategy and it turns out to be computationally costly.In, Rotational PCA (R1-PCA) is proposed to combine the advantages of both L1-PCA and L2-PCA. It is rotational invariant and successfully reduces the effect of outliers. PCA based on Maximum Currentropy Criterion (MCC), Robust Two dimensional PCA (RTDPCA) solves the problems of outliers and robustness.
5.3 Non Linear data projection technique
In genuine world, the vast majority of the data are as non-direct. Taking care of these kinds of data for advance examination is troublesome. There are numerous systems, which can deal with this sort of non-direct data.
5.4 Auto encoder
Auto encoders (auto encoder systems) are a straightforward nonlinear expansion of the idea: endeavour to locate the best low-dimensional nonlinear mapping, to such an extent that the first data point directions can be recreated and in addition conceivable from the low-dimensional organizes by another mapping.
Figure 6. Auto Encoder
5.5 Manifold Chart
Increasing MTS Model Interpretability through Visualization Using Manifold Learning Time-subordinate regular wonders and counterfeit procedures can frequently be quantitatively communicated as multivariate time arrangement (MTS). As in some other procedure of learning extraction from data, the expert can profit by the investigation of the qualities of MTS through data visualization. This visualization regularly winds up hard to decipher when MTS are demonstrated utilizing direct methods. Regardless of their adaptability, non-direct models can be rendered pointless if such interpretability is deficient. The techniques portrayed in past sections have for the most part centered on static data. In this section, we demonstrate MTS utilizing VB-GTM-TT, a variational Bayesian variation of an obliged concealed Markov display (HMM) of the complex adapting family characterized for MTS visualization. We intend to expand its interpretability by exploiting two aftereffects of the probabilistic meaning of the model: the express estimation of probabilities of change between states portrayed in the visualization space and the measurement of the non-direct mapping twisting.
5.6 MTS Visualization
The considered MTS are particularly sensible for the outline of the proposed visualization methodologies due to the possibility of their organizations and changes periods. The phony dataset, isolated by a sudden advancement at point 700. The VBGTM-TT show was set up over a 8 × 8, 2 − D lattice of disguised states and each one of the MTS centers was mapped by VB-GTM-TT to a particular state in the system. Before point 700, the periodicity of the data is all around gotten by the for the most part indirect structure of populated states. The sudden change to a higher-plentifulness discontinuous break is also perfectly imagined.
in the system. There is a sensible illustration for this state enlistment mapping, as the Shuttle-data bearing is confined to a set number of its communicates (a run of the mill typical for VB-GTM-TT mappings, in which over-multifaceted nature is rebuffed). Only a few they are by and large huge: these are generally stationary states with little MTS change in between times C, D and E. The semi discontinuous between times B grows steadily through a surge of states on the upper left and focal point of the guide.
Figure 7. Manifold
5.7 Multi-Dimensional Scaling MDS
MDS is the accumulation of non-direct strategies to change the high dimensional data into low dimensional data. The blunder between the match insightful separation between the low dimensional data and high dimensional data is communicated in pressure work [60]. The models of pressure capacities are crude pressure capacity and Common cost work.
(d) Multidimensional Scaling (MDS)
Limiting the pressure work decreases the mistake which prompts enhance the execution of the framework. Eigen disintegration of a couple astute separation comparability framework, Conjugate slope strategy, Pseudo-Newton technique are a portion of the strategies to diminish the pressure function[61].MDS is utilized in numerous applications like fMRI Analysis[62], atomic modeling[63],etc.
5.8 PPCA
Conventional PCA is not probabilistic. Moghaddam extended the conventional PCA into a Probabilistic framework and Probabilistic PCA (PPCA) is derived from the linear latent variable model which can be used to handle the One dimensional(1 -D) data vector. Probabilistic second order PCA (PSOPCA) is a model to follow the classical latent variable model and used different learning [60]. 2D-PCA is used to extend the PCA to handle the 2-Dimensional data vectors [61]. Parameter estimation in PPCA requires latent variables which lead to get slower convergence [62]-[63]. To overcome these problems Bilinear Probabilistic Principal Component Analysis (BPPCA) was proposed in the curse of dimensionality on the two dimensional data is solved by using [64].
Figure 8. PPCA (Probabilistic Principal Component Analysis)
6. Conclusion
The researcher has demonstrated to characterize an appropriation over the metric in latent variable models. Specifically, this was accomplished by pulling back the metric from the perception space into the dormant space as an irregular Riemannian metric. This examination opens to new dimensions of research in the field of Random Geometries in connection to machine learning. Irregular Riemannian manifolds are numerically lesser known than Riemannian manifolds. Actually, it is realized that geodesics are most likely not length limiting bends under an arbitrary metric. We are proposing that manifolds got from data are essentially indeterminate, and there is much to get from further research of these spaces, which at that point normally prompt appropriations over distances, geodesics, curvature, angles, etc.
estimation itself and, assuming this is the case, it merits understanding its impact in the learning procedure.
The researcher has built up a probabilistic system where the help of the data can be deciphered as an irregular Riemannian complex and geodesic separations can be processed by considering the vulnerability of the metric. New starts of research plan to recognize numerical techniques as learning issues utilizing probabilistic models. This methodology is known as Probabilistic numerics1 and addresses traditional streamlining calculations and numerical techniques for the arrangement of differential conditions and integrals. Such probabilistic numerical strategies, connected to discover arrangements of standard differential conditions (ODEs), affect the investigation of measurable Riemannian manifolds.
References
[1] M. D. Ritchie, E. R. Holzinger, R. Li, S. A. Pendergrass, and D. Kim, “Methods of integrating data to uncover genotype-phenotype interactions,”
Nat. Rev. Genet., vol. 16, no. 2, pp. 85–97, 2015. [2] S. Mumtaz, I. T. Nabney, and D. Flower, “Novel
visualization methods for protein data,” Comput. Intell. Bioinforma. Comput. Biol. (CIBCB), 2012 IEEE Symp., pp. 198–205, 2012.
[3] W. Wang and G. K. Rohde, NIH Public Access, vol. 101, no. 2. 2014.
[4] D. N. Reshef et al., “NIH Public Access,” vol. 334, no. 6062, pp. 1518–1524, 2012.
[5] N. Nicolaou, Y. Xu, and R. Goodacre, “Fourier transform infrared spectroscopy and multivariate analysis for the detection and quantification of different milk species,” J. Dairy Sci., vol. 93, no. 12, pp. 5651–5660, 2010.
[6] H. A. Gaspar, I. Baskin, G. Marcou, D. Horvath, and A. Varnek, “Chemical Data Visualization and Analysis with Incremental GTM: Big Data Challenge.,” J. Chem. Inf. Model., 2014.
[7] J. Xia, N. Psychogios, N. Young, and D. S. Wishart, “MetaboAnalyst: A web server for metabolomic data analysis and interpretation,” Nucleic Acids Res., vol. 37, no. SUPPL. 2, pp. 652–660, 2009.
[8] N. Kireeva, I. I. Baskin, H. A. Gaspar, D. Horvath, G. Marcou, and A. Varnek, “Generative Topographic Mapping (GTM): Universal tool for data visualization, structure-activity modeling and dataset comparison,”
Mol. Inform., vol. 31, no. 3–4, pp. 301–312, 2012. [9] H. H. M. Draisma, T. H. Reijmers, and F. Van Der
Kloet, “Equating , or correction for between-block effects with application to body fluid LC – MS and NMR metabolomics datasets,” Anal. Chem., vol. 82, no. 3, pp. 1039–1046, 2010.
[10] A. N. Gorban and A. Y. Zinovyev, “Visualization of Data by Method of Elastic Maps and Its Applications in Genomics, Economics and Sociology,” no. January 2013, pp. 0–33, 2001.
[11] Y. A. Ivanenkov, N. P. Savchuk, S. Ekins, and K. V. Balakin, “Computational mapping tools for drug discovery,” Drug Discov. Today, vol. 14, no. 15–16, pp. 767–775, 2009.
[12] I. Žliobaitė, “Learning under Concept Drift: an
Overview,” pp. 1–13, 2010.
[13] S. Y. Wang, C. H. Kuo, and Y. J. Tseng, “Batch normalizer: A fast total abundance regression calibration method to simultaneously adjust batch and injection order effects in liquid chromatography/time-of-flight mass spectrometry-based metabolomics data and comparison with current calibration methods,”
Anal. Chem., vol. 85, no. 2, pp. 1037–1046, 2013. [14] R. Bellazzi, F. Ferrazzi, and L. Sacchi, “Predictive
data mining in clinical medicine: A focus on selected methods and applications,” Wiley Interdiscip. Rev. Data Min. Knowl. Discov., vol. 1, no. 5, pp. 416–430, 2011.
[15] K. Shekhar, P. Brodin, M. M. Davis, and A. K. Chakraborty, “Automatic Classification of Cellular Expression by Nonlinear Stochastic Embedding (ACCENSE),” Proc. Natl. Acad. Sci., vol. 111, no. 1, pp. 202–207, 2014.
[16] T. Clough, M. Key, I. Ott, S. Ragg, G. Schadow, and O. Vitek, “Protein quantification in label-free LC-MS experiments,” J. Proteome Res., vol. 8, no. 11, pp. 5275–5284, 2009.
[17] Zena M. Hira and D. F. Gillies, “A Review of Feature Selection and Feature Extraction Methods Applied on Microarray Data,” Adv. Bioinformatics, vol. 2015, no. 1, 2015.
[18] A. Smolinska et al., “Interpretation and visualization of non-linear data fusion in kernel space: Study on metabolomic characterization of progression of multiple sclerosis,” PLoS One, vol. 7, no. 6, 2012. [19] M. Lapins and J. E. S. Wikberg, “Kinome-wide
interaction modelling using alignment-based and alignment-independent approaches for kinase description and linear and non-linear data analysis techniques,” BMC Bioinformatics, vol. 11, 2010. [20] N. Jaitly, A. Mayampurath, K. Littlefield, J. N.
Adkins, G. A. Anderson, and R. D. Smith, “Decon2LS: An open-source software package for automated processing and visualization of high resolution mass spectrometry data,” BMC Bioinformatics, vol. 10, 2009.
[21] M. Vlachos, C. Domeniconi, D. Gunopulos, G. Kollios, and N. Koudas, “Non-linear dimensionality reduction techniques for classification and visualization,” Proc. eighth ACM SIGKDD Int. Conf. Knowl. Discov. data Min., pp. 645–651, 2002. [22] M. Arabloo, M. A. Amooie, A. Hemmati-Sarapardeh,
M. H. Ghazanfari, and A. H. Mohammadi, “Application of constrained multi-variable search methods for prediction of PVT properties of crude oil systems,” Fluid Phase Equilib., vol. 363, pp. 121–130, 2014.
[23] L. Yi et al., “Chemometric methods in data processing of mass spectrometry-based metabolomics: A review,”
Anal. Chim. Acta, vol. 914, pp. 17–34, 2016.
[24] S. Rani, “Cluster Analysis Method for Multiple Sequence Alignment,” vol. 43, no. 14, pp. 19–25, 2012.
[25] S. Fayech, N. Essoussi, and M. Limam, “Partitioning clustering algorithms for protein sequence data sets,”