World Maritime University
The Maritime Commons: Digital Repository of the World
Maritime University
World Maritime University Dissertations Dissertations
1-1-2016
The impact of hinterland transport on port
operational performance: a Jordanian case
Anas Saleh Mohammad AlamoushFollow this and additional works at:http://commons.wmu.se/all_dissertations
This Dissertation is brought to you courtesy of Maritime Commons. Open Access items may be downloaded for non-commercial, fair use academic purposes. No items may be hosted on another server or web site without express written permission from the World Maritime University. For more information, please [email protected].
Recommended Citation
Alamoush, Anas Saleh Mohammad, "The impact of hinterland transport on port operational performance: a Jordanian case" (2016).
WORLD MARITIME UNIVERSITY
Malmö, Sweden
THE IMPACT OF HINTERLAND TRANSPORT
ON PORT OPERATIONAL PERFORMANCE
A Jordanian Case
By
ANAS SALEH MOHAMMAD ALAMOUSH
Jordan
A dissertation to be submitted to the World Maritime University in partial Fulfilment of the requirements for the award of the degree of
MASTER OF SCIENCE
In
MARITIME AFFAIRS
SHIPPING MANAGEMENT AND LOGISTICS 2016
ii
DECLARATION
I certify that all the material in this dissertation that is not my own work has been identified, and that no material is included for which a degree has previously been conferred on me. The contents of this dissertation reflect my own personal views, and are not necessarily endorsed by the University.
Supervised by: Prof. Dong-Wook Song
World Maritime University
Assessor: Prof. Daniel MOON
Institution/organization: World Maritime University
Co-assessor: Dr. Martin Schramm
iii
ACKNOWLEDGEMENTS
iv
ABSTRACT
Title of Dissertation: The Impact of Hinterland Transport on Port Operational Performance: A Jordanian Case
Degree: MSc
This dissertation is a study of the impact of hinterland transport upon port operational performance. Such study is considered very useful as it adds to the literature and current research more evidence and analyses using a quantitative approach and statistical analyses; also, it explains and elaborates the importance of hinterland transportation in the general context, and particularly its impact on port operational performance. This study is motivated by the objective of identifying the relationship between port operational performance and hinterland transport through studying the impact of an organized truck system on port operational performance.
A case study approach was adopted based on NAFITH Company, which controls the flow of trucks to and from the port of Aqaba/Jordan, to examine the hinterland transport, and to be used for further tests and analysis. Using a secondary research design, quantitative methods, a time series of available data was assembled from the port and NAFITH company for a ten-year period; 2006-2015. Then, a conceptual framework was initiated and an analytical model derived from it to explain the primary assumption, which indicates that hinterland transport impacts port operational performance. The analytical model was operationalized by four hypotheses after the parameters were projected.
After examining the literature of both hinterland and port performance, the research took the trucks (truck turnaround time from the marshalling yards) as the variable that represents hinterland transport (independent variable) vis a vis four performance indicators of a dry bulk terminal (ship turnaround time, berth occupancy rate, gross berth productivity, average ship call size) that represent port performance (dependent variables). Hence, four hypotheses were formulated to explain the analytical model; for each hypothesis, the truck turnaround was the independent variable, and the four performance indicators mentioned above were the dependent variables, one variable in each hypothesis. The hypotheses were tested by correlations, t-test, and simple regression, following that, the results were analyzed and discussed. The findings from the research concluded that there is an impact of improved (efficient) hinterland transport (truck turnaround) on port operational performance, as three hypotheses were significant. However, further research is required to examine all port terminals and determine how much hinterland transport impacts port operational performance as a whole.
v Table of Contents
DECLARATION ... ii
ACKNOWLEDGEMENTS ... iii
ABSTRACT ... iv
LIST OF TABLES ... ix
LIST OF FIGURES ... x
LIST OF ABBREVIATIONS ... xi
Chapter 1 Introduction
... 11.1. Background ... 1
1.2. Research Questions and Objectives ... 4
1.3. Significance of the Study ... 5
1.4. Methodology ... 5
1.5. Dissertation Structure ... 6
Chapter 2 Hinterland Transport System and Port Performance
... 92.1. Concept of Hinterland Transport system ... 9
2.1.1. Overview of the Hinterland ... 10
2.1.2. Hinterland Transport Modes and Development ... 10
2.1.3. Measurement of Hinterland Related Performance ... 12
2.1.4. Ways to Improve Hinterland Transport Performance ... 14
2.1.5. Optimization of Trucks Flow ... 14
2.2 Concept of Port Performance ... 17
2.2.1 Traditional Port Performance Indicators (PPIs) ... 20
2.2.2. Container Terminals PPIs ... 21
2.2.3. Common Port Operating and Financial Measures ... 24
vi
2.2.5. Port Performance and Hinterland Transport ... 26
2.3. Relationship Between Hinterland Transport System and Port performance ... 27
2.3.1. Hinterland and Ports as Logistics Chain ... 29
2.3.2. Hinterland Transport and Port Performance ... 31
2.4. Conceptual Framework ... 32
2.5. Summary ... 35
Chapter 3 Transport Systems and Ports in Jordan
... 373.1. Jordanian Transport ... 37
3.1.1. Land Transport and Network ... 38
3.1.2. Air Transport ... 40
3.1.3. Maritime Transport ... 40
3.2. Ports in Jordan ... 41
3.2.1. Port Functions and Facilities ... 43
3.2.3. Port Cargo Handling Equipments ... 43
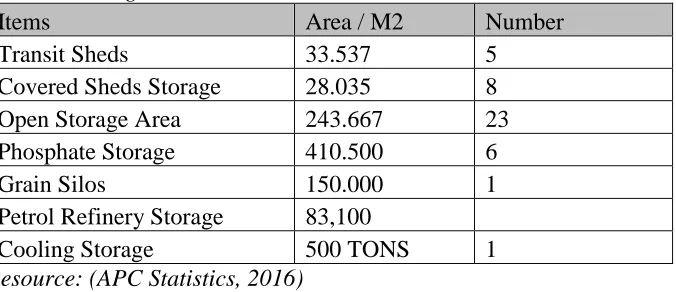
3.2.4. Main Port Storage Facilities ... 44
3.2.5. Main Port Berthing Facilities ... 44
3.2.6. Middle Port Berthing Facilities ... 46
3.2.7. Southern Port (Industrial Port) Berthing Facilities ... 47
3.2.8. Aqaba Container Terminal (ACT) ... 49
3.3. NAFITH Project as a Case ... 50
3.3.1. NAFITH Operational Objectives ... 50
3.3.2. NAFITH National Single Window ... 51
3.3.3. Overview of NAFITH Truck Control System (TCS) ... 52
3.3.4. NAFITH-TCS Layout ... 53
3.3.5. TCS Permit Details ... 55
3.3.6. RFID Technology and eWaybill ... 56
vii
3.4. Summary ... 58
Chapter 4 Research Methodology
... 604.1. Analytical Model ... 60
4.2. Hypotheses ... 61
4.3. Data and Variables ... 62
4.4. Analytical Tools and Tests... 65
4.4.1. Correlation ... 66
4.4.2. T-test ... 66
4.4.3. Stationarity and Unit Root Test ... 66
4.4.4 Regression ... 67
4.5. Summary ... 68
Chapter 5 Empirical Analysis and Discussion
... 695.1. Hypothesis One ... 69
5.2. Hypothesis Two ... 70
5.3. Hypothesis Three ... 71
5.4. Hypothesis Four ... 73
5.5. Discussion ... 74
5.5.1. Hypothesis One ... 75
5.5.2. Hypothesis Two ... 77
5.5.3. Hypothesis Three ... 79
5.5.4. Hypothesis Four ... 80
5.5.5 Discussion of NAFITH Case ... 82
Chapter 6 Conclusion
... 85viii
6.2. Implications ... 88
6.3. Limitations and Further Areas for Research ... 89
ix
LIST OF TABLES
Table 1: Financial Indicators ... 20
Table 2: Operational Indicators ... 20
Table 3: Port Performance Measures ... 22
Table 4: Common Performance Indicators ... 24
Table 5: Indicators of Port Efficiency Chosen for Transport Canada’s Fluidity Index ... 27
Table 6: Port Equipments ... 43
Table 7: Storage Facilities ... 44
Table 8: Main Port (North Port) Berthing Facilities ... 45
Table 9: Middle Port Berthing Facilities ... 46
Table 10: South Port Berthing Facilities ... 47
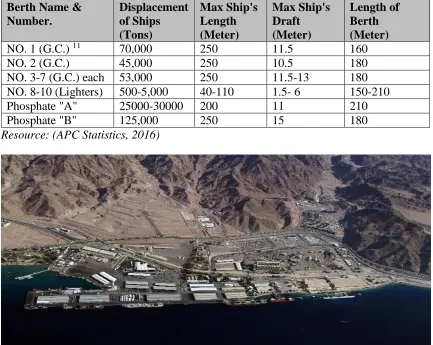
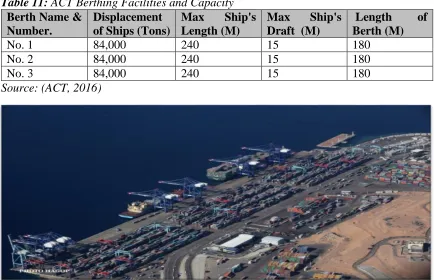
Table 11: ACT Berthing Facilities and Capacity ... 49
Table 12: NAFITH NSW Network ... 51
Table 13: Model Hypotheses Variables ... 61
Table 14: Summary of Regression’s Equations and Variables ... 67
Table 15: Tests Summary ... 69
Table 16: Tests Summary ... 70
Table 17: Tests Summary ... 72
x
LIST OF FIGURES
Figure 1: Dissertation Flow Chart ... 8
Figure 2: Conceptual Framework ... 35
Figure 3: Jordanian Transport Map ... 37
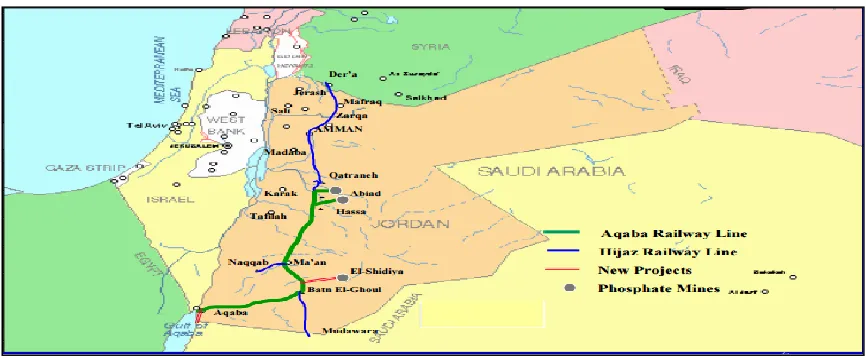
Figure 4: Railways Map ... 39
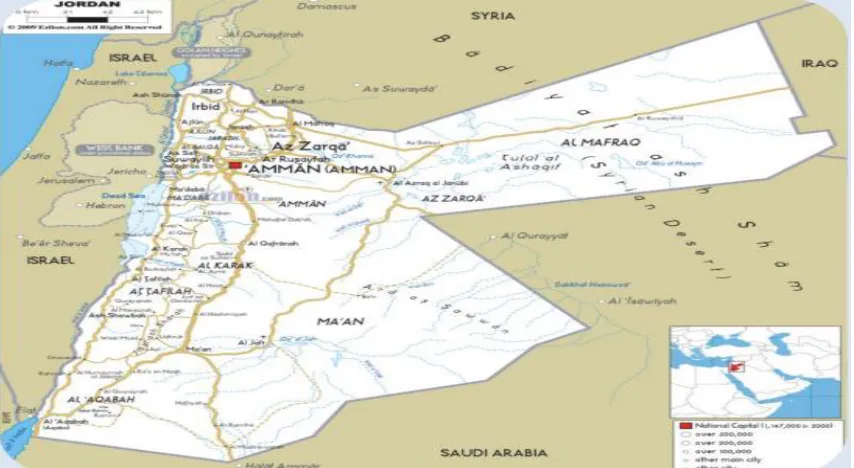
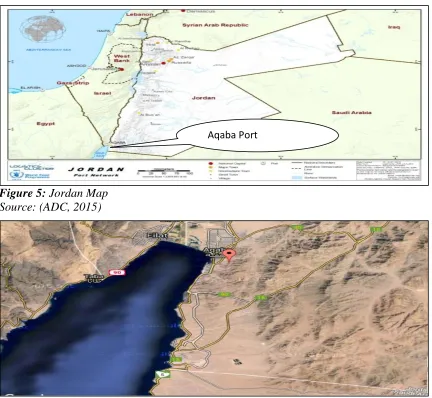
Figure 5: Jordan Map ... 42
Figure 6: Aqaba Map ... 42
Figure 7: Aqaba Ports Map ... 43
Figure 8: The Main (North) Port of Aqaba ... 45
Figure 9: Passenger and Ferry Terminal ... 46
Figure 10: LPG Terminal ... 47
Figure 11: LNG Terminal ... 48
Figure 12: Oil Terminal ... 48
Figure 13: Aqaba Container Terminal ... 49
Figure 14: Gates Entry/Exit to/from the City of Aqaba ... 54
Figure 15: Marshalling Yards ... 54
Figure 16: NAFITH Truck Drivers' ID ... 54
Figure 17: Truck with NAFITH Logo and RFID ... 55
Figure 18: Aqaba Special Economic Zone Map ... 55
Figure 19: TCS Permit ... 56
Figure 20: TCS Work Flow ... 57
Figure 21: The Analytical Model ... 61
Figure 22: Average Ship Turnaround Time ... 63
Figure 23: Average Berth Occupancy Rate ... 64
Figure 24: Average Gross Berth Productivity ... 64
Figure 25: Average Ship Call Size (GRT) ... 65
Figure 26: Average Truck Turnaround Time ... 65
Figure 27: Simple Regression ... 69
Figure 28: Simple Regression ... 71
Figure 29: Simple Regression ... 72
Figure 30: Simple Regression ... 74
Figure 31: Gross Berth Productivity & Truck Turnaround Time ... 76
Figure 32: Monthly Cargo Handled During the Observation Period ... 77
Figure 33: Average GRT & Truck Turnaround Time ... 78
Figure 34: Average Ship Turnaround Time & Truck Turnaround Time ... 79
xi
LIST OF ABBREVIATIONS
ABMC Arab Bridge Maritime Company
ACT Aqaba Container Terminal
ADC Aqaba Development Corporation
APC Aqaba Port Corporation
APM A.P. Moller–Maersk Group
ASEZA Aqaba Special Economic Zone Authority
BRIC Brazil, Russia, India, China
ECMT European Conference of Ministers of Transport
EDI Electronic Data Interchange
FSRU Floating Storage Regasification Unit
GDP Gross Domestic Product
GPS Global Positioning System
GRT Gross Registered Tonnage
HM Treasury Her Majesty's Treasury
IFC International Finance Corporation
IMO International Maritime Organization
ISPS Code The International Ship and Port Facility Security Code
JGTP Jordan Gas Transmission Pipeline
JNSL Jordanian National Shipping Lines
xii
JOD Jordanian Dinar
Km Kilo meter
KPIs key performance indicators
LNG Liquefied Natural Gas
LPG Liquefied Petroleum Gas
LPI The Logistics Performance Index
MARPOL The International Convention for the Prevention of Pollution from Ships
MEA Middle East Area
MoT Ministry of Transport
NSW National Single Window
NAFITH National Freight Information and Transportation Hub PPI port performance indicators Unit
PPP Private Public Partnership
RFID Radio-Frequency Identification
RoRo Roll-on/Roll-off Ships
SCS Screening Center System
SOLAS The International Convention for the Safety of Life at Sea
STCW The International Convention on Standards of Training,
Certification and Watch keeping for Seafarers
TCIMS Truck Control Information Management System
xiii
TEUs Twenty-foot Equivalent Units
TMF Traffic Mitigation Fee
TOS Terminal Operation System
TRB Transportation Research Board
UN United Nations
UNCTAD United Nations Conference on Trade and Development
UNECE United Nations Economic Commission for Europe
1
Chapter 1 Introduction
1.1. Background
Ports have been, and still are, an integral part of freight transportation as they play a major role in a country's development and prosperity. Hence, port performance and efficiency are vital for a country's economy because the world economy continues to be the driving force behind the maritime sector (Meersman et al., 2010). Importantly, moreover, most of the world trade is carried by ships, which use ports as the ultimate gateways as world seaborne trade represents about 70% of the value and 90% of the volume of world trade (UNCTAD, 2012).
The historical role of ports is as a natural site to transfer and receive goods, working with the bidirectional logistics system. They receive goods from ships, and from land through road, rail, and inland waterway transport. Hence, ports are the nodes that link maritime and hinterland transport by providing a rigorous interface. On the other hand, they play a vital function in the supply chain because of the facilitation of cargo handling, management, and exchange of related information with different suppliers (World Bank, 2007).
Ports have become increasingly dependent on inland transport to improve port performance, such as streamlining cargo transport by decreasing cargo dwell time, reducing port congestion through decreasing transport and ship turnaround time, and improving port productivity and competitiveness. Ports can achieve those improvements through efficient coordination and organization of hinterland transport. Typically, the hinterland transport includes inland trucks, railways, and inland waterway transport that transfer the cargo to and from the ports. Certainly, this maximizes the geographical outreach of the ports.
2
(Acciaro & Mckinnon, 2013). Unfortunately, many ports still suffer from congestion because of irregular flow of hinterland transport, which undermines a port’s performance and the supply chain, no matter how efficient and productive ports are.
The issue of the hinterland is challenging for ports since hinterland transport is one of the criteria that shipping lines, shippers, and logistics service providers strongly take into account when they choose a port (Wiegmans et al., 2008).
Today, ports face many issues that come along with cargo transport, such as the increasing size of ships, which imposes a higher pressure on ports as the size of container ships has reached 19,000 TEUs and is still increasing (JOC, 2014). These issues, among others, increase the need for a robust and rational hinterland transport system that easily accommodates the elevating capacity of cargo.
Therefore, hinterland transport is gaining importance as part of the port subsystem. For example, the United Nations Economic Commission for Europe (UNECE) addressed the weakest link in the global supply chain, hinterland transport and its connection with ports, as the increasing volumes of world trade have resulted in grave bottlenecks in port hinterland connections. This issue was the focus of the UNECE Piraeus in 2008, which considered the most significant problems of hinterland connections, and discussed potential solutions (Woodburn, 2010).
In a large sense, deficient hinterland transport not only increases port congestion, ship turnaround and disruption around the gates and inside the ports, but also increases the cost of transport as ships stay longer, and transport to and from the ports takes a longer time (World Bank, 2008). Consequently, all stakeholders patch up the delay by adding more charges, which eventually must be paid by customers and end users.
3
Despite the increased interest in hinterland transport and its importance for ports and supply chain, it is surprising that few academic studies have actually been conducted to identify the impact of hinterland transport on port performance. However, the degree of this impact and the relationship remains open for further research.
This research will explore the impact of efficient hinterland transport on port operational performance. Therefore, the research takes the Jordanian port and its transport system, NAFITH-TCS (the National Freight Information and Transport Hub) as a case where the researcher will test the relationship between the port and hinterland transport system. The case is favorable for this research because hinterland transport has been improved and organized, as it will be explained further in the Jordanian port and transport chapter (chapter three).
The Jordanian port has developed considerably over the last twenty years. It imports and exports a wide variety of cargoes, dry and wet bulks, general cargo and containers. Notably, the Port of Aqaba plays a very fundamental role in the Jordanian economy as it is considered to be the only maritime gateway in Jordan and most of the country's trade is entirely dependent on the port. The Jordanian port has witnessed many stages of development and concessions, even though it suffered from inefficient inland transport.
The port suffered from irregularities and congestion because of old monopolistic, non-transparent, and unorganized transport systems that created long queues, pollution, and clogging at the gates and in the city of Aqaba. This, without a doubt, influenced the port performance and drove corruption and disruptions in the port area. Unfortunately, that was the case in Jordan before 2006.
4
According to Nathan (2010), research was conducted to assess the economic impact of NAFITH-TCS on the Jordanian port and Jordan, in general. The research found that the project saved around 8 million JOD vis a vis the previous government spending and expenses. Moreover, the research conducted system’s cost-benefit analysis, aside from the improvement in the hinterland transport in Jordan; the profit of the project paid off the cost of the project five years after the implementation.
This research attempts to contribute to the knowledge of the impact of hinterland transport on port operational performance by exploring the importance of hinterland transport, specifically, land transport (trucks), to port performance and the relationship between the two. This research reviews, analyze, and examines the relationship so as to determine whether or not hinterland transport impacts port performance.
1.2. Research Questions and Objectives
The research will focus on the impact of efficient hinterland transport on port operational performance using NAFITH and Jordanian port as a case study. The case study will concentrate on the transport system in Jordan, specifically the NAFITH project, which implemented the truck control system that controls inland transport in the Jordanian city of Aqaba and to and from ports.
The focus of this research will be summarized in four objectives that are sought to be covered and thoroughly discussed herein. For the purpose of plainness and simplicity, the objectives of the research are as follow:
1. To analyze and identify the concepts of hinterland transport and port performance in a broader sense;
2. To explain and identify how efficient hinterland transport (trucks) influences ports in general;
5
4. To determine the impact of NAFITH truck control system on Jordanian port operational performance.
Along with the objectives of the research, this research and the case study are simply expected to present answers to following research questions:
1. What are the concepts (descriptions) of hinterland transport and port performance?
2. How does efficient hinterland transport (trucks) influence ports in a general context?
3. What is the relationship between hinterland transport and port performance?
4. How does NAFITH truck control system influence Jordanian port operational performance?
1.3. Significance of the Study
The research will try to explain the importance of hinterland transport in general, and particularly, trucks as the inland transport system. Moreover, the research will endeavor to determine the relationship between hinterland transport and port performance by analyzing and testing the impact of organized hinterland transport, namely trucks, on port operational performance i.e. bulk terminal.
This study will contribute to the literature as it is an attempt to elaborate on and clarify the relationship between hinterland transport and port performance since there is a scarcity of literature discussing this phenomenon. So, a proposed analytical model that assumes there is a relation between port and hinterland transport will be tested to identify the presumed relationship and impacts.
1.4. Methodology
6
To achieve the aspired objectives and answer the research questions, a quantitative research approach is used. Thus, the research uses the Jordanian ports and NAFITH-TCS as the case to carry out data collection for analyses and findings.
Using a secondary research design, quantitative methods, time series available data is directly collected from the port and NAFITH. As well, further data and background information are gathered through the examination, collection and study of organizational documents, reports, websites, previous research, brochures, and data from the Ministry of Transport.
The quantitative research approach aims to answer the research questions and clarify the impact of NAFITH-TCS, after the organization of inland transport, on Aqaba port performance. However, data analysis will be conducted after collecting and testing the data using regression analysis as a tool and descriptive statistics to describe the findings.
1.5. Dissertation Structure
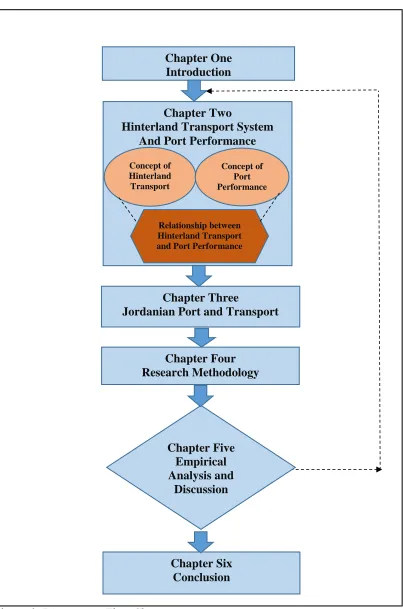
The research, with the case study, consists of six chapters that endeavor to discuss the different aspects and relationships between hinterland transport and port performance and analyze the findings. The chapters are organized as follows:
• Chapter one presents the introduction and background of the study, objectives and research questions, the purpose and significance of the study, research methodologies, and the structure research.
• Chapter two explains, via literature review, the hinterland transport system and port performance. Further, it points out the relationship between hinterland transport and port performance and sets out the conceptual framework.
• Chapter three describes transport systems and ports in Jordan. In addition, it describes the NAFITH truck control system as the focus of the case study. The aim is to provide an overview of ports and the current transport system in general.
7
• Chapter five contains the analysis of the hypotheses and a discussion of the findings.
8
Figure 1: Dissertation Flow Chart
0
Chapter Six Conclusion Chapter Five
Empirical Analysis and
Discussion Chapter One
Introduction
Chapter Three
Jordanian Port and Transport Chapter Two
Hinterland Transport System And Port Performance
Chapter Four Research Methodology
Concept of Hinterland Transport
Relationship between Hinterland Transport and Port Performance
Concept of Port Performance
9
Chapter 2 Hinterland Transport System and Port Performance
2.1. Concept of Hinterland Transport system
Hinterland transport plays a very vital role in any region's market; it enables a swift movement of freight which, ultimately, improves the country's economy and the competitiveness of its ports, especially when the hinterland system is efficient. It becomes essential for national and international economic and trade growth, importantly, when it serves a wide geographical outreach. All modes of transport provide various ways of movement of cargo and freight to meet the needs of industry and transport users under a framework that engages all modes. Many writers have expounded the topic of hinterland transport; some reasoned that the liner shipping challenge has shifted from the sea to ports and then to the hinterlands (Guthed, 2005; Notteboom, 2002).
Furthermore, the hinterland forms a crucial part of port composition. Most ports, despite high engagement in deep sea or feeder services such as transshipment, do have some percentage of transit traffic gateway, i.e. the containers are unloaded from the container ship to the yard then through the gate to the hinterland via modes of transport (Acciaro & Mckinnon, 2013). In this sense, hinterland transport is a paramount component to ports. In their research, Horst and De Langen (2008) stressed the need to analyze hinterland transport systems because the hinterland transport costs are, by and large, more than the maritime costs.
10
2.1.1. Overview of the Hinterland
A port’s hinterland is defined as the inland area to which import cargo is delivered, and export cargo is collected from (Woodburn, 2010). The hinterland flows across the various transport modes, in countries, regions or across corridors. Port hinterland study started in the mid-1980s, as it discussed the optimization and coordination of the system to meet the economic development of ports (Ming-Jun & Yan-Ling, 2012). In this regard, Ming-Jun and Yan-Ling established a multi-objective programming model for a port logistics transport system and economic benefits when choosing the dynamics of hinterlands.
In fact, the literature widely discussed and analyzed the roles, specifications, and advantages of hinterland. Research on hinterlands is wide ranging, such as; (Notteboom & Rodrigue, 2005; Cullinane & Wang, 2006; Woodburn, 2006, 2007). Yang (2002), for example, blended a gravity model and a thorough evaluation model to define magnetism and the scale of service between the port and its hinterland. As well, Bai (2008) genuinely evaluated the relationship of port and hinterland, and constructed a segmentation method dependent on a force model. Fang (2004) argued about the effects of ports on adjoining principal hinterland, subsidiary hinterland, and likely hinterland as he studied the whole system of a port. Lu (2001) analyzed the development and advancement of port logistics and its hinterland.
2.1.2. Hinterland Transport Modes and Development
The intensity and intricacy of landside activities differ significantly depending on the terminal size, transport types, and infrastructure accessibility in the area, and the terminals operation technologies applied. The big terminals, noticeably, rely on a mixture of road and rail transport and also, if available, barge transport. Nevertheless, road transport continues to be one of the major hinterland transport modes given that its flexibility and possible outreach are high owing to the fact that trucks can go wherever there are roads, according to Zuidwijk and van Asperen (as cited in Acciaro & Mckinnon, 2013).
11
1. Inland waterway transport (barges)
Inland waterway transport is the transport of cargo via ships or barges or any water craft in inland canals, rivers, and lakes. between ports and harbors. While still under-utilized, it is considered the most environmentally friendly mode of transport. Inland waterway transport plays a critical role in linking cargo and passengers from remote areas to further or more developed places. It is considered a very valuable alternative in developed countries to relieve road transport congestion and reduce the environmental effects from trucks emissions; this fact helps to contribute more to the growth and development of inland waterways.
Moreover, inland waterway transport has acquired a very considerable importance because it offers cheap and reliable transport, which has attracted many container shippers who have used barge transport since the eighties (van der Horst & de Langen 2008). According to UNCTAD (2008), the European inland waterway transported around 500 million tons of goods in 2007, an increase of 4% from 2006. Moreover, goods transported in the United States, in the same year, amounted to around 800 million tons, China as well along with Yangtze River increased the traffic of inland waterway up to 1.3 billion tons.
2. Railway transport (Trains)
Railway transport is capable of carrying general cargo, containers, and dry/wet bulks, has developed significantly in recent years. The International Union of Railways (as cited in UNCTAD, 2008), reported that railway traffic witnessed improvements and advancements all around the world, especially in BRIC countries, which resulted from the development of demographical aspects and the globalization of trade.
In Europe as well, railways developed very quickly both within countries as in Germany, The Netherlands, Belgium and Sweden or across borders to serve wider hinterlands. The development continues in many countries, such as the United States, Russia, China, and Chile. By doing so, another mode of transport is given a share in the servicing of the hinterland, improving logistics and supply chain and decreasing congestion at ports.
12
of development needs a proper infrastructure which requires capital intensive investment and many private and public investors and agencies to work together harmoniously. Hence, the coordination must rely on specific policy action to perform successfully (van der Horst & de Langen 2008).
Still, many countries may not move forward to invest in railways, nonetheless it is an efficient way to improve terminal integration with intermodal transport.
3. Road transport (Trucks)
Road transport is the haulage transport of goods mainly using trucks that operate on roads as its primary network. It is a more frequently used way to cover the hinterlands, carrying general cargo, containers, dry/wet bulks and dry break bulks. Many issues result from the use of road transport i.e. road congestion, pressure on infrastructure, and environmental and safety issues, especially when the whole system lacks the organized consolidation of its components and/or trans-country outreach.
Despite that, European road transport makes up 90% of inter-urban transport traffic, which means that roads are still highly used among all other modes of hinterland transport (UNCTAD ,2008). Practically, trucks dominate most of the port hinterland traffic, causing most of the congestion in and around port areas, and commonly generating most external costs (Merk & Notteboom, 2015).
So, many ports included a modal shift in their strategic plans, from trucks to rail or inland waterway transport; unfortunately, not all ports are well connected with developed rail systems or have inland waterways. Moreover, in some ports, if it is feasible to elect the use of railways, the cost may outweigh the return on such investment. Therefore, a modal shift in many ports is not applicable, but there is a wide variety of instruments that can be applied to mitigate and lessen the effect of truck usage in hinterland transport, see 2.1.4. and 2.1.5. in this chapter.
2.1.3. Measurement of Hinterland Related Performance
According to the UNECE report (Woodburn, 2010), no uniform method measures
13
that make the comparison very hard. Hinterland can be regarded from a macro level, a
country level, and a micro level, the county's ports and corridors. However, the World Bank
and the World Economic Forum provide an international comparison between countries on
the basis of logistic activities, which aims to quantify countries' logistical performance;
certainly, this incorporates the hinterland links within the index.
Three significant indices can incorporate the hinterland connection performance, those
indices, as stated by Woodburn (2010), are:
The Logistics Performance Index (LPI), produced by the World Bank, which
measures the country's logistics performance friendliness. Based on the World
Bank (2007a), the LPI is composed of six core component. Importantly, they
measure the perceptions of the logistics environment of trading partner countries.
This incorporates customs, border procedures, transport quality, shipment
arrangement, the industry of local logistics, the cost of domestic logistics, shipment
tracking ability, timeliness in shipment arrival to end destination, and IT
infrastructure. Moreover, the index provides information on the logistics
environment in the home country of operation, and the real time-cost performance
data for country of operation.
Trading Across Borders indices, produced by the World Bank and focus on the
specific procedures taken to export and import goods in countries.
The Enabling Trading Index, produced by the World Economic Forum covers
market access, border administration, communication and transport infrastructure
and the business environment (World Economic Forum, 2008).
For the hinterland connection at the individual port or corridor level, there is no regular
analysis. However, ports, individually, can quantify the hinterland performance concerning
the connectivity to inland location through measures related to the number of inland
terminals served, the frequency of service, the journey time, turnaround time, and goods
that terminals or geographical areas receive. Moreover, measures regarding environmental
14
2.1.4. Ways to Improve Hinterland Transport Performance
A wide variety of stakeholders is engaged in hinterland transport, such as private companies, shipping lines, terminal operators, freight forwarders, clearing agents, hinterland transport providers e.g. trucking, rail, and barge companies, in addition to public authorities such as customs, port authorities, inspection services, and infrastructure managers (Horst & De Langen, 2008). Horst and De Langen (2008) analyzed the coordination in hinterland transport, giving different arrangements to enhance coordination in order to improve hinterland transport where more bottlenecks exist throughout supply and logistics chain.
They stated that the development might be hampered by the lack of motivation and incentives for further cooperation, e.g. free-riding problems, information irregularity, and the requirement for contractual obligations, which stem from an imbalance between the costs and benefits and the lack of eagerness to invest. It was recapped that coordination problems are due to many reasons i.e. insufficient information exchange, difficulties in investments, new services requiring basic volumes which might be rejected if not being met, inadequate planning on empty containers, customs and inspections delay and insufficient information about customs clearance of containers.
Furthermore, four major mechanism frameworks were set up to boost coordination, which are, the initiation of incentives i.e. penalty system, different prices, and rewards, generation of inter-firm alliance, and organization scope change and design of collective actions by port authorities and transport firms. Besides, they arranged and classified one of the techniques mentioned above to each coordination problem in the port of Rotterdam, which witnessed improvement and addressed some problems in the hinterland transport.
2.1.5. Optimization of Trucks Flow
15
found that approximately 13 % of trailers had incomplete documents. Hence, by eliminating such trailers, congestion in front of the terminal gates could be relieved.
On the other hand, Motono et al., (2014) conducted a survey at Chennai port in India, which observed heavy trailer congestion. They revealed that only half of import container trailer drivers carried the proper documents, which was believed to be one of the main reasons for ports gate congestion.
Another example comes from the Transportation Research Board (TRB) (2011), which pointed out that the improper documents carried by trailer drivers were one of the causes of congestion at the gates of ports. According to Merk & Notteboom (2015), ports have applied multiple strategies to streamline the flow of trucks, and decrease congestion and other implications of high dependence on truck systems. The strategies are as follows:
1. Port gate strategy
In many ports and ports cities, the port gate strategy was launched to reduce idle trucks in ports and mitigate the traffic so as to reduce urban congestion and environmental impacts. The major policy instruments in this regard are terminal appointment system, extended gate hours, and virtual container yard system.
Truck appointment system
The main aim of the appointment system is to decrease congestion on the roads to terminals or at terminals by granting special treatment to trucks that schedule themselves in the appointment system. The feature of this system is that terminals allocate time for trucks to come to ports, which enables them to spread truck flow more uniformly throughout the day.
16
These applications have developed the flow of trucks, increased terminal throughput and improved productivity for trucking companies and terminals. In addition, truck turnaround time was reduced by 30% on average, as in the case of Georgia Ports Authority, according to US EPA (as cited in Merk & Notteboom, 2015).
Incentives for off-peak traffic
Extended gate-hours endeavor to rearrange the arrival times of trucks to port terminals during the day by offering incentives to motivate the use of off-peak hours that aim to decrease congestion at the terminals and on the city roads. An example of a very popular extended gate time is the PierPASS program, which was employed in Los Angeles and Long Beach ports. It had a Traffic Mitigation Fee (TMF) for truck operation during peak hours paid by the cargo owners; on the other hand, the system exempted trucks calling at off-peak hours.
However, there are drawbacks to this program including long queues just before the off-peak time starts.
Extended gates and dry ports
The extended gates approach is a relocation of part of the port to be closer to the hinterland, by transferring the cargo handling, customs, and other formal procedures to an inland port. This ultimately reduces port terminal and gate congestion. Many ports have developed this concept, such as the case of Antwerp port, which created a network of inland extended gates. Some ports created dry ports by merging the inland terminals and the distribution centers to facilitate hinterland transport systems.
2. Dedicated freight routes
17
3. Potential automated hinterland transport technology
Automated transport is still in the immaturity phase, except for some internal transport at factories or container yards. Notwithstanding, the application of automated freight transport is very seldom. The interest of automation is on the rise; there are many benefits of automation, such as lower labor cost, all day operations and higher reliability (Visser, Konings, Pielage, & Wiegmans, n.d.). In the same paper Visser et al. discussed the most considerable automated transport technology for hinterland i.e. container transport over a radius of 50 to 150 km. Those types of automated transports are;
• Automated trucks and multi-trailer systems;
• Automated trains;
• Automated barge handling systems;
• Automated capsule/alternative rail systems;
The automation requires a highly organized infrastructure, which is an extra cost that needs to be taken into account. Then again, the cost and performance in the above mentioned study showed positive results after labor cost cuts and 24-hour operability.
In light of that, Lloydslist (2016), in a description of truck transport outside the port of Los Angeles and Long Beach, stated that truck turn time or truck queue time is an indication of the quality of the service provided by ports. In summary, efficient inland transport would, of course, reduce congestion at port gates and truck turnaround and waiting time in queues would decrease. In the view of the author, the regulation and optimization of truck performance involves three sides; infrastructure expansion, management and processing, and the political and governmental side.
2.2 Concept of Port Performance
18
outreach, and from the landside heading to the forelands. Given that around 80% of global trade by volume, and more than 70% of its value is transported by sea and handled at ports (UNCTAD, 2015), efficiency in port performance is highly required. For many developing countries the case here is even more important due to the dependence on ports, which handle most of the imports and exports of those countries.
With the limited number of ports, it is fundamental to have efficient ports that avoid congestion, streamline international trade, and thus improve a country's economy and living standards, and port competitiveness (Chin and Tongzon, 1998). Ports may offer splendid services for ships calling at their berths, which satisfy the carriers. On the other hand, ports may not offer satisfactory services for cargo interests; for example, poor inland transport might, or cargoes might not be serviced very well i.e. less added value or poor services.
Ultimately, this situation is the cause behind the fact that some customers become unsatisfied with what they call poor performance. Port performance, or efficiency, is considered a form of output relative to input which quantifies various aspects of port operation (Song & Cullinane, 1999). On the other hand, measurement of such performance has become of high importance, owing to the wishes of all stakeholders to deal with an efficient port with very good quality performance.
According to Song (2012), measuring performance is always sought for many reasons namely;
1) To monitor activity;
2) To compare present with past performance; 3) To compare present with target performance; 4) To compare with competitors’ performance; 5) To adjust targets;
6) To promote the business;
7) To check port’s efficiency, productivity, and effectiveness.
19
any one on its own to rate performance. Performance comparison among different ports is not similar. It is a very insubstantial issue as there are great differences in the geographical locations of ports, and this sometimes influences their technical structures (Suykens, 1983). Ports are different in size, number and size of ships calling the port, as well as the variability of goods passing through; hence, considerable intricacy is entailed in benchmarking performance measurement. The lesson here is that port performance is not measured from one side or a single value i.e. seaside. It is a set of complex activities and inclusive measures that encompass multi-faceted factors in the port. Ports, in fact, entail a composite group of activities with many diverse input and output sources that make comparisons between two ports very difficult (Valentine and Gray, 2002).
In fact, a meaningful evaluation of port performance, according to De Monie (1987), needs to take into account the following factors:
1) Ship stay duration in the port (ship turnaround); 2) Cargo handling quality;
3) Service quality of inland transport trucks during time at the port, truck turnaround time.
The concept of port performance has grown rapidly and has started to be used widely. Monitoring port performance has become a more challenging and difficult task than it used to be (Park and De Langen, 2004). Nevertheless, performance contains overall productivity, efficiency, effectiveness and economy of the port as it is always used jointly with port efficiency and effectiveness. Truly, we need to understand all port performance measures and identify them to set forth the required actions. To do so, most ports use port performance indicators and key performance indicators (KPIs).
20
2.2.1 Traditional Port Performance Indicators (PPIs)
As suggested by UNCTAD (1976), port performance indicators are classified into financial indicators and operational indicators as shown in Table 1 and Table 2. This is still a valid way of configuring port performances, but it is considered a traditional way that brings about productivity and effectiveness as measures of port performance.
Table 1: Financial Indicators
Financial indicators Units
Tonnage worked Tons
Berth occupancy revenue per ton of cargo Monetary units/ton Cargo handling revenue per ton of cargo Monetary units/ton
Labor expenditure Monetary units/ton
Capital equipment expenditure per ton of cargo
Monetary units/ton
Contribution per ton of cargo Monetary units/ton
Total contribution Monetary units/ton
Source: (UNCTAD, 1976)
Table 2: Operational Indicators
Operational indicators Units
Arrival date Ships/day
Waiting time Hours/ship
Service time Hours/ship
Turnaround time Hours/ship
Tonnage per ship Ton/ship
Fraction of time berthed ships worked - Number of gangs employed
per ship per shift
Gangs
Tons per ship-hour in port Ton/hour
Tons per ship hour at berth Ton/hour
Tons per gang hours Ton/hour-hour
Fraction of time gangs idle -
Source: (UNCTAD, 1976)
21
measurement of port performance and efficiency, should not only be restricted to quantitative indicators but could also comprise qualitative measurements (Antão, Soares and Gerretsen, 2005).
2.2.2. Container Terminals PPIs
Ports are focusing on quantifying and improving container terminal performance indicators because of the rapid growth in container trade. Besides, there is fierce competition from inter-ports in the surrounding regions to attract more customers and set an example of a paramount performance that makes all customers more satisfied. Hassan and et al. (1993), proposed that interrelated port operations are divided into four classes, namely ship operations, cargo handling, warehousing, and inland transport.
In the same way, Koh and Ng (1994) divided operational activities in container terminals into the following aspects;
1) Berth operation: The key element here is the time a ship spends in the berth which is widely known as ship turnaround time. At arrival, ships are allocated with a specific berth, cranes and other quay services to load and unload cargo.
2) Ship operation: In this activity, the cargo is loaded and unloaded to/from the ship using an arranged numbers of quay gantry cranes; in this respect, a good plan to achieve high throughput, i.e. in TEUs (Twenty Foot Container Equivalent Unit), must be conducted to optimize the output per hour.
3) Yard operation: This is considered the busiest among all other activities where containers are stowed, shuffled, shifted, handled from hauling transport, and/or moved to another terminal yard.
4) Gate operation: It deals with entry and exit of import and export cargoes to/from the yard or the quay through modes of transport viz. railways and trucks. Generally, this kind of transport is mastered by freight forwarders.
22
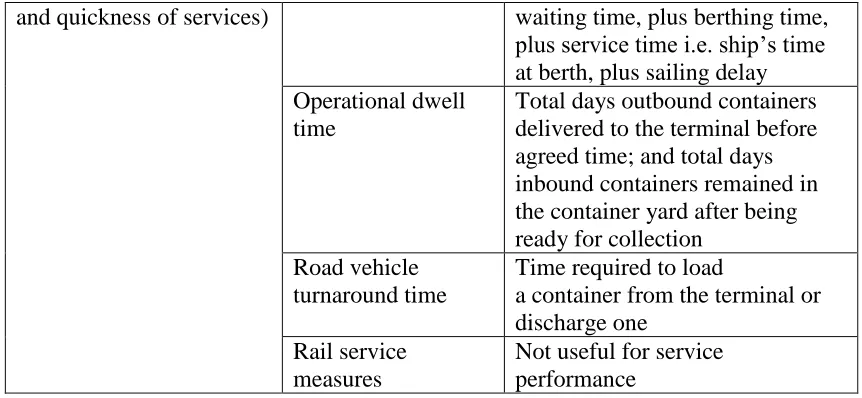
Moreover, with respect to the aforementioned activities, more comprehensively and inclusively, as shown in Table 3, Thomas and Monie (2000) categorized performance measures into four groups, which are;
Production measures: That is, the traffic measures, identified in "Measuring Container Terminal" (2012) as, “the quantity of cargo passing through a terminal
in unit time, and/or throughput measures, which signifies the effort involved in moving that cargo, in terms of container movements per unit of time.”
Productivity measures: “The ratio of output to input, in general terms, productivity is expressed in terms of the quantity of production (items, tones, units etc.) achieved per unit of resource (per person, per square meter, per item of equipment) in unit time (day, week, month etc.)” ("Measuring Container Terminal," 2012). This measure is very important for the ports and/or terminal operator due to the fact that it involves the cost of the terminal operation.
Utilization measures: They are measures of how intensively the production resources are used, and are generally calculated as a ratio, expressed as a percentage, between the actual use of a resource and the maximum possible use of that resource over a particular time period ("Measuring Container Terminal," 2012).
Service measures: They indicate the quality of service to the terminal’s customers, such as ship operators, shippers and receivers of cargo, and transport operators. They signify the satisfaction to those customers with the services offered. The operators of terminals must be concerned not only with trade, traffic, and efficiency, but also with the degree to which the terminal meets customer’s requirements for a reliable, regular and rapid service ("Measuring Container Terminal," 2012).
Table 3: Port Performance Measures
Category Relevant measures Reflection
Production measures (traffic throughput per unit of time)
Ship throughput Containers loaded on or discharged from the ship in a given time period (a shift, day, month or year).
Quay transfer throughput
23
Container yard throughput
Movements sum in the storage areas
Receipt/delivery throughput
Outbound & inbound containers
Productivity Measures (ratio of the output to the input)
Ship productivity Container handling rate of a ship's call to the time taken to service the vessel
Crane productivity Calculated per crane in gross and net values
Quay productivity Relation between production and quay resources in unit time/ by working on length of the quay or per meter of the quay
Terminal area productivity
Ratio between terminal production and total
terminal area for a given unit time.
Equipment productivity
Number of container's moves per working hour for an individual machine or for the stock of a particular type of machine Labor productivity Productivity of man-hour over a
measured period
Cost effectiveness Cost of handling terminal container traffic or throughput over a specified period, month/year
Utilization Measures (how intensively the production resources are used)
Quay utilization Amount of time that the berth was occupied out of total time
available
Storage utilization Comparison of storage slots occupied out of the total number of available slots according to the yard’s design capacity
Gate utilization Smooth and rapid processing of incoming and outgoing inland trucks at the gate
Equipment utilization
Proportion of time it was effectively deployed over a specified period
Services Measures (reliability, regularity,
Ship turnaround time1
Total time, spent by the vessel in port, in a given call. The sum of
24
and quickness of services) waiting time, plus berthing time, plus service time i.e. ship’s time at berth, plus sailing delay Operational dwell
time
Total days outbound containers delivered to the terminal before agreed time; and total days inbound containers remained in the container yard after being ready for collection
Road vehicle turnaround time
Time required to load
a container from the terminal or discharge one
Rail service measures
Not useful for service performance
Resource: (Thomas & Monie, 2000)
2.2.3. Common Port Operating and Financial Measures
According to the World Bank’s (2007b) Port Reform Toolkit, port regulation module, module 6, the common indicators of port operation and financial performance were outlined in one set. However, very frequently, separate values for indicators need to be specified to be consistent with different major categories of port traffic and vessel types i.e. containers, breakbulk, dry and liquid bulk. Those indicators facilitate the overview of performance for different categories. Table 4 explains those indicators and the calculation method as well.
Table 4: Common Performance Indicators
Operating Measures
Average ship turnaround time
Total hours vessels stay in port (buoy-to-buoy time) divided by total number of vessels
Average ship waiting (idle) time (for berth)
Total hours of vessels waiting for berth divided by total number of vessels berthed
Average vessel time at berth
Total hours alongside berths divided by total number of vessels berthed
Average waiting rate (%)
Total hours vessels wait for a berth (buoy-to berth time) divided by total time at berth
Gross berth productivity
Number of container moves or tons of cargo (for breakbulk and bulk cargoes) divided by the vessel’s total time at berth measured from first line to last line
Berth occupancy rate (%)
Total time of vessels at berth divided by total berth hours available
Berth utilization rate (%)
25 Working time over time
at berth
Total time of vessels being serviced at berth divided by total hours at berth. Reasons for non-working time may include labor disagreements and work rules, rain, strikes, equipment failure, port operating schedules, and holidays
Cargo dwell time Cargo tons times days in port from time of unloading until the cargo exits the port, divided by cargo tons
Ship productivity indicator
Total number of moves (for containers) or tons handled (for breakbulk and bulk cargoes) divided by total hours in port Tons per gang-hour Total tonnage handled divided by total number of gang-hours
worked
TEUs per crane-hour Total number of TEUs handled divided by total number of crane-hours worked
Average Tons per ship-day (hour)
Total tonnage of cargo handled divided by total number of vessel days in port
Average vessel call size The average in tons Financial Measures
Operating surplus per ton handled
Net operating income from port operations divided by total tonnage of cargo handled
Charge per TEU Total charges for container handling divided by total TEUs handled
Collected charges per billed charges
Total collected charges as a percent of accounts billed (with 30-day lag)
Resource: (World Bank, 2007b)
The input data is usually readily obtainable from operational reports produced by the operators of terminal or ports. Alternatively, the berth occupancy indicators are calculated independently for container, general cargo, and bulk ships. With regard to vessel waiting time, for example, the input data are also usually obtainable from port, customarily the harbormaster’s office, or the operational reports of the terminal operator (World Bank, 2007b).
26
2.2.4. PPIs for Logistics Products
In their analytical study to find new port performance indicators (PPIs) for port logistics, De Langen, Nijdam, and Horst (2007), identified a number of important new PPIs. Most important, is the connectivity index, which can be used to quantify how well a port is connected to overseas destinations asserting that such an index is used in airports, but this index does not yet exist for seaports. Hence, a realistic approach is needed to develop such index that encompasses both hinterland and foreland accessibility by calculating the quality of connections, with respect to frequency and transit time, to a large number of ports and terminals.
Moreover, the analysis above provided another new PPIs for port logistics e.g. the percentage of goods to which value is added in the port region, the average throughput per square meter, value added per square meter, consumer benefits from low transport costs, and the price of warehouse space. Despite the fact that not many ports gather PPIs for their logistic performance i.e. logistics products, ports are able to distinguish their part in the logistics chain. For example, ports such as Rotterdam and Antwerp assemble data on warehouses and other logistics services in the port.
2.2.5. Port Performance and Hinterland Transport
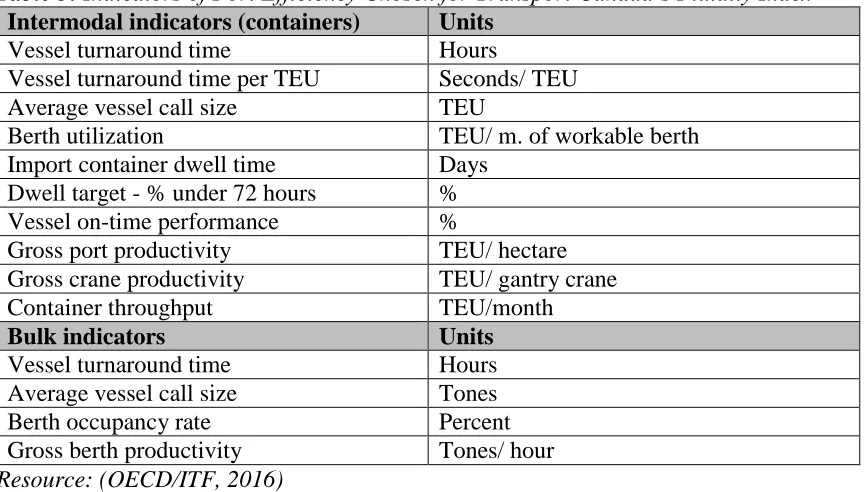
In the usual course of events, data for major port operations has been rather easy to obtain as most ports supervise the common features of their operations. Port operators are motivated to make available relevant statistics because it is important for port competition, cargo carriers, and terminal service providers. In Canada, the government has developed a transport fluidity index. It is composed of performance indicators that highlight port performance and hinterland intermodal services (OECD/ITF, 2016). The fluidity index was effectively employed to encourage and develop transport services through Canada’s gateway ports, competing with US port routes, to industrial centers in the US.
27
companies and operators to utilize the GPS data to discover bottlenecks leading to or at the port.
Table 5: Indicators of Port Efficiency Chosen for Transport Canada’s Fluidity Index
Intermodal indicators (containers) Units
Vessel turnaround time Hours
Vessel turnaround time per TEU Seconds/ TEU
Average vessel call size TEU
Berth utilization TEU/ m. of workable berth
Import container dwell time Days Dwell target - % under 72 hours %
Vessel on-time performance %
Gross port productivity TEU/ hectare
Gross crane productivity TEU/ gantry crane
Container throughput TEU/month
Bulk indicators Units
Vessel turnaround time Hours
Average vessel call size Tones
Berth occupancy rate Percent
Gross berth productivity Tones/ hour Resource: (OECD/ITF, 2016)
All in all, the overview of port performance indicators showed that quite a large number of PPIs are being used. However, different ports use different PPIs; it is the port that defines the performance indicators to improve the port among other competing ports and to develop the port's trade for more profitability and efficiency (Esmer, 2008). This means that there is no uniform scheme for indicator calculations. Beyond doubt, this seaport practice is the foremost weakness of existing PPIs measurement.
2.3. Relationship Between Hinterland Transport System and Port performance After a review of both the academic literature and the current policies and frameworks, it is very clear that port hinterland transport has become important as it concerns all supply and logistics chain policy makers. On that basis, it is likely that decision makers in the logistics and supply chain consider the characteristics of the whole chain instead of focusing on specific legs (Woodburn, 2010).
28
transport system is one of the factors that influences port performance, as it largely boosts port efficiency and productivity. The better-organized the transport, the better and more promising port performance will be.
If the hinterland transport is poor or inefficiently organized, no matter how good the port assets are, it still undermines port performance as outlined earlier. For example, shippers and shipping lines will reconsider trading via that port. With the development of the logistics chain and the transport of the hinterland, according to Heaver (as cited in Acciaro & Mckinnon, 2013), shipping lines may change ports of calls and commit to other terminals just to have a secure capacity and maintain flexibility. Given that, these inefficient terminals lose their competitiveness and their customers because of longer ship turnaround time, which normally results in higher cost of inventory and negative ramification in the entire supply and logistics chain.
Also, hinterland transport is one of the most important pillars of the logistics structure. By and large, transport from and to ports is considered vital for shippers, carriers, consignors, and consignees. They all seek routes with lower cost, ports offering efficient hinterland connectivity throughout reliable modes of transport, and with shorter ship waiting time at ports (Robinson, 2002). The efficiency of hinterland transport is what keeps the port rigorous; indeed, it is one of the important issues in port performance.
Horst and De Langen (2008) emphasized that and stated, “Ports and their hinterland transport systems can only attract and manage additional container volumes if the hinterland transport network is organized efficiently and effectively.” In other words, once the terminal throughput/tonnage increases due to efficient hinterland transport (containers traffic), port operational performance improves; thus, it is a sign of a relationship between hinterland transport and port performance.
29
cargo handled in the port can reach its hinterland destination (Merk & Notteboom, 2015). As such, the vital role of hinterland connections is known as one of the most fundamental issues in port competitiveness and development all around the world.
Unfortunately, the connections of port hinterlands have not followed the same pace of economies of scale in ship size and the related surfacing of hub and spokes ports (Merk & Notteboom, 2015). Therefore, this has clearly aggravated the bottlenecks in hinterland connectivity and created more congestion and disruption in port performance.
2.3.1. Hinterland and Ports as Logistics Chain
Over the last few decades, there has been a very quick growth in world throughput as a result of liberalization of international trade, globalization, industrialization, and the expansion of the geographical dispersion of products (OECD/ITF, 2009). Consequently, extensive pressure was placed on many port aspects like the hinterland transport connections, which increased the consequent economic, social, and sustainable issues, and more importantly, the cost and expense issues, i.e. increased supply chain costs, which stem from inefficient hinterland transport connections (Woodburn, 2010).
The transport system is important for shaping and deciding the costs in trade, an ECMT2 and HM Treasury3 study (as cited in Woodburn, 2010) stated that the cost of transport is directly affected by the performance of the transport system and logistics costs. Besides, the transport cost is still considered a barrier to the global trade.
In such a globalized world, efficient transport systems, inland or maritime, become an urgent requirement for the global supply chain. The development of global logistics chains has had a major impact on the function of ports along with hinterland connections (OECD/ITF, 2009). The concept of port hinterland related issues i.e. supply and logistics chain and the economic context was thoroughly covered and discussed in the literature (OECD/ITF, 2008; de Langen, 2008; Notteboom, 2008; Zhang, 2008). De Langen (2008), for example, emphasized that the cost of the transport chain, specifically door-to-door services, is higher than the maritime transport and ports charges together. As well,
2ECMT: European Conference of Ministers of Transport.
30
Notteboom (2008) reasoned that carriers are aware of the growing importance of inland transport quality as it connects their customers and affects door-to-door service and the whole logistics chain.
Therefore, shipping lines have attained or improved cooperation and arrangement with terminal operators to be involved in the inland, rail and inland waterway transport operations serving port hinterlands. Moreover, the literature discussed the logistics chain and its contents, in general, giving a wider look at the inland transport system, hinterland transport, and how it affects the port and its logistics. Most agreed that a port’s success, progress, and competitive strength do not exclusively depend on its developed infrastructure, high productivity and performance per se, but also on other dynamic factors such as its hinterland connections.
It is crucial to have an effective and active hinterland transport system that is highly integrated with the logistics and supply chain. This certainly improves the fundamental performance of the port. In their research about port supply chain integration, Song and Panayides (2008) defined important parameters that enhance port integration and thus port performance and competitiveness such as, inter alia, the relationship with inland transport operators.
In view of the fact that container ports are considered as a main link in the global logistics chain, as asserted in Horst & De Langen (2008), the competition between ports has shifted to competition between transport chains, i.e. logistics and supply chain. Consequently, ports are keen to develop the quality of their hinterland transport system.