California State University, San Bernardino California State University, San Bernardino
CSUSB ScholarWorks
CSUSB ScholarWorks
Electronic Theses, Projects, and Dissertations Office of Graduate Studies
6-2015
ALGEBRA 1 STUDENTS’ ABILITY TO RELATE THE DEFINITION OF
ALGEBRA 1 STUDENTS’ ABILITY TO RELATE THE DEFINITION OF
A FUNCTION TO ITS REPRESENTATIONS
A FUNCTION TO ITS REPRESENTATIONS
Sarah A. Thomson CSUSB
Follow this and additional works at: https://scholarworks.lib.csusb.edu/etd
Part of the Algebra Commons, and the Science and Mathematics Education Commons
Recommended Citation Recommended Citation
Thomson, Sarah A., "ALGEBRA 1 STUDENTS’ ABILITY TO RELATE THE DEFINITION OF A FUNCTION TO ITS REPRESENTATIONS" (2015). Electronic Theses, Projects, and Dissertations. 215.
https://scholarworks.lib.csusb.edu/etd/215
ALGEBRA 1 STUDENTS’ ABILITY TO RELATE THE DEFINITION OF A
FUNCTION TO ITS REPRESENTATIONS
A Project
Presented to the
Faculty of
California State University,
San Bernardino
In Partial Fulfillment
of the Requirements for the Degree
Master of Arts
In
Teaching:
Mathematics
by
Sarah Carrillo Thomson
ALGEBRA 1 STUDENTS’ ABILITY TO RELATE THE DEFINITION OF A
FUNCTION TO ITS REPRESENTATIONS
A Project
Presented to the
Faculty of
California State University,
San Bernardino
by
Sarah Carrillo Thomson
June 2015
Approved by:
Joseph Jesunathadas, Committee Chair, Education
Davida Fischman, Mathematics
iii ABSTRACT
One hundred high school Algebra students from a southern California
school participated in this study to provide information on students’ ability to
relate the definition of function to its representations. The goals of the study were
(1) to explore the extent to which students are able to distinguish between
representations of functions/non-functions; (2) to compare students’ ability to
distinguish between familiar/unfamiliar representations of
functions/non-functions; (3) to explore the extent to which students are able to apply the
definition of function to verify function representations; and (4) to explore the
extent to which students are able to provide an adequate definition of function.
Data was collected from written responses on a math survey consisting of items
that asked students to decide if given illustrations are representations of
functions, to explain how the decision was made, and to supply the domain and
range when applicable. The questions included seven types of illustrations:
graphs, equations, ordered pairs, tables, statements, arrow diagrams, and
arbitrary mappings. Findings indicated that students were more able to correctly
identify familiar than unfamiliar function representations. The easiest
representation for students to correctly identify was the graph of a linear function
and the most difficult was the graph of a piecewise function. A conjecture as to
why this occurred is that the formal definition of function is not often emphasized
or referenced when function and its representations are introduced so students
iv
representations. The explanation, domain, and range responses were sketchy. A
conjecture as to why this occurred is that in general, students have difficulty
expressing themselves orally and in writing or perhaps students had not learned
about domain and range. A separate question asked students, “What is a
function?” To this question, students provided a variety of responses. It is
suggested that conducting further studies that include student interviews and
participants from multiple teachers, would provide increased understanding of
how students learn the definition of function and the extent to which they are able
to relate it to its representations.
v
ACKNOWLEDGEMENTS
I would like to thank and express highest appreciation for the members of
my committee: Dr. Joseph Jesunathadas (Project Chair), Dr. Davida Fischman,
and Dr. Madeleine Jetter. They provided boundless encouragement, patience,
and support over the course of a long journey to make the completion of this
project possible. I would like to thank Dr. Shawn McMurran for her inspiration,
and Jack Yakutake for his invaluable insights.
I want to express special appreciation to my family. Special thanks to my
son, Eddie, for the periodic, gently reminder: “How’s your paper coming along?” I
also thank: my daughter, Jayme, for encouragement; my son, Ryan, for
invaluable resources; my daughter, Erin, for help with editing; Ed for
perseverance; and to Noel, John, Stephanie, for behind-the-scenes support.
I also want to give heartfelt thanks to Kyler, Alexis, Cole, Ethan, RJ, Emily,
and Little S for providing motivation, and to my parents, Charles and Gladys
Carrillo, for life-long support of my educational pursuits.
Above all, I thank the Creator for guidance, learning, and wisdom acquired
along this journey.
vi
TABLE OF CONTENTS
ABSTRACT ... iii
ACKNOWLEDGEMENTS ... v
LIST OF TABLES ... viii
LIST OF FIGURES ... ix
CHAPTER ONE: INTRODUCTION A Classroom Experience ... 1
National Struggles ... 3
Statement of the Problem ... 6
Purpose of the Study ... 8
Participant Description ... 9
Significance of the Study ... 10
Limitations of the Study ... 11
CHAPTER TWO: LITERATURE REVIEW What Factors Affect Students’ Ability to Relate the Definition of Function to its Representations? ... 13
Nature of a Definition ... 14
First Impression ... 16
Roles and Features of a Mathematical Definition ... 17
Procedure versus Process ... 20
Operative versus Inoperative Definition ... 21
vii CHAPTER THREE: METHODOLOGY
Sample ... 26
Terminology ... 27
Instrumentation ... 28
Data Analysis ... 33
CHAPTER FOUR: FINDINGS AND RESULTS ... 37
Descriptive Statistics of Measured Person and Measured Item for Yes/No Items ... 38
Descriptive Statistics of Measured Person and Measured Item for Explanation Items ... 44
Percent Comparison of Yes/No Items ... 48
Definition of Function ... 59
Most/Least Correct Responses to Yes/No Items ... 61
CHAPTER FIVE: DISCUSSIONS AND CONCLUSIONS Familiar Representations ... 64
Function Definition and its Relation to its Representations ... 65
Conclusion ... 68
APPENDIX A: EXPLANATION RUBRIC ... 69
APPENDIX B: DESCRIPTORS ... 71
viii
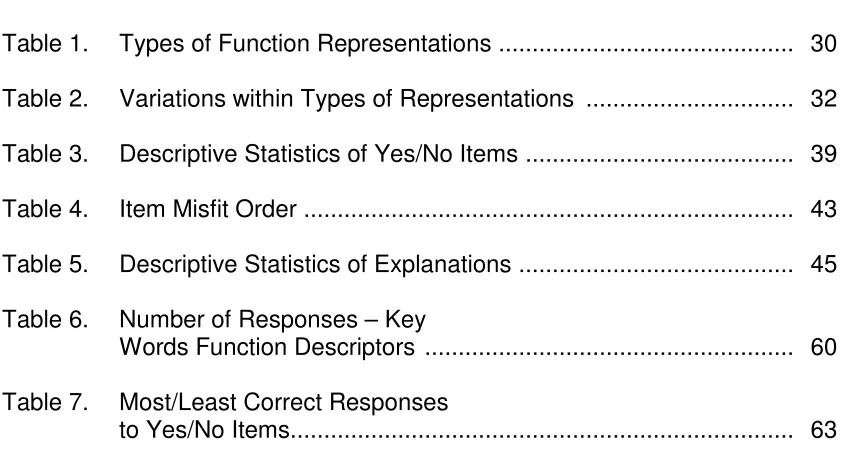
LIST OF TABLES
Table 1. Types of Function Representations ... 30
Table 2. Variations within Types of Representations ... 32
Table 3. Descriptive Statistics of Yes/No Items ... 39
Table 4. Item Misfit Order ... 43
Table 5. Descriptive Statistics of Explanations ... 45
Table 6. Number of Responses – Key Words Function Descriptors ... 60
ix
LIST OF FIGURES
Figure 1. Variable Map of Yes/No Items ... 41
Figure 2. Variable Map of Explanations ... 47
Figure 3. Graphs of Functions/Non-functions ... 50
Figure 4. Equations of Functions/Non-functions ... 51
Figure 5. Ordered Pairs Representing Functions/Non-functions ... 52
Figure 6. Table Values Representing Functions/Non-functions ... 53
Figure 7. Statements Describing Functions/Non-functions ... 54
Figure 8. Arrow Diagrams Representing Functions/Non-functions ... 55
Figure 9. Arbitrary Mappings Representing Functions/Non-functions ... 56
Figure 10. Function/Non-function Representations – All 25 Questions ... 58
1
CHAPTER ONE
INTRODUCTION
A Classroom Experience
More than 36 years ago, when I taught Algebra 1 for the first time, I
thought that teaching functions would be quite simple. During my first lesson on
functions, I introduced the definition as a relationship between two sets such that
every element in the first set is mapped to exactly one element in the second set.
I compared a function to a true love story where for every x there was one and
only one y . My students enjoyed the story and seemed to have grasped the
notion that each input was related to exactly one output. So, I moved on to the
graphs of functions and how to identify them. I explained how to use the vertical
line test and this aligned nicely with the true love story. I modeled use of the
vertical line test with the graph of y =x. So far, teaching about functions was
simple and all was well. The next day, students were asked to apply the definition
of function to distinguish between graphs of functions and non-functions. I
thought this would follow easily from the “definition” of function that was learned
the day before. Students were given the graphs of y =3 , yx =x2, y = 1,
x and
=4
x . The first graph looked similar to the previous day’s example so it brought success throughout the room; then, the struggles started. Students applied the
2
two different x values shared the same y value. Students applied the vertical
line test to y = 1
x, and decided it was not a function because x values near zero appeared to have no assigned y values since the y values could not be seen
on the calculator’s viewing screen. Students attempted to apply the vertical line
test to x=4 and they were confused because they didn’t know how to run a vertical line through a vertical line. Students were also confused because there
were no y’s in the equation. I explained that a vertical line has an infinite number
of y values assigned to one x value so x =4 is not a function. Furthermore, I
explained that the other two graphs were representations of functions even
though in one graph, some x values had the same y values, and in the other
graph, for one x value, the y value was undefined. My words were met with
blank stares and after about 5 seconds of silence, I heard from around the
classroom the four little words that I came to dread with each succeeding lesson,
“I don’t get it.” My students didn’t learn much about functions that day; but I
learned something about teaching functions. Teaching functions was not going to
be easy.
I tried to understand why students struggled with the notion of function and
its representations and I tried many different approaches to teach about functions
and some approaches worked better than others. However, I knew that I was
only treating the symptoms, not the cause. I envisioned my students floating on a
3
holes as they randomly sprouted. At that time, in the absence of organized
curriculum standards, educational research and data, my quest to provide the
best chance of success for my students was a challenge, an isolated endeavor
and often based on intuition. For many years, I wondered why students struggled
with learning about functions and I often felt overwhelmed as I struggled with how
to obtain better understanding that would help facilitate increased student
success.
National Struggles
The concern for improving student success is not new and in the early
years of education, there was not much joint effort to standardize content or
understand cognitive development. Teachers were expected to somehow know
what to teach, how to teach, and to produce highly successful and proficient
students. I recall asking an administrator in the mid-seventies, “What shall I
teach?” To my bewilderment, the reply was, “Whatever you want.” Things have
come a long way since then, but not without some hit and miss efforts and some
harsh reality checks at all educational levels.
In 1983, the struggles that manifested in individual classrooms
amalgamated into what the National Commission on Excellence in Education
(NCEE) proclaimed as a national rising tide of mediocrity in public schools
(NCEE, 1983). This proclamation brought national attention to low performance
4
increase student achievement (NCEE, 1983). Some important improvements
were made in educational planning, infrastructure, and instruction; however,
direct positive effects on learning in the classroom were inconsistent. Fifteen
years after the beginning of the reform, the tide of minimum student achievement
had not receded (Bennett, et al., 1998).
Near the end of the 20th century, students’ under performance and
struggles were thought to be mostly attributed to lack of rigorous academic
standards. In response, in 1997, California Content Standards (CCS) were
adopted and a Standardized Testing and Reporting (STAR) program was
authorized. From 1997 to 2012, the expectation was that CCS would instill rigor
in content and produce high student achievement by explicitly stating what
content and concepts should be taught at every grade level (CDE, 2013).
However, annual test results continued to bring disappointing news. In 2002,
STAR revealed disappointing results: 65% of California Algebra students scored
basic, below basic, or far below basic (CDE, 2012). Between 2003 and 2012,
high school Algebra scores improved but the rate of improvement declined yearly
and in 2013, Algebra STAR scores declined for the first time in more than a
decade: 74% of ninth grade students, 87% of tenth grade (mostly repeating)
students, and 90% of eleventh grade (mostly repeating) students scored at basic,
below basic or far below basic (CDE, 2013).
On a global scale, low performance was equally disheartening: results of
5
international assessment given every three years to 15 years olds in participating
countries to assess competency in mathematics, science, and reading, indicated
that the US ranked 35th in mathematics proficiency compared to other developed
countries (U.S. Department of Education (ED), 2013). In 2012, the test had
special focus on mathematics and 65 countries participated in the assessment
(ED, 2013). The US was outperformed by participants from East Asian countries;
Shanghai ranked highest followed by Singapore, Chinese Taipei, Hong Kong,
Korea and Japan (Sedghi, Arnett & Chalabi, 2013).
2012 PISA results further revealed that on a 6 level mathematics
proficiency scale, the US had an alarming 25.8 share of low performers that
scored below Level 2 contrasted with an 8.8 share of top performers scoring at
Level 5 or 6. (ED, 2013). The report also indicated a disappointing trend in
mathematics proficiency for US participants: compared to 2003, the number of
students in the 90th, 75th, and 50th percentiles dropped slightly in each level, the
number in the 25th percentile remained the same, and the number increased
slightly in the bottom 10th percentile (ED, 2013).
Secretary of State, Arne Duncan, responded to the results:
The big picture of U.S. performance on the 2012 PISA is straightforward
and stark: It is a picture of educational stagnation. That brutal truth, that
urgent reality, must serve as a wake-up call against educational
6
basically losing ground. We’re running in place, as other high-performing
countries start to lap us (ED, 2013).
Through the years, it became increasingly obvious that eliminating
mediocrity in education would take more than the creation of a list of standards.
Statement of the Problem
Simply stated, the problem is that in American classrooms, students are
struggling with learning and understanding fundamental concepts in mathematics
and there is no doubt that for the last three decades the problem of
underachievement in U.S. classrooms has become increasingly grave and is now
manifested on a global scale. In the Fall of 2012, a Report of the Council on
Foreign Relations warned that the US “will not be able to keep pace—much less
lead—globally unless it moves to fix the [students’ underachievement] problems
it has allowed to fester for too long” (U.S. Education Reform and National
Security, 2012).
On state and national levels, huge collaborative efforts and resources
were extended to develop Common Core State Standards (CCSS) and
Standards for Mathematical Practices (SMP). Extensive research on cognitive
development played a big role in the development of CCSS and SMP;
progression in content expertise is based on how students’ mathematical
knowledge, skill, and understanding develop over time. CCSS and SMP require
7
time, CCSS has given educators more flexibility to use their own expertise in
developing lesson plans and curriculum to address the individual needs of the
students in their classrooms. As a result of these expectations, teachers face
increased responsibility to gain understanding of how students learn.
Teachers presently extend huge efforts to facilitate learning in their
classrooms, however, many teachers do not understand how students learn.
There exists a disconnect between instruction which is rooted in expert content
knowledge, and students’ abecedarian ability to grasp knowledge; and as a
result, instructors do not know that what they say is not always perceived or
assimilated by students as they intended (Wu, 2006). Instructors may not be
aware of a need to reference old knowledge, point out connections, and plan
activities for clarification to assure that students acquire expertise in the content.
Without understanding how students learn, instructors’ efforts may be ineffective;
students may fail to develop precise, clear, and complete understanding of
mathematical concepts; and, when the concepts are fundamental to the study of
mathematics, the problem can be highly debilitating to students’ success at all
levels of mathematics.
Understanding how students learn mathematics is a huge and complex
requirement. One way to begin this quest is to gain understanding of how
students perceive and learn fundamental concepts and definitions. One of the
fundamental concepts in Algebra is functions and it establishes a foundation for
8
the concept of function, its definition, and its relation to representations is an
important endeavor.
Purpose of the Study
In order to gain increased insight into how students learn fundamental
mathematical concepts, this study was conducted to investigate the concept of
function, in particular, its definition and students’ ability to relate the definition to
its representations.
This study examined students’ ability to relate the definition of a function to
distinguish between function and non-function representations. The specific
goals of this study are:
1. To study the extent to which students are able to distinguish
between representations of functions and non-functions,
2. To compare students’ ability to distinguish between function and
non-function representations to the students’ familiarity with the
representations,
3. To explore the extent to which students are able to apply the
definition of function to verify representations of functions, and
4. To explore the extent to which students are able to provide a
complete, clear, and precise definition of a function.
The assessment instrument used for this study was a function survey that
9
consists of items that ask students to decide if given illustrations are
representations of functions, to explain how the decision was made, and to
supply the domain and range when applicable. The survey also asked students
for a one or two sentence answer to the question, “What is a function?”
Participant Description
The participants in this study were 100 ninth grade high school students
enrolled in regular, college-preparatory Algebra 1 ninth-grade classes. The
students were enrolled with the same Algebra 1 teacher during various periods of
the day. The teacher and students volunteered to participate in the study and the
students were randomly selected.
The high school that the students attended is located in an urban area in
Southern California. The school has a large population with approximately 80%
Hispanic students.
The study was performed near the end of the school year after STAR
testing. The students had received instruction in all of the 1997 Algebra
Mathematics Content Standards which include the function concept, function
definition, and representations of functions.
None of the participating students required special instructional or
10
Significance of the Study
The need to increase student performance in Mathematics is not new and
various endeavors have been extended to increase student performance in
Mathematics. Ultimately, the role of making the biggest difference lies at the
ground level, i.e. with the instructor in the classroom. Classroom instructors are
diligent in preparing instruction and knowing their students’ needs; however,
research reveals that even with what is taken to be good instruction, many
students understand less than we think they do (Wu, 2006). Thus it is
increasingly important that instructors focus on the most important concepts,
concentrate on the quality of information presented, and understand how
students learn.
In California, in 2014, CCS and STAR were eliminated and along with 48
states, California adopted Common Core State Standards (CCSS) and a Smarter
Balanced Assessment System (CDE, 2014). These adoptions bring consistent
rigorous content standards across states and provide more guidance and support
to maximize the expertise of the instructor in the classroom. CCSS and the
accompanying Standards for Mathematical Practice (SMP) ask teachers to
narrow effort and energy in order to instill expertise at a deeper conceptual level.
Rather than provide a list of what to teach, CCSS and SMP organize
mathematics content and teaching so that students understand mathematics and
do not just memorize procedures (CDE, 2013). CCS incorporates the view of its
11
they have learned, but …to extrapolate from what they know and apply their
knowledge creatively in novel situations” (Schleicher, 2014).
Changes initiated by the CDE (2013) have resulted in paramount changes
to ensure standards align mathematical content and structure with students’
cognitive development. The changes require that instructors focus on the learner
and continually be aware of the effectiveness of teaching taking place in the
classroom. Instructors must know if their instruction is producing students with
the required mathematical expertise and habits of mind. One way to ensure or
increase effectiveness is to have a good understanding of how students learn
and to use that understanding in preparing learning experiences in the classroom
(Wu, 2006). The findings from this study provided some information that will bring
insight and understanding to educators about how students learn a fundamental
aspect of a concept in a domain of the CCS: the definition of function and its
relation to its representations. “As Confrey (2007) points out, developing
‘sequenced obstacles and challenges for students...absent the insights about
meaning that derive from careful study of learning, would be unfortunate and
unwise’” (Confrey, Maloney, & Corley, 2015).
Limitations of the Study
There are two factors that contributed to the limitations of this study. The
first involved not having a close rapport between the researcher and the
12
the researcher so it is unknown as to whether the students’ responses were
affected by their knowledge that the survey results were for a study and would
not impact their class grades. The second factor involved the researcher’s
missing information over the extent to which the concept of function, its definition,
13
CHAPTER TWO
LITERATURE REVIEW
What Factors Affect Students’ Ability to Relate the Definition of Function to its Representations?
Effective teachers are aware of the value of understanding how students
learn; however, research reveals that students bring a multitude of complex
learning characteristics to the classroom. The better educators understand how
students learn, the better chance they have of meeting the wide range of
students’ learning needs. “An educator must consider the characteristics of the
students at their institution, the mindset of the generation, the variety of learning
styles, and the cognitive development of students” (Hansen, n.d.). Many
educators in mathematics strive to know what factors impact students’ ability to
acquire deep understanding of the function concept and how to use that
knowledge to close the achievement gap between math students who “get it” and
those who “don’t get it.” In response to that need, various studies have been
conducted using a variety of approaches to investigate how students learn the
concept of function, its definition, and its relation to its representations. Some of
the investigations looked for connections between learning and factors such as
nature of a definition, first impressions, the roles and features of a mathematical
definition, procedure versus process, operative versus inoperative definition, and
14
DeMarois, 1996; DeMarois & Tall, 1994; Orit & Shir, 2005; Vinner & Dreyfus,
1989; Tall and Vinner, 1981).
Nature of a Definition
Spoken words do not leave fossils but studying the development of human
vocal chords indicates that human language in one form or another has been
around for over 100,000 years, and written language can be traced back to about
5000 years (Jackendoff, 2006). Currently, there are over six thousand language
schemes in use in the world today although only a minority of these have a
written format (Jackendoff, 2006). Studies show that infants begin to recognize
and learn language before birth, and after birth infants seem to have a
remarkable ability to learn words and appropriate meanings from hearing others
use language (Skwarecki, 2013). Thus, everyday human language is naturally
passed from one generation to the next.
But what is the connection between this language synopsis and students’
ability to relate the definition of function to its representations? One answer is
that acquiring the language of mathematics does not typically occur in the same
way as acquiring everyday language which is naturally learned from hearing
others use the language. Ironically, the notion of “not being” or “not occurring” the
same way, exemplifies a very unique feature of human language—the ability to
express the negation or what is not the case (Jackendoff, 2006). Thus, while the
15
sub-system of language whose essence is not the same as the main system
because it creates usage rather than reports usage, as explained below
(Edwards & Ward, 2008). This difference in the nature of mathematical
definitions is one of the reasons why students struggle with learning concept
definitions. Many studies have been conducted to understand the nature of
mathematical definitions and how it affects learning.
Edwards and Ward (2008) compared the nature of everyday definitions
with the nature of mathematical definitions. They suggested that in general,
students encounter two types of definitions with contrasting natures: extracted
and stipulated (Edwards & Ward, 2008). In everyday life, students generally
acquire extracted definitions which are formed by observed experiences or from
a collection of evidence. Extracted definitions have a truth value; they either
accurately report behavior/experiences or they inaccurately report
behavior/experiences (Edwards & Ward, 2008).
Mathematical definitions, on the other hand, fall into the stipulated
category and it is assumed that these definitions will root and grow on a clean
slate without interference from any previous non-technical or non-contradictory
use (Edwards & Ward, 2008). These stipulated definitions theoretically create a
usage for the learner. They are precisely defined and accepted by the field; thus
they are completely objective in nature and unlike extracted definitions, they have
no optional truth value because they create precise and well-defined usage.
16
there is no variance in how the definition is to be interpreted (Edwards & Ward,
2008). By their nature, stipulated definitions are difficult to trace within the
cognitive structure of students’ minds; therefore, it is difficult to determine the
level to which students learn and internalize stipulated definitions. Sometimes
students are able to precisely state a definition but do not really understand the
meaning of their statements and are not able to utilize them appropriately or
extensively (Edwards & Ward, 2008).
Throughout the day, students continually practice, monitor, and assess
extracted definitions; their nature promotes ease of competent acquisition. On
the other hand, stipulated definitions are typically practiced, monitored, and
assessed within a specific period during teacher-structured experiences. The
nature of mathematical definitions complicates and may hinder acquisition of
competency in utilization of stipulated definitions because, in a sense, they are
imposed upon students. Understanding the nature of mathematical definitions will
provide insight in planning instruction that will increase student achievement.
First Impression
First impressions are rapidly formed and if flawed, are often difficult to
change. New experiences that may contradict the first impression become bound
only to the context in which they were made and the first impression continues to
prevail in other contexts (Wyer, 2010). Similarly, first exposure to the definition of
17
difficult to change. New experiences with unfamiliar representations will likely be
bound only to the context of the new situation and the initial perception will
continue to prevail in other contexts.
Researchers have suggested that students’ initial experience with the
definition of function and relating it to its representation has an impact on the
level of understanding that a student develops over time. In general, it has been
found that minimal initial relation of the definition of function to a variety of its
representations results in lower level understanding of the concept definition and
inability to verify unfamiliar representations of functions (DeMarois, 1996; Tall &
Bakar, 1991; Wyer, 2010; Zaslavsky & Shir, 2005).
Roles and Features of a Mathematical Definition
Learning and understanding mathematical definitions are essential to
learning mathematical concepts; the power of definitions is captured in the roles
and features of the definitions. Features of definitions include two formats:
imperative and optional (Zaslavsky & Shir, 2005).
As previously mentioned, students may be able to memorize a definition
and recite it verbatim, but not understand what the definition means. One way to
gain insight into how well students understand a definition, is to study students’
views and preferences of alternative definitions. Alternative definitions of a
concept are equivalent statements that vary along optional features. Zaslavsky
18
mathematical definitions by having students consider possible alternative
definitions of some math concepts. The following characterizations can be
attributed to a definition:
Four main roles:
1) Introduce the concept and convey its associated properties.
2) Provide fundamental components for concept development.
3) Establish a foundation for problem solving and proofs.
4) Create uniformity in communicating about the concept (Zaslavsky
& Shir, 2005).
Three imperative features:
1) All conditions of the definition must be capable of coexisting.
2) The meaning should be uniquely interpreted.
3) When applicable, the definition should be invariant under change of
representation and based on previously defined concepts in a
non-circular way (Zaslavsky & Shir, 2005).
In general, these characterizations are the commonly accepted roles and
imperative features of a definition, however, optional features are sometimes also
attributed to a definition. Optional features are those features that may be omitted
from a definition without losing the integrity of the definition; on the other hand, if
an imperative feature is omitted, the result is a non-example of a concept
definition. For example, a student may state that a function is a graph that
19
since it does not include all the imperative roles and features commonly
attributed to the function concept definition.
Zaslavsky and Shir (2005) found that during leader-led group discussions
of alternative definitions, students made little or no reference to the imperative
features of a given definition. Students made even less comments about
connections between alternative representations inferred by a given formal
definition and those inferred by alternative definitions. In general, students
acquire limited conceptions and limited understanding of which essentials are
required for mathematical definitions; these limitations are the result of learning
experiences and discussions focused primarily around limited roles and features
of a definition. Students are commonly exposed to only the textbook definition of
a concept and rarely to alternative or non-examples of definitions. This affects
the level of understanding of a concept and definition that a student develops
over time (Zaslavsky & Shir, 2005).
When students create their own definitions from guided learning
experiences, students gain higher level internalization and expertise in a concept.
Zaslavsky and Shir (2005) observed that when students were left on their own to
discuss their views on alternative definitions to a given definition, students gained
higher level understanding and clarification of their own perception as they
needed to generate increased numbers of examples or counterexamples to
support their personal claims. When students are more comfortable with a
20
clarification and comprehension for the user. When students are less familiar with
the concept, they tend to focus on the correctness or necessary and sufficient
conditions specified in the statement, even though they may not understand the
meaning of the terms used in the definition. This supports the view that
“Generating examples [and counterexamples] is an important cognitive activity,
as the ability to generate examples [and counterexamples] as needed is one of
the distinctions between novices and experts…” (Zaslavsky & Shir, 2005).
Procedure versus Process
DeMarois (1996) studied students’ level of understanding of the function
concept by comparing cognitive endeavors that involved mathematical processes
to those that involved mathematical procedures. DeMarois (1996) used Gray and
Tall’s (1994) procept theory to separate students across a proceptual divide
according to their level of understanding of the function concept. In the procept
theory, an amalgam of a process, a concept and a symbol serve as the criteria
for making the separation. According to the theory, when a symbol
(representation) evokes either a process or a concept the student holds a high
level of understanding which allows the student to verify representations of
functions in unfamiliar formats. Higher level understanding allows flexibility in
applying the definition of function in new contexts. On the other hand, when a
symbol (representation) evokes a procedure, the student holds a low level
21
unfamiliar contexts. Lower level understanding relies on a concept image which
evolves from a mishmash of disconnected procedures that have been
memorized with limited understanding about connections between the facets of
the definition. This results in difficulty when thinking about or understanding the
relationships between the concept of function, the definition of function, and its
representations (DeMarois, 1996).
Operative versus Inoperative Definition
Other studies have investigated the relationship between the acquisition of
students’ operative or inoperative definition of function and prototypes. Some
findings indicated that students form habits of mind through frequent exposure to
familiar patterns and they develop prototypes for the function concept similarly to
the way they develop prototypes for everyday concepts (Tall & Bakar, 1991).
When the definition of function is introduced but not emphasized or
re-referenced, students develop an inoperative definition of function and the mind
attempts to solve problems by resonating with mental prototypes (Tall & Bakar,
1991). For example, if a student is asked whether a particular graph represents a
function and the graph produces a mental hit, the student experiences that
sensation and the student responds accordingly. If the student does not have an
operative definition, then the mind attempts to resonate with mental prototypes
that have been collected in the past. Without a hit, the student experiences
22
resonance; the student’s mental search can cause frustration and may result in
an incorrect response or no response at all (Tall & Baker, 1991).
When a student looks at an unfamiliar graph of a function, the student may
mistake it for a graph of a non-function, because his/her previous experiences
with graphs have been that graphs have familiar shapes or are usually described
by a formula. Sometimes, the resonance may evoke inappropriate properties of
prototypes, then the student may give an incorrect response (Tall & Bakar,
1991). For example, a student may think that a constant function is not a function
because previously encountered prototypes depended on variables and variables
vary. A constant function such as y =3 always yields 3 as an output regardless
of the input, so a student may consider that this invariance produces a
non-function; its horizontal linear graph may also be falsely considered a non-function
representation because of its linear, horizontal, or non-varying appearance.
Thus, even positive resonances may result in incorrect responses.
Tall and Bakar (1991) found that students are sometimes provided with
limited experiences to formulate formal depths of logical meaning for the
definition of function. Sometimes, formalities are introduced, but the formalities
are not emphasized consistently or are not related to experiences, activities, or to
work intended to develop depth in learning the concept of function; “…the
collection of activities inadvertently colours the meaning of the function concept
with impressions that are different from the mathematical meaning which, in turn,
23
105). Acquiring an operative definition of function allows students to successfully
relate the definition of function to its representations.
Importance of Function and Function Representations
One might ask why is it important to put effort into understanding students’
ability to relate the definition of function to its representations; after all,
theoretically speaking, the concept of function is a simple idea. What could be
simpler, than pairing exactly one and only one output to every input between
whatever sets one wishes? In reality, research reveals that the concept of
function remains one of the most difficult concepts for students to learn; however,
when mastered, the notion of function, along with its relation to the vast array of
function representations, opens up many opportunities for problem solving and
describing just about any event in the world (Bayazit, 2011).
The concept of function is one of the most basic concepts of mathematics
and one of the most amazing and powerful because of its diversity of
interpretations and representations. With its associated sub-notions, the variety
and range of representations of functions is immense and useful in real life to
understand almost any phenomenon. However, by its very simple nature, the
definition of function is sometimes glided over or perhaps assumed intuitive.
Sajka (2003) discussed this view in her work on students’ understanding of
functions. She suggested that the power of function is due in part to the very
24
arbitrariness property, i.e. a property that allows function relationships to be
arbitrary and the domain and co-domain to be any arbitrary sets. This property
allows function representation of situations that range from simple to highly
sophisticated. Sajka ( 2003) stated, “Function is one of the basic concepts of
mathematics, amazing in the diversity of its interpretations and representations.
Much time and attention have been spent on it in the didactic process, yet it
remains a difficult concept” (p. 231).
Students who develop a thorough understanding of the function concept
and its relation to representations of various and complex formats are better
prepared for life’s challenges and opportunities in today’s rapidly changing world.
Ainsworth (1999), and Amit and Fried (2005), agreed on the importance of
learning about functions and its representations in order to understand and solve
problems in real life. The notion of cause-and-effect is highly related to students’
understanding of function and its representations; the notion of dependent and
independent factors is critical in a multitude of world situations including
economics, politics, science, medicine, peace, and survival.
Amit and Fried (2005) further suggested that there is a correlation
between learning the function concept along with its representations and
developing higher level problem solving skills. Tall and Vinner (1981) had a
similar suggestion from their study on functions in the context of limits and
continuity. The researchers explored debilitations that might arise from the total
25
through the years. Tall and Vinner (1981) found that sometimes subconscious
conflict factors cause a vague sense of uneasiness when solving problems or
doing research and that it may be a considerable time later until the reason for
conflict is consciously understood. For example, a significant finding was that a
weak understanding of the representation of continuous functions led to struggles
with understanding limits in higher level course work (Tall & Vinner, 1981).
DeMarois and Tall (1996) also found that students’ ability to move
comfortably between facets of a definition is imperative for success in higher
level courses where functions may need to be treated as objects (DeMarois &
Tall, 1996). In “Facets and Layers of the Function Concept,” DeMarois and Tall
(1996) found the ability to do so was a higher-order function and they expressed
an appreciation for the links involved in forming connections between multiple
representations of function. Ainsworth (1999) had similar suggestions in a study
where she determined that translation across multiple representations supports
deeper understanding and higher order cognitive processes.
The findings above suggest that struggling with function representations in
Algebra may be detrimental to learning more sophisticated and complex
function-based concepts in mathematics (DeMarois & Tall, 1996; Tall & Vinner, 1981;
26
CHAPTER THREE
METHODOLOGY
The goals of this study were stated in the introduction and are restated here:
1. To study the extent to which students are able to distinguish between
representations of functions and non-functions,
2. To compare students’ ability to distinguish between function and
non-function representations to the students’ familiarity with the
representations,
3. To explore the extent to which students are able to apply the definition
of function to verify representations of functions, and
4. To explore the extent to which students are able to provide a clear and
precise definition of a function.
Sample
The participants in this study were 100 ninth grade Algebra 1 high school
students. The students were all enrolled in regular, college-preparatory Algebra 1
classes with the same teacher during various periods of the day. The teacher
and students volunteered to participate and the students were randomly
selected.
The study was conducted near the end of the school year after STAR
testing. The teacher indicated that participating students had received instruction
27
which include function definition and representations of functions. None of the
students that participated in this study required instructional or curricular
modifications.
The high school that the students attended has a large population with
approximately 80% Hispanic, 10% White, 5% African American, and 5% Asian
students (CDE, 2011). Approximately 75% of the students at the school are
economically disadvantaged (CDE, 2011).
The school’s Academic Performance Index (API) for the year of the study
was over 700 and the CST scores for ninth grade Algebra 1 students were 46%
below and far below basic combined, 27% basic, and 27% proficient and
advanced proficient combined (CDE, 2011). The passing rate for CAHSEE for
tenth graders was 87% (CDE, 2011).
The school is located in an urban area in Southern California.
Approximately 25% of the constituents have some high school education, about
50% have high school diplomas, roughly 18% have associate degrees, and
about 7% have graduate degrees (U.S. Census, 2013).
Terminology
Throughout this study, the following terms will be used:
1. Familiar representations will be used to describe representations that
are likely to be frequently referenced and practiced in learning
28
include linear, quadratic, and continuous graphs. Also included are
equations with x and y variables, mapped sets involving numbers, and
two column tables.
2. Unfamiliar representations are interpreted to mean the type of
representations that are most likely minimally referenced and practiced
in Algebra 1 high school classes. These include representations with
variables different from x and y, such as z, t, and function notation f(x),
and sets with arbitrary elements that are not necessarily numeric.
3. Definition of function is used for the mathematical definition of a
function: an arbitrary relation from a set of possible inputs to a set of
possible outputs where each input is related to exactly one output.
Instrumentation
A function survey was developed by the researcher for this high school
student study. The format of the survey is similar to one designed by Elia and
Spyron (2006) for their research on how students perceive functions and how
students relate the definition of function to its representations. Elia and Spyron
(2006) used their survey to study university students so a main difference
between their survey and the survey for this high school study is in the level of
mathematical sophistication. The researcher for this high school study aligned
the question content with the 2006 Mathematics Framework for California Public
29
The survey designed for this study consisted of 29 questions. The first 26
questions (Q1 – Q26) were to collect data involving students’ ability to relate the
function definition to its representations, and to provide an adequate definition of
function. The last three questions were used to collect student data regarding
previous math courses taken, grades, and general views about mathematics.
Q1 – Q25 in the survey included three tasks. The first task was to decide if
the given representation was that of a function or non-function. Students
responded to this task by circling Yes or No. The second task was to explain how
the answer to the first task was decided. Students wrote their answers to this
question on the survey. The third task was to give the domain and range in case
the representation was that of a function. Students were provided a space on the
survey to write their responses to the third task.
Q1 – Q25 included seven types of familiar and unfamiliar representations.
The types of representations were grouped as follows: graphs, equations,
ordered pairs, tables, statements, arrow diagrams, and arbitrary set mappings.
Each group was designed to provide data on students’ ability to relate a different
type of representation to the function definition and to explore students’ ability to
distinguish between representations of familiar versus unfamiliar representations.
Table 1 shows the seven types of representations, the number of questions of
each type, the question numbers, the assessed task of each question, and an
30 Table 1
Types of Function Representations
Type of Representation (number of questions)
Question Numbers
Assessed task Examples
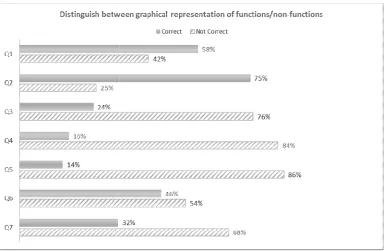
Graph (7)
1 – 7 Distinguish between graphical representation of functions/non-functions
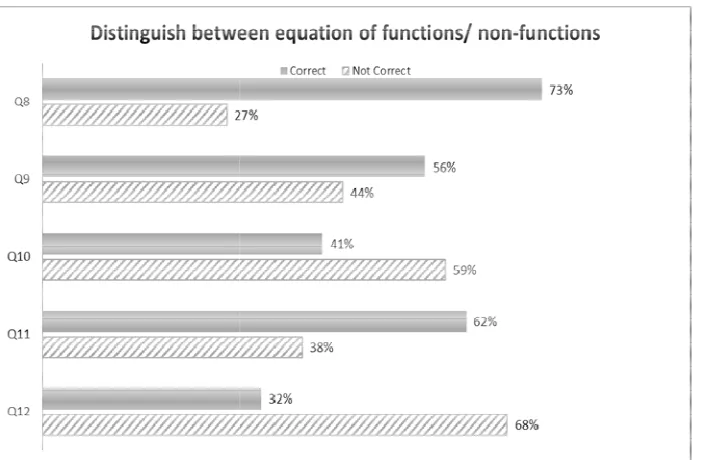
Equations (5)
8 – 12 Distinguish between equation of functions/ non-functions
Ordered Pairs (2)
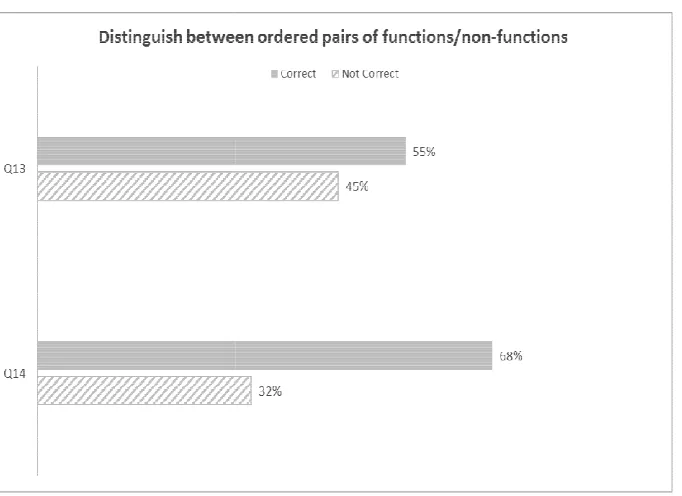
13 – 14 Distinguish between ordered pairs of functions/
non-functions
Tables (2)
15 -16 Distinguish between table values of functions/ non-functions
Statements (3)
17 – 19 Distinguish between statements describing functions/
non-functions
“An input is assigned to three different outputs.”
Arrow Diagrams (3)
20 – 22 Distinguish between arrow diagrams of functions/ non-functions
Arbitrary set mappings (3)
23 – 25 Distinguish between arbitrary set mappings of functions/
non-functions
Definition (1)
26 Provide definition of function
Background Information (3)
27 – 29 Provide prior courses taken, views about math, perceived math grade
{
}
(3, 2), (5, 4), (7, 8),
(8,10), (9, 4)
− =2 −36
31
Variations of representations were included within some types of
representations. The variety within each type consisted of familiar and unfamiliar
representations. A brief description of the variations within each type, and
whether the given representation was of a function or non-function are shown in
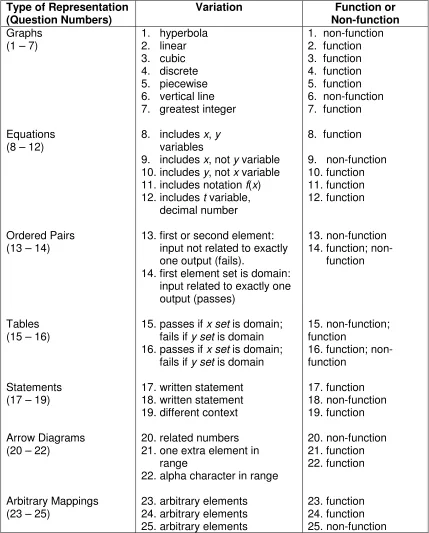
32 Table 2
Variations within Types of Representations
Type of Representation (Question Numbers)
Variation Function or
Non-function
Graphs (1 – 7)
Equations (8 – 12)
Ordered Pairs (13 – 14)
Tables (15 – 16)
Statements (17 – 19)
Arrow Diagrams (20 – 22)
Arbitrary Mappings (23 – 25)
1. hyperbola 2. linear 3. cubic 4. discrete 5. piecewise 6. vertical line 7. greatest integer
8. includes x, y variables
9. includes x, not y variable 10. includes y, not x variable 11. includes notation f(x) 12. includes t variable, decimal number
13. first or second element: input not related to exactly one output (fails).
14. first element set is domain: input related to exactly one output (passes)
15. passes if x set is domain; fails if y set is domain 16. passes if x set is domain; fails if y set is domain
17. written statement 18. written statement 19. different context
20. related numbers 21. one extra element in range
22. alpha character in range
23. arbitrary elements 24. arbitrary elements 25. arbitrary elements
1. non-function 2. function 3. function 4. function 5. function 6. non-function 7. function
8. function
9. non-function 10. function 11. function 12. function
13. non-function 14. function; non- function
15. non-function; function
33
Q26 asked students to respond, using one or two sentences, to the
question, “What is a function?” A list of response descriptors (Appendix B) for
analyzing students’ responses to this question was developed by the researcher.
The list includes some descriptors used by Arnold (1992) for a similar question in
one of his studies on students’ understanding of the function definition.
Q27, Q28, Q29 asked students for information that would allow
exploration of the relationships between students’ knowing the definition of
function and students’ prior course work, views about mathematics, and
perceived grades in Algebra. Data from Q27 – Q28 are left for future exploration.
Data Analysis
Part (a) of Q1 – Q25 asked students if a given representation was that of a
function. The responses for Part (a) of Q1 – Q25 provided data to explore the
extent to which students were able to distinguish between representations of
functions and non-functions and to explore the influence of familiarity on
students’ ability to distinguish between function/non-function representations.
The Yes and No dichotomous responses to Part (a) of the questions were
calculated using 1 for a correct answer, and 0 for an incorrect answer, or no
response. Percent for correct/incorrect Part (a) responses were calculated and
compared as a whole including all twenty-five questions and within each type of
representation (graphs, equations, ordered pairs, tables, statements, arrow
34
order to compare percent correct/incorrect of item variations within each type of
representation.
Within each type of representation, data was compared to determine if
there was a relationship between the familiarity of the representation and
students’ ability to distinguish between function and non-function representations.
The data was used to generate bar graphs showing percent of correct and
incorrect responses. Familiar and unfamiliar representations were compared
based on whether students are likely to encounter them in regular mathematics
textbooks for Algebra 1, lower level math courses, or classroom instruction as
per classroom observations, California Content Standards in Mathematics and
Common Core State Standards in Mathematics.
Part (b) of Q1 – Q25 in the Math Survey asked students to explain how
they determined their response to Part (a). The responses for Part (b) were
scored using a rubric (Appendix A) to examine the extent to which students were
able to apply adequate explanations for distinguishing between function and
non-function representations.
Responses to Parts (a) and (b) were further analyzed to explore the
correlation between a students’ ability to correctly decide whether or not a
representation was that of a function and the students’ ability to relate the
decision to the definition of function.
Part (c) of the Math Survey asked students to provide the domain and
35
correct or incorrect order of mapping provided by the student response. A score
of “1” was assigned for a correct answer and “0” for an incorrect answer or no
response. These scores were examined to add to the data about students’ ability
to provide the correct order of mapping in a function representation.
Winsteps Software (Linacre, 2011), which is based on the Georg Rasch
measurement theory, was used to analyze response data from the first
twenty-five questions on the survey to obtain mean, standard deviation, and item
difficulty for each item. Determining the item difficulty value involves a joint
maximum likelihood process upon a matrix of responses of persons to items; the
item difficulty measures are invariant of other items in the data matrix and of the
persons who responded to the items. The total scores, for items and persons, are
the sufficient statistics for obtaining item difficulty and person ability measures.
The Rasch analysis produces a linear interval scale that measures student ability
and item difficulty on a common scale measured in logit units (log-odds) (Rasch,
160, 1980). The higher the person measure, the higher is the person ability; the
higher the item difficulty measure, the more difficult is the item. The item difficulty
and student ability measures are shown on a common scale in Figure 1, Variable
Map of Yes/No Items.
The reliability coefficient for students’ ability measures was also
calculated. The rate of success demonstrated by students for each question type
and a comparison of differences in proportion right was reported. Finally,
36
quality of the items. The analysis also provided a visual representation of the
37
CHAPTER FOUR
FINDINGS AND RESULTS
Data were obtained from the student responses on the survey. Analysis of
the data provided information about students’ ability to distinguish between
functions and non-function representations, to relate the definition of function to
its representations, and to provide an adequate definition of function.
Three different data analyses were conducted using data from student
responses to the first twenty-five questions. Winsteps Software (Linacre, 2011)
was used for performing the analyses. The Winsteps program is based on the
Georg Rasch measurement theory. The Rasch analysis produces a linear
interval scale that measures student ability and item difficulty on a common scale
measured in logit units (log-odds) (Rasch, 160, 1980).
The first analysis selected data from Part (a) of the questions. Part (a)
asked students to respond with yes or no as to whether a given illustration was
that of a function or not. A correct answer received a score of 1 and an incorrect
or blank answer received a score of 0. The second analysis selected data from
Part (b) of the questions which asked students to explain how they decided the
answer to Part (a). The data selected in Part (b) consisted of student scores
based on the Explanation Rubric (Appendix A). The third analysis selected the
38
Descriptive Statistics of Measured Person and Measured Item for Yes/No Items
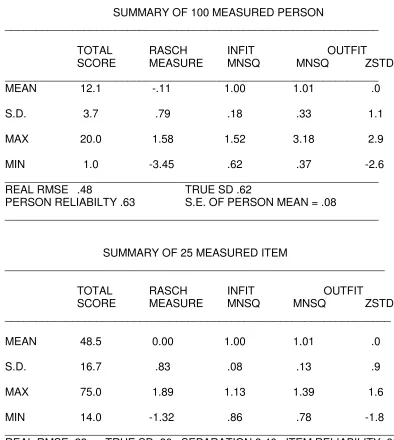
Summary Table 3 shows descriptive statistics for Part (a) of Items, Q1 to
Q25, (Q1a – Q25a). The results shown report for 100 measured person a mean
of -.11 logits and a standard deviation of .79 logits. The reliability measure was
.63 for the students and the students’ measures range from -3.45 logits to 1.58
logits. The student with the lowest measure of -3.45 logits was 1.2 logits lower
than the next two persons whose measures were -2.25 logits. The fourth lowest
student measure was -1.9 logits. Without these four lowest outliers, all the
remaining person measures were located within 2 logits below and 2 logits above
the person mean, with the lowest at 1.9 logits below the mean and the highest at
1.89 logits above the mean.
The mean measure for item difficulty was arbitrarily set at 0 logits and the
39 Table 3
Descriptive Statistics of Yes/No Items
SUMMARY OF 100 MEASURED PERSON
_____________________________________________________________
TOTAL RASCH INFIT OUTFIT
SCORE MEASURE MNSQ MNSQ ZSTD
_____________________________________________________________
MEAN 12.1 -.11 1.00 1.01 .0
S.D. 3.7 .79 .18 .33 1.1
MAX 20.0 1.58 1.52 3.18 2.9
MIN 1.0 -3.45 .62 .37 -2.6
_____________________________________________________________
REAL RMSE .48 TRUE SD .62
PERSON RELIABILTY .63 S.E. OF PERSON MEAN = .08
_____________________________________________________________
SUMMARY OF 25 MEASURED ITEM
______________________________________________________________
TOTAL RASCH INFIT OUTFIT
SCORE MEASURE MNSQ MNSQ ZSTD
_______________________________________________________________
MEAN 48.5 0.00 1.00 1.01 .0
S.D. 16.7 .83 .08 .13 .9
MAX 75.0 1.89 1.13 1.39 1.6
MIN 14.0 -1.32 .86 .78 -1.8
________________________________________________________________ REAL RMSE .23 TRUE SD .80 SEPARATION 3.46 ITEM RELIABILITY .92
MODEL RMSE .23 TRUE SD .80 SEPARATION 3.52 ITEM RELIABILITY .93
S.E. OF ITEM MEAN = .17
40
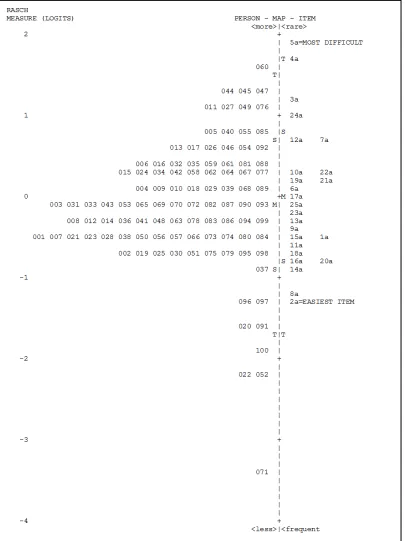
A Variable Map of Q1a – Q25a, was produced and is shown in Figure 1.
The map shows the item and person distributions on the common logit scale. Of
the first twenty-five questions, the easiest ones were Q2a, which asked students
to decide if an illustration was that of a function, and Q8a, which asked student to
decide if y =2x−36 is an equation of a function. Q2a was 1.32 logits below the
mean and Q8 was 1.20 logits below the mean. These two questions were within
.12 logits of each other.
The most difficult items were Q5a, which asked students to decide if a
piecewise graph was that of a function, and Q4a, which asked students to decide
if a discrete graph was that of a function. Q5a was 1.89 logits above the mean
and Q4a was 1.73 logits above the mean. These two items were .16 logits apart
in difficulty.
The variable map shows that Q1a – Q25a, which asked students to decide
if the representation was that of a function, was well targeted to the abilities of
the students, i.e. the mean of item calibration was approximately equal to the
mean of the students’ ability measure. Also, the spread of the items and the
spread of the people along the scale were comparable and there were no large
42
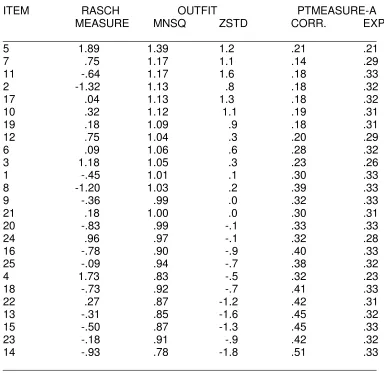
A misfit analysis for Yes/No items, Q1a – Q25a, was conducted and
reported in Table 4. The point measure correlations were positive and closely
matched the expected values. The expected mean squared value is 1 and the
outfit mean squares ranged from .78 to 1.39. The analysis indicated that the
43 Table 4
Item Misfit Order
ITEM STATISTICS: MISFIT ORDER
_____________________________________________________________
ITEM RASCH OUTFIT PTMEASURE-A
MEASURE MNSQ ZSTD CORR. EXP
_____________________________________________________________
5 1.89 1.39 1.2 .21 .21
7 .75 1.17 1.1 .14 .29
11 -.64 1.17 1.6 .18 .33
2 -1.32 1.13 .8 .18 .32
17 .04 1.13 1.3 .18 .32
10 .32 1.12 1.1 .19 .31
19 .18 1.09 .9 .18 .31
12 .75 1.04 .3 .20 .29
6 .09 1.06 .6 .28 .32
3 1.18 1.05 .3 .23 .26
1 -.45 1.01 .1 .30 .33
8 -1.20 1.03 .2 .39 .33
9 -.36 .99 .0 .32 .33
21 .18 1.00 .0 .30 .31
20 -.83 .99 -.1 .33 .33
24 .96 .97 -.1 .32 .28
16 -.78 .90 -.9 .40 .33
25 -.09 .94 -.7 .38 .32
4 1.73 .83 -.5 .32 .23
18 -.73 .92 -.7 .41 .33
22 .27 .87 -1.2 .42 .31
13 -.31 .85 -1.6 .45 .32
15 -.50 .87 -1.3 .45 .33
23 -.18 .91 -.9 .42 .32
14 -.93 .78 -1.8 .51 .33
44
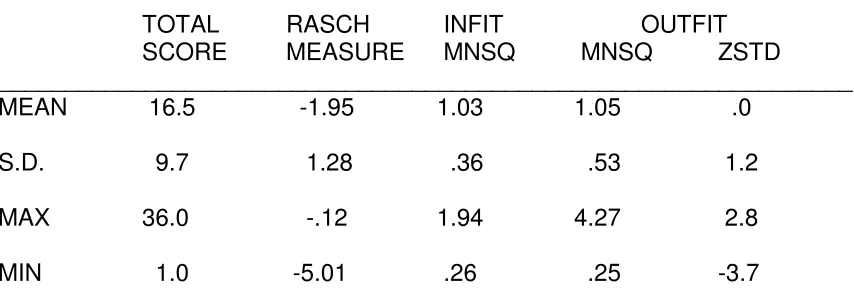
Descriptive Statistics of Measured Person and Measured Item for Explanation Items
Summary Table 5 shows descriptive statistics for student explanations,
Part (b), of Items 1 to 25 (Q1b – Q25b). The results shown report for 100
measured person a mean of -1.95 logits and a standard deviation of 1.28 logits.
The reliability measure was .87 for the students and the students’ measures
ranged from -5.01 logits to -.12 logits. The mean measure for item difficulty was
arbitrarily set at 0 logits and the item difficulties ranged from -1.46 to 2.79 with a
45 Table 5
Descriptive Statistics of Explanations
SUMMARY OF 100 MEASURED PERSON
________________________________________________________________
TOTAL RASCH INFIT OUTFIT
SCORE MEASURE MNSQ MNSQ ZSTD
________________________________________________________________
MEAN 16.5 -1.95 1.03 1.05 .0
S.D. 9.7 1.28 .36 .53 1.2
MAX 36.0 -.12 1.94 4.27 2.8
MIN 1.0 -5.01 .26 .25 -3.7
________________________________________________________________ REAL RMSE .46 TRUE SD 1.19 SEPARATION 2.59 ITEM RELIABILITY .87 MODEL RMSE .49 TRUE SD 1.20 SEPARATION 2.79 ITEM RELIABILITY .89 S.E. OF ITEM MEAN = .13
________________________________________________________________
SUMMARY OF 25 MEASURED ITEM
________________________________________________________________
TOTAL RASCH INFIT OUTFIT
SCORE MEASURE MNSQQ MNSQ ZSTD
________________________________________________________________
MEAN 62.1 0.00 .98 1.05 .1
S.D. 26.9 .99 .32 .41 1.6
MAX 119.0 2.79 1.83 2.22 4.0
MIN 6.0 -1.46 .45 .54 -2.5
________________________________________________________________ REAL RMSE .21 TRUE SD .97 SEPARATION 4.67 ITEM RELIABILITY .96 MODEL RMSE .20 TRUE SD .97 SEPARATION 4.91 ITEM RELIABILITY .96 S.E. OF ITEM MEAN = .20
46
A Variable Map for Explanations, for Part (b) of Items Q1 – Q25 (Q1b –
Q25b), was produced and is shown in Figure 2. The figure displays the item and
person distributions on the common logit scale. The most difficult items for Part
(b) were Q7b, which asked students to explain how they decided if a step graph
was that of a function, and Q3b, which asked students to explain how they
decided if a polynomial graph was that of a function. Q7b was approximately 2.75
logits above the item mean, and Q3b was about 2.5 logits above the item mean.
The item with the least difficulty measure is Q15b, which asked students
to explain how they decided if a table of x, y values represented a function. This
item had the least difficulty measure, and is located 1.5 logits above the students’
ability mean.
The highest person ability measures is located at -.12 logits below the
item difficulty mean. The variable map measures support that the written
explanations requested in Part (b) of the survey items were not well targeted to
the abilities of the students; all of the item difficulty measures are located above