International Journal of Health Sciences and Research
www.ijhsr.org ISSN: 2249-9571
Original Research Article
Patients’ Expectations - A Study in a Selected
Hospital
Dr Sweta Dcunha,Dr Sucharitha Suresh
Professor, Dept of Hospital Administration, Father Muller Medical College, Kankanady Mangalore 575002 Corresponding Author:Dr Sweta Dcunha
ABSTRACT
With the healthcare market turning into a buyer’s market, healthcare providers are turning more and more towards marketing of their services. This requires a marketing information system which provides information that is accurate, timely and need-based to hospital administrators. For this a relevant tool for hospital administrators today is a patient expectation survey which reveals what patients actually desire from hospital. When the results of such patient expectation surveys are applied to planning of healthcare services, it increases the chances of achieving patient satisfaction. The objectives were to study the actual performance and patient expectations and then analyse the gap between the two. The patients’ expectations were met at most of the counters they visited as an outpatient since the gap analysed at many instances between actual performance and patient expectation was negligible. In some areas no gap was observed between the actual performance and patient expectations, like in, the behaviour of the doctor and the supporting staff, promptness in service at the billing and pharmacy counters respectively, and availability of the drugs at the pharmacy. This means that the actual performance exceeded the patients’ expectations thus causing them to be highly delighted with these hospital services.
Key words: patient expectation, satisfaction, hospital services, hospital administrators.
INTRODUCTION
The healthcare industry is becoming more focused on the consumer. In an era when consumers can shop around for the best value, it is a must for healthcare organizations to build and maintain patient loyalty by providing not only quality care
but also surpassing patient
expectations. Patient experience is an increasing influential factor in determining healthcare providers' financial success. [1] A detailed understanding of patient expectations is essential to enable the provision of patient-centered care, to meet the needs of patients and to manage inappropriate expectations if necessary. [2]
Patient expectation is valuable both as a marketing tool and as an intrinsically valued goal. In 2000, the World Health Organization identified responsiveness to
patient expectations as a key measure of health system performance to achieve better health outcomes since satisfied patients are more likely to utilize needed services. [3]
customer expectations and perceptions over time, is critical to the delivery of service quality and should be the starting point for any analysis of service improvement. [4]
Marketing research is equally relevant for hospital administrators as timely, accurate and adequate information is a pre-requisite for making marketing decisions regarding delivery of hospital services. One of the Market Research Tools helpful in addressing this issue is a Patient Expectation Survey (PES). This could be an initial marketing activity of an upcoming hospital or could also be an ongoing process in response to a certain problem being faced by the hospital. A patient expectation survey may also be included in the hospital’s Customer Relationship Management (CRM) activities. [5]
If patients are viewed as consumers, a consumer model such as Expectancy-Disconfirmation Model from marketing theories can be applied to healthcare provision. The assumption is that patients have expectations when they visit a hospital. These expectations arise from prior
experience or word-of-mouth
communication, third party information or cultural milieu. [6] Thompson and colleagues [7]
reported that the degree to which these expectations are fulfilled can be measured and there is a relationship. The higher the perceived fulfillment of expectation, higher is the satisfaction. When fulfillment is lower than expectation, the lesser is the satisfaction. When expectations are low, they are easily fulfilled and satisfaction is kept high and vice versa.
Though patient expectations are often based on personal experiences and word-of-mouth from friends or relatives, patients increasingly form expectations gathered through the mass media. With so much information and misinformation circulating, it’s essential that providers be involved in shaping patient expectations. This can best be done through effective provider-patient communication. [8]
The patients want their physicians to like them. Since there is a tendency for
patients to think that physicians will do more for those they care about, patients generally equate a provider’s liking them and being interested in them as individuals with better care overall. The idea is that physicians who like their patients will bring their best efforts to bear on their behalf. Despite being a core wish, patients rarely admit this.
Bryan and colleagues, [9] and Smith and associate [10] have speculated that patient expectation of care they receive has an important impact on satisfaction. Patients with inappropriately high expectations maybe dissatisfied with optimal care and those with inappropriately low expectations maybe satisfied with deficit care. In their study, Mckinley et al, [11] found that comparative/normative expectations (what patients expect as a result of their own or others experiences) could well influence satisfaction levels.
There has been considerable debate over the relationship between patient expectations, satisfaction and patient experience of care. Patients may report a high level of satisfaction despite unmet expectations, and the importance of the postulated link between expectations and patient satisfaction has been questioned; however, there is evidence that patient expectations exist and that they influence how patients perceive their care. [12]
reported expectations on the Patient Intentions Questionnaire were for ‘getting information’ and ‘understanding and explanation’ of the patients’ health problem items and the least mentioned were for emotional support items. Patients with more expectations met were found to have significantly higher scores on the satisfaction index. Satisfaction with the consultation was best predicted by meeting the patient’s expectations for understanding and explanation and for emotional support.
According to Oliver [17] patient (customer) expectation have a bearing on patient satisfaction as shown by the disconfirmation paradigm. He says that measurement of patient satisfaction is done after the main event of patient- physician interaction has taken place. It allows change/modification of situation/service delivery afterwards. It is contended that patient expectation survey is a beneficial tool for hospitals to determine the expectation of their patients’ expectations in advance and plan services in such a way that it increases the chances of patient satisfaction
Researchers have identified different models and measures to assess expectations. Spear’s focus groups [18]
listed the following as important in the development of the expectations questionnaire: access to help, being treated with respect, reliable care, responsiveness, being understood and participating in decision-making. It included items on convenience of the service, getting the help that was wanted, ease of getting help, being treated by staff with courtesy and respect, reliability of staff, speed with which services responded, waiting time, empathy of staff, whether they were listened to and kept informed, whether they were involved in treatment decisions and overall expectations. Spahr et. al. [19] reported that the main expectations listed as important by parents (of children in an A&E hospital department) were to receive understandable explanations, to have possible causes of problems explained and to have a say in their care.
Dawn et al. [20] reviewed literature on patients’ expectations between 1966 and 2002 and reported that the most commonly addressed areas of expectations were medical information, medication/ prescriptions, counselling/psychological support, diagnostic testing, referral, physical examination, health advice, outcome of treatment, therapeutic listening and waiting time. Further interviews with a small sample of 48 parents of child ophthalmology patients identified 35 different expectations, classified into six categories: communication, interpersonal manner, doctor’s skill, examination and testing, logistics and various other themes. The factors most often identified as the most important by respondents were clinical competence, interaction, education/training, explanation in clear language, information about diagnosis and a personal connection Objective of the study:
To assess patient expectations and the actual performance (perception) of various out-patient services of the hospital and to analyse the gap so that necessary measures may be taken to improve patient satisfaction.
METHODOLOGY
selected hospital regarding services provided at each of the various counters the outpatient visits from enquiry desk, registration, the respective clinical departments, laboratory/radio diagnostic services, billing and finally to the pharmacy department above counters were included. Lastly, questions that elicited the patient’s expectations with respect to different attributes of services were explored. The collected data was tabulated and analysed by frequency and percentage. Comparison between performance and expectation was done using Wilcoxon signed rank test. Data
analysis was carried out in SPSS soft ware version 23.
RESULTS AND DISCUSSION
The results of the study include the findings of a survey regarding the patient expectations and the actual performance (perception) of hospital services at various counters of the selected hospital. The various counters the outpatient visits were included such as enquiry desk, registration, the respective Clinical departments, laboratory/radio diagnostic services, billing and finally to the pharmacy.
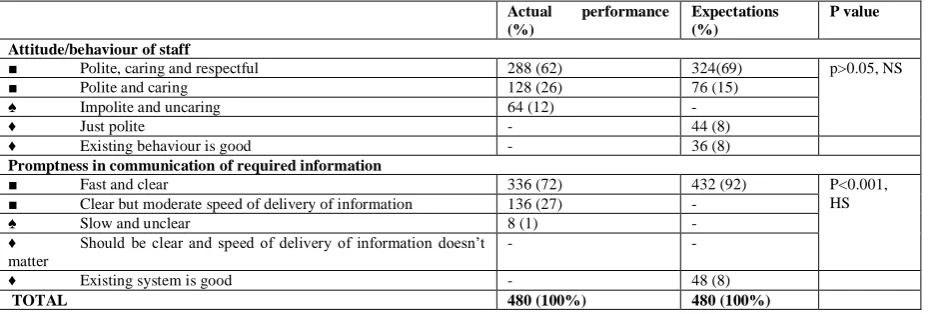
Table 1: Expectation and perception - Enquiry/ Help Desk
Actual performance
(%)
Expectations (%)
P value
Attitude/behaviour of staff
■ Polite, caring and respectful 288 (62) 324(69) p>0.05, NS ■ Polite and caring 128 (26) 76 (15)
♠ Impolite and uncaring 64 (12) -
♦ Just polite - 44 (8)
♦ Existing behaviour is good - 36 (8) Promptness in communication of required information
■ Fast and clear 336 (72) 432 (92) P<0.001, HS ■ Clear but moderate speed of delivery of information 136 (27) -
♠ Slow and unclear 8 (1) -
♦ Should be clear and speed of delivery of information doesn’t matter
- -
♦ Existing system is good - 48 (8)
TOTAL 480 (100%) 480 (100%)
Majority of the patients (62%) were of the opinion that the staffs were polite, caring and respectful. Most of the patients (69%) expect the attitude/behaviour of the staff to be polite, caring and respectful. It is noted that there is a gap of 7% (which is statistically not significant as p>0.05) between the actual performance and patient expectations. Since the gap is negligible, it implies that the expectations of the patients have been completely met thus resulting in the patients being highly satisfied.
72% of the revisit outpatients reported that the promptness in communication at the enquiry desk was fast and clear; 92% of the revisit outpatients expected the delivery of the required information at the enquiry desk to be fast and clear. It is noted that a gap of 20% (which is highly significant as p<0.001) exists between the actual performance and patient expectations. A minor gap exists
implying that the hospital must train and encourage the staff at the enquiry/help desk to improve their promptness in communication of the required information
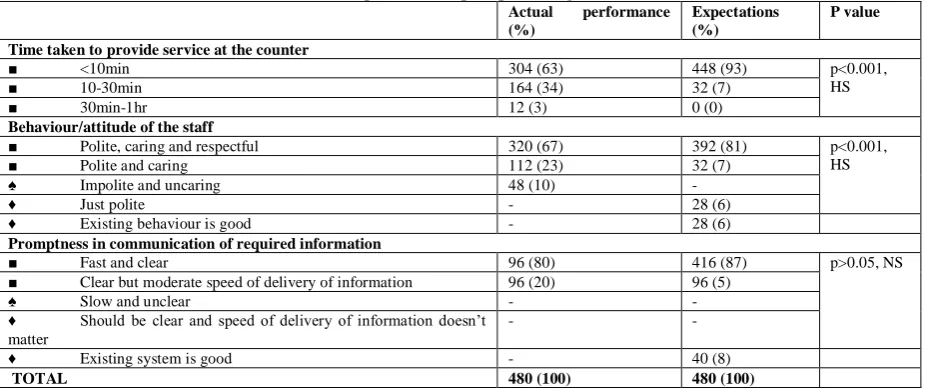
Majority (63%) reported that the time taken to provide service at the registration counter is less than 10 minutes whereas most of the patients (93%) expect the time to be taken at the registration counter to be less than 10 minutes. It is noted that the gap between actual performance and expectation is 30% (which is highly significant as p<0.001). The scope of dissatisfaction is higher when the performance is low or the gap between performance and expectation is high. The hospital must introduce methods to decrease the waiting time at this counter and thus improve patient satisfaction.
polite, caring and respectful. Majority of the patients (81%) expect the staff to be polite, caring and respectful. The gap is 14% (which is highly significant as p<0.001) which indicates expectation is not completely but almost met.
Majority of the patients (80%) felt that the information is communicated fast
and clear at this counter. A large number of patients (87%) are of the opinion that information must be communicated fast and clear. The gap that exists is 7%, (which is statistically not significant as p>0.05) which is negligible implying that patients’ expectations have been met.
Table 2: Expectation and perception - Registration
Actual performance
(%)
Expectations (%)
P value
Time taken to provide service at the counter
■ <10min 304 (63) 448 (93) p<0.001,
HS
■ 10-30min 164 (34) 32 (7)
■ 30min-1hr 12 (3) 0 (0)
Behaviour/attitude of the staff
■ Polite, caring and respectful 320 (67) 392 (81) p<0.001, HS ■ Polite and caring 112 (23) 32 (7)
♠ Impolite and uncaring 48 (10) -
♦ Just polite - 28 (6)
♦ Existing behaviour is good - 28 (6) Promptness in communication of required information
■ Fast and clear 96 (80) 416 (87) p>0.05, NS ■ Clear but moderate speed of delivery of information 96 (20) 96 (5)
♠ Slow and unclear - -
♦ Should be clear and speed of delivery of information doesn’t matter
- -
♦ Existing system is good - 40 (8)
TOTAL 480 (100) 480 (100)
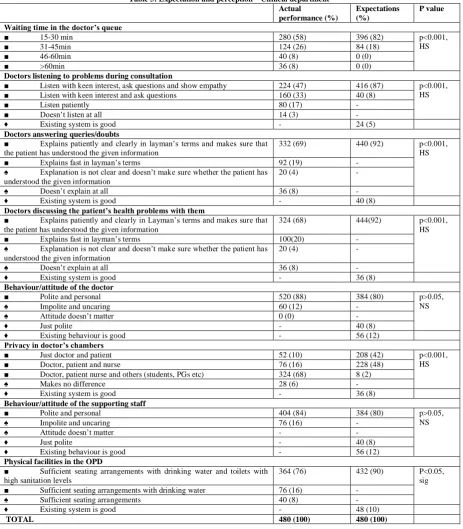
Half of the revisit patients (58%) are of the opinion that the waiting time is between 15-30 minutes Majority of them (82%) expect the waiting time to be between 15-30 minutes. A minor gap of 24% (which is highly significant as p<0.001) exists. This gap implies that the hospital needs to augment its services and streamline the number of patients seen per doctor, so as to decrease waiting time and improve patient satisfaction. The long waiting time at the OPD can be justified since each doctor has to give attention to the patient based on his/her case, thus sometimes the waiting time for the remaining patients look too long. Hence, this is the case based effect. It may be difficult to achieve the expected waiting time during rush hours in the selected hospital as patient inflow to the hospital is high.
47% of the patients opined that the doctors listen to their problems with keen interest, ask questions and show empathy whereas 33% reported that the doctors listen
to their problems with keen interest, ask questions during consultation which when combining is 80%. A large majority of the patients (87%) expected the doctors to listen to their problems with keen interest, ask questions and show empathy. Hence the gap 15% (which is highly significant as p<0.001) between the performance and expectation is a minor one. This implies that the patient’s expectations regarding doctor listening is not completely but almost met.
Significant numbers of patients (68%) reported that the doctors discuss their health problems with them. Majority of the patients (92%) expected the doctors to discuss their health problems with them patiently and clearly in layman’s terms and make sure that they understand it. The gap noted between performance and expectation is 24% (which is highly significant as
p<0.001). This implies that, there is a need to sensitize doctors about this aspect for achieving a higher level of satisfaction. Most of the patients (88%) opined that the behaviour of the doctors was polite and personal and majority of them (80%) expected the doctors to be the same. No gap was observed since the performance exceeded the patients’ expectations.
Table 3: Expectation and perception – Clinical department Actual
performance (%)
Expectations (%)
P value
Waiting time in the doctor’s queue
■ 15-30 min 280 (58) 396 (82) p<0.001,
HS
■ 31-45min 124 (26) 84 (18)
■ 46-60min 40 (8) 0 (0)
■ >60min 36 (8) 0 (0)
Doctors listening to problems during consultation
■ Listen with keen interest, ask questions and show empathy 224 (47) 416 (87) p<0.001, HS ■ Listen with keen interest and ask questions 160 (33) 40 (8)
■ Listen patiently 80 (17) -
■ Doesn’t listen at all 14 (3) -
♦ Existing system is good - 24 (5)
Doctors answering queries/doubts
■ Explains patiently and clearly in layman’s terms and makes sure that the patient has understood the given information
332 (69) 440 (92) p<0.001, HS ■ Explains fast in layman’s terms 92 (19) -
♠ Explanation is not clear and doesn’t make sure whether the patient has understood the given information
20 (4) -
♠ Doesn’t explain at all 36 (8) -
♦ Existing system is good - 40 (8)
Doctors discussing the patient’s health problems with them
■ Explains patiently and clearly in Layman’s terms and makes sure that the patient has understood the given information
324 (68) 444(92) p<0.001, HS ■ Explains fast in layman’s terms 100(20) -
♠ Explanation is not clear and doesn’t make sure whether the patient has understood the given information
20 (4) -
♠ Doesn’t explain at all 36 (8) -
♦ Existing system is good - 36 (8)
Behaviour/attitude of the doctor
■ Polite and personal 520 (88) 384 (80) p>0.05, NS
♠ Impolite and uncaring 60 (12) -
♠ Attitude doesn’t matter 0 (0) -
♦ Just polite - 40 (8)
♦ Existing behaviour is good - 56 (12) Privacy in doctor’s chambers
■ Just doctor and patient 52 (10) 208 (42) p<0.001, HS ■ Doctor, patient and nurse 76 (16) 228 (48)
■ Doctor, patient nurse and others (students, PGs etc) 324 (68) 8 (2)
♠ Makes no difference 28 (6) -
♦ Existing system is good - 36 (8)
Behaviour/attitude of the supporting staff
■ Polite and personal 404 (84) 384 (80) p>0.05, NS
♠ Impolite and uncaring 76 (16) -
♠ Attitude doesn’t matter - -
♦ Just polite - 40 (8)
♦ Existing behaviour is good - 56 (12) Physical facilities in the OPD
■ Sufficient seating arrangements with drinking water and toilets with high sanitation levels
364 (76) 432 (90) P<0.05, sig ■ Sufficient seating arrangements with drinking water 76 (16) -
♠ Sufficient seating arrangements 40 (8) -
♦ Existing system is good - 48 (10)
More than half of the patients (68%) opine that the doctor’s chambers consist of the doctor, patient, nurse and others (students, PGs etc), 16% say that the chambers consist of just the doctor patient and the nurse. 48% of the patients expect that the doctor’s chambers must consist of only the doctor, patient and nurse. The gap here is 32% (which is highly significant as p<0.001). Though the gap is large, it is understandable since this institution is a teaching hospital and students/PGs are required to be present in the doctor’s chambers during the patient’s physical examination so that they get more exposure to different cases and gain knowledge. Hence this factor needs to be looked into as a teaching and training factor.
A majority of the patients (84%) are of the opinion that the behaviour of the
supporting staff at the OPD is polite and personal and a large number of the patients (80%) expect them to behave in the same manner. No gap was observed between performance and expectation.
Majority of the patients (76%) opine that the there is sufficient seating arrangements with drinking water and toilets with high sanitation facilities at the OPD & 90% of the patients expect physical facilities must be available at the OPD. The gap noticed here is 14% (which is significant as p<0.05). This implies that nowadays the public is highly discerning and they expect hospitals to provide clean and hygienic environment with adequate civic amenities. The hospital needs to take regular measure to upgrade facilities and match the patient’s expectations
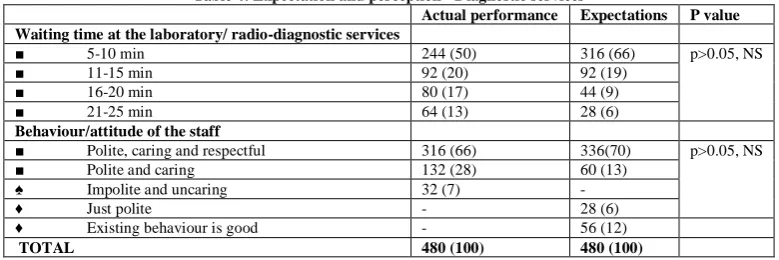
Table 4: Expectation and perception - Diagnostic services
Actual performance Expectations P value Waiting time at the laboratory/ radio-diagnostic services
■ 5-10 min 244 (50) 316 (66) p>0.05, NS
■ 11-15 min 92 (20) 92 (19)
■ 16-20 min 80 (17) 44 (9)
■ 21-25 min 64 (13) 28 (6)
Behaviour/attitude of the staff
■ Polite, caring and respectful 316 (66) 336(70) p>0.05, NS ■ Polite and caring 132 (28) 60 (13)
♠ Impolite and uncaring 32 (7) -
♦ Just polite - 28 (6)
♦ Existing behaviour is good - 56 (12)
TOTAL 480 (100) 480 (100)
50% of the total patient respondents felt the waiting time to be 5-10minutes. Half of the total patient respondents (66%) expect it to be between 5-10minutes at these departments.. The gap here between performance and expectation is 16% (which is statistically not significant as p>0.05). It is noted that the gap is minor, thus implying that the patients’ expectation have not been completely, but have been almost met, thus leading to patient satisfaction.
66% of the patients opined that the behaviour of the staff at the laboratory/radio diagnostic departments is polite, caring and respectful whereas 70% of the patients expect the behaviour of the staff to be the same. A gap of 4% (which is statistically
not significant as p>0.05) is noted, which is negligible.
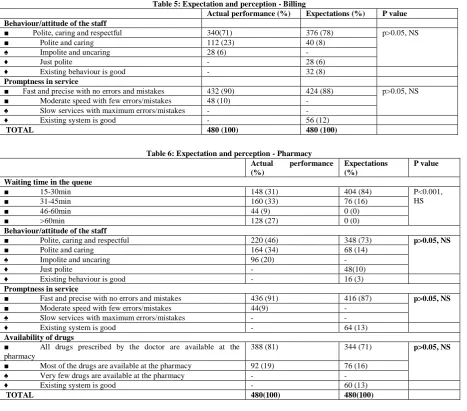
Most of them (71%) opined that the behaviour of the staff at the billing counter was polite, caring and respectful whereas 78% of the patients expect the same. A gap of 7% (which is statistically not significant as p>0.05) noted between actual performance and expectation, is negligible
Table 5: Expectation and perception - Billing
Actual performance (%) Expectations (%) P value Behaviour/attitude of the staff
■ Polite, caring and respectful 340(71) 376 (78) p>0.05, NS ■ Polite and caring 112 (23) 40 (8)
♠ Impolite and uncaring 28 (6) -
♦ Just polite - 28 (6)
♦ Existing behaviour is good - 32 (8) Promptness in service
■ Fast and precise with no errors and mistakes 432 (90) 424 (88) p>0.05, NS ■ Moderate speed with few errors/mistakes 48 (10) -
♠ Slow services with maximum errors/mistakes - - ♦ Existing system is good - 56 (12)
TOTAL 480 (100) 480 (100)
Table 6: Expectation and perception - Pharmacy
Actual performance
(%)
Expectations (%)
P value
Waiting time in the queue
■ 15-30min 148 (31) 404 (84) P<0.001,
HS
■ 31-45min 160 (33) 76 (16)
■ 46-60min 44 (9) 0 (0)
■ >60min 128 (27) 0 (0)
Behaviour/attitude of the staff
■ Polite, caring and respectful 220 (46) 348 (73) p>0.05, NS ■ Polite and caring 164 (34) 68 (14)
♠ Impolite and uncaring 96 (20) -
♦ Just polite - 48(10)
♦ Existing behaviour is good - 16 (3) Promptness in service
■ Fast and precise with no errors and mistakes 436 (91) 416 (87) p>0.05, NS ■ Moderate speed with few errors/mistakes 44(9) -
♠ Slow services with maximum errors/mistakes - - ♦ Existing system is good - 64 (13) Availability of drugs
■ All drugs prescribed by the doctor are available at the pharmacy
388 (81) 344 (71) p>0.05, NS
■ Most of the drugs are available at the pharmacy 92 (19) 76 (16) ♠ Very few drugs are available at the pharmacy - - ♦ Existing system is good - 60 (13)
TOTAL 480(100) 480(100)
33% of the respondents opined that the waiting time was between 31-45minutes, 31% felt 15-30 minutes, 27% reported that it was greater than 60 minutes and few patients (9%) said that it was between 46-60 minutes. Most i.e., 84% expected waiting time (i.e., time taken for the patient’s token number to be called out) to be between 15-30 minutes. A very large gap of 53% (which is highly significant as p<0.001) is observed. This factor poses as potential dissatisfaction causing factor. The hospital must implement methods to decrease the waiting time in the queue at the pharmacy.
Less than half of the total respondents (46%) felt that the staff at the pharmacy counter was polite, caring and respectful whereas large number (73%) expected it. A large gap of 27% (which is statistically not significant as p>0.05) was
noted between actual performance and expectation. This large gap implies that the patients’ expectations have not been met. The staff must be sensitized towards the patients’ expectations which will help improve the situation.
the drugs to be available at the pharmacy. The performance exceeded the expectations by 10% (which is statistically not significant as p>0.05) resulting in increased satisfaction among the patients.
CONCLUSION
Patient expectation survey is considered as a pro-active marketing activity designed to have a better chance at achieving patient satisfaction. This survey will provide an evidence base and lead to rational use of scarce resources. It would also be beneficial to use a patient expectation survey to plan outpatient services and sensitise physicians about expectations of patients to ensure a higher chance of patient satisfaction. Such an approach has also been found to be a cost-effective method for reaching large markets. This would also be a desirable step in marketing the hospital as a responsive organization.
The study done to assess the patient expectations and the actual performance of the hospital, among the revisit patients in the OPD in a selected hospital; revealed that the gaps between the actual performance and the patient expectation. These are areas which require attention from the hospital administration to plan effective strategies to improve patient satisfaction.
Limitations
The study did not classify the patients according to the clinical department they were visiting and compare their expectations separately. This can be considered in future studies as understanding the expectations of patients in the individual department can help in understanding gaps and planning suitable strategies for satisfaction of those patients.
REFERENCES
1. Burger Jeff. Why Hospitals Must Surpass Patient Expectations. Business journal. May 1, 2014
2. Cooke Timothy, Denise Watt, MD; William Wertzler, Hude Quan. Patient expectations of emergency department care:phase II – a cross-sectional survey. Can J Emerg Med 2006;8(3):148-57
3. Lin HC, Xirasagar S, Laditka JN. Patient perception of service quality in group versus solo practise clinics. International Journal for Quality in Health Care 2004;16(6):437-45
4. Silvestro R. Applying gap analysis in the health service to inform the service improvement agenda. International Journal of Quality and Reliability Management 2005;22(3):215-233
5. Bedi S, Arya S, Sarma RK. Patient Expectation Survey- A Relevant Marketing Tool for Hospitals. Journal of the Academy of Hospital Administration 2004;6(1):9-15
6. Baron EO, Dushonal M, Friedman N.
Evaluation of the consumer model:
relationship between patients’ expectations, perceptions and satisfaction with care. International Journal for Quality in Healthcare 2001;13(4):317-323.
7. Thompson DA, Yarnold PR. Relating
patient satisfaction to waiting time
perceptions and expectations: The
disconfirmation paradigm. Academic
Emergency Medicine 1995;2(12):1057-62 8. Desmond J. Managing patient expectations.
The Healthcare Collaborator 2003;3(1):9-16.
9. Bryan-Brown CW, Dracup K. Outcomes, Endpoints and Expectations. American Journal of Critical Care 1996;5(2):87-9. 10. Smith R, Shockley G. The gap between
expectations and reality. British Medical Journal 2000;320(7246)
11. Mckinley RK, Stevenson K, Adams S,
Manku-Scott TK. Meeting patient
expectations of care: the major determinant of satisfaction with out-of-hours primary medical care? Family Practise: Oxford University Press 2002;19(4):333-38
12. Cooke Timothy, Denise Watt, MD; William Wertzler, Hude Quan. Patient expectations of emergency department care:phase II – a cross-sectional survey. Can J Emerg Med 2006;8(3):148-57
13. Grady ML, Makulowich G. Physician
understanding of patient expectations is critical to patient satisfaction. Agency for Healthcare Research and Quality: Research Activities 2001;252:9.
15. Like R, Zyzanski SJ. Patient Satisfaction
with Clinical Encounters: Social
Psychological Determinants. Social Science and Medicine 1987;24:351-57.
16. Zebiene E, Razgauskas E, Basys V, Baubinienen A, Gurevicius R, Padaiga Z et al. Meeting patient’s expectations in primary care consultations in Lithuania. International Journal for Quality in Healthcare 2004;16(1):83-9
17. Oliver RL. A cognitive model of the
antecedents and consequences of
satisfaction decisions. Journal of Marketing Research. 1980;17(4): 460-69
18. Spear J. A new measure of consumer expectations, perceptions and satisfaction
for patients and carers of older people with
mental health problems. Australas
Psychiatry 2003;11:330–3
19. Spahr CD, Flugstad NA. Brousseau DC. The impact of a brief expectation survey on parental satisfaction in the pediatric emergency department. Acad Emerg Med 2006;13:1280–7.
20. Dawn AG, Freedman SF, Lee PP, Enyedi LB. Parents’ expectations regarding their children’s eye care: interview results. Am J Ophthalmol 2003;136:797–804.
21. Krejcie RV, Morgan DW. Determining sample size for research activities.
Educational and psychological
measurement. 1970 Sep;30(3):607-10.
***********