An Approach to Business Process Simulation using
Mined Probabilistic Models
Titas Savickas and Olegas Vasilecas
Information Systems Research Laboratory, Vilnius Gediminas Technical University,
10223 Vilnius, Lithuania
{titas.savickas, olegas.vasilecas}@vgtu.lt
Abstract. There are many approaches on how to analyse business processes, but the simulation is still not widely employed due to high costs associated with simulation model creation. In this paper, an approach on how to automatically generate dynamic business process simulation model is presented. The approach discovers belief network of the process from an event log and uses it to generate a simulation model automatically. Such model then can be further customised to facilitate analysis. For evaluation of the approach, conformance of the simulation results with the source event logs was calculated. The simulation results were event logs that were generated during the simulation of the discovered models. The evaluation showed that the approach could be used for initial simulation model generation.
Keywords: Probabilistic business process model, Business process simulation, Simulation model generation, Process mining.
1.
Introduction
Business processes (BP) are at the core of any enterprise, and the competitiveness requires continuous improvement of those processes. The topic of their improvement is covered by business process management field [1]. One of the most common ways to analyse business processes is to use modelling and simulation. However, simulation is a time-consuming task and requires a lot of manual labour [2]. BP models have to be prepared, and behavioural data has to be collected for a successful simulation. There is a need to automate simulation model creation and reduce the human labour required to improve business agility. Such improvement could be achieved using the data generated by the processes to automate the model creation. The data originating in information systems (IS) are used in BP execution and/or is generated during BP execution. Ability to utilise this data allows organisations to automate analysis tasks and improve analysis quality[3].
how to automatically generate BP simulation models from event logs.
For the above reasons, this paper tackles the problem of automated discovery of simulation models from historical BP execution data and presents an approach on how to automatically create an initial simulation model from an event log. Such a model could provide a framework for the analysis of a BP and reduce the analyst work required. Moreover, it would allow analysts to focus only on the process area that is of interest to the company. The approach takes an event log, discovers probabilistic model and transforms it into a simulation model. The generated simulation model re-uses probabilistic model to predict the execution sequence of the process and generate the process data. The model can further be customised by an analyst to restrict pathways, manipulate process execution, add additional execution rules and in general perform what-if analysis that is usually done during BP simulation [4]. The approach is evaluated using conformance techniques to test whether the automatically created simulation models, once simulated, conform to the processes originating from the source event logs using process mining discovery and conformance techniques. The experiments show that the simulation fits the event log behaviour with at least 50% fitness. Therefore, they can be used in practice. The main benefit of the approach is the reduced human labour required to create the simulation models. Since the discovery of the simulation models is automated, it eliminates the task of initial simulation model creation and allows analysts to focus on adding details specific to analysis tasks. Having the initial simulation models, the analysts could perform business process analysis, including what-if scenarios, data-dependency analysis and other.
This paper consists of 6 sections – the paper starts with an introduction and is followed by related works in section 2. In section 3, the preliminaries are provided – methods used in the approach and the simulation execution are described, and definitions are introduced. Section 4 describes how simulation model is constructed from event logs and probabilistic model and relation between elements in the event log, probabilistic model and simulation model. Section 5 presents how the evaluation was performed, data used in experiments and experimental results. The paper ends with conclusions and further research in section 6.
2.
Related Work
Although there is a need for general purpose BP simulation models, there are no methods to discover fully capable simulation models from event logs, which would be detailed enough to use data in BPs for the control-flow execution, decisions and resource allocations. On the other hand, there are multiple methods to discover such parts or parameters of simulation models [4]. This section provides an overview of related works on process mining and simulation to facilitate BP analysis.
definitions and can be further analysed. There are also methods to discover process models and represent them using other lesser-known notations [7] or widely used Business Process Modelling and Notation (BPMN) [8].
Process mining has seen quite a few applications in BP analysis. It has been used for time prediction: in [9] Van Dongen et al. proposed a method that uses regression equations based on event logs to prepare a model for a prediction on when the process instance (case) will be finished; Van Der Aalst et al. proposed to use transition system discovered from an event log to facilitate time prediction of a case [10]. The mentioned approaches are mathematical models and provide predictive analytics, but their simulation application is limited to estimation of BPs durations. For discovering BP behaviour parameters that can be used in the simulation, process mining provides multiple solutions. For flow simulation, decision rule mining that can be used to predict branching [13]. Also, alignment between an event log and decision points could be used to extract inter-activity data flow rules [11]. Furthermore, rules for control flow can be discovered from data in event logs [10]. Other simulation parameters could also be discovered. For example duration of activities using methods for activity duration prediction [9], or resource constraints using resource scheduling protocols [14]. While there are many possible applications of process mining for discovering BP behaviour, their application, in case of our research, is limited to discovering parameters that can be used for simulation. Authors of [15] performed systematic literature review analysis on what Process Mining methods could be used for discovering data and which could be used in BP simulation, but there is no integration demonstrated for the reviewed approaches, and no experimental studies were done.
Discovery of general simulation models (models, which are not specialized for a single analysis task) from event logs has not been researched widely. Ahn et al. presented a method that uses a refined alpha algorithm to discover workflow paths and durations that are then used to create a discrete event simulation model [16], but the discovered simulation models do not include complex data and decisions. Giuseppe et al. presented an approach to creating a risk-based simulation model to perform conformance analysis of a modelled process [17], and it is focused only on that specific task. Finally, Cho et al. presented a method to discover performance parameters using well-known process mining techniques and manually, based on them, create a simulation model to analyse what-if scenarios [18], but the approach is not presented in detail. None of the found approaches tries to create a model that would provide not only activity and their duration simulation, but also provide the data generated in the activities.
3.
Preliminaries
Simulation is a multi-step process [21], and the steps on how to perform it can be summarised as: data collection, simulation model creation, and execution of the created model. Data for model creation can come from various sources, such as files, e-mails, databases, interviews with employees and others. Since the collection of data is a wide topic and process mining methods use event logs, therefore, in the context of the paper, the data source is also assumed to be a process event log. For the model creation, a behaviour of the process must be identified. The approach models the behaviour of the process using Bayes Belief Network (see section 3.4) for causality and decisions. The approach uses system state transition (see section 3.3) models to constrain possible event sequences. Finally, the data and the behaviour is used to create the simulation model automatically. The simulation is done using dynamic BP simulation approach (see section 3.1). This section describes the proposed approach in detail.
3.1. Dynamic Business Process Simulation
Dynamic BPs do not have a pre-defined sequence of steps [22]. In declarative or imperative process modelling, the execution of processes is managed using control-flow to limit the behaviour [23]. As opposed to this, in dynamic BP execution activities are activated based on rules applied to the context, instead of a control flow mechanism, and as such it adds further flexibility or capability to use complex decisions based on data generated in the process. The dynamic BP simulation was chosen for the approach due to its ability to use data generated inside the processes and use complex contextual rule for controlling the execution of the process [24]. The process model of how such simulation is done is depicted in Figure 1.
During the dynamic BP simulation, contrary to other simulation approaches, the activities to be executed are selected not using standard control-flow techniques, such as events or arcs connecting the activities, but by using predicate rules. Such a selection allows modellers to define complex rules, taking into account resource availability, the current state of the executed process instance, contextual data (such as time, day or recent events) and other constraints. The activities are executed as soon as the predicate rule result is evaluated to true. The contents of the activities are a set of tasks that are atomic and change the state of the process instance. Each activity consists of one or more of the tasks, and, the activity is marked as completed after all tasks are completed.
This loosely-coupled connection between activities and the use of contextual data enables a more stochastic approach for simulation, as compared to other static models. In addition, the use of contextual data in the dynamic BP simulation allows creating simulation models using real historical execution data without abstractions, such as statistical queue models.
Definition 1. The dynamic business process simulation model is defined as a tuple :
Context is a set of elements , where with – the name of context element and – the element value. Context is used to model resources, simulation statistics and other parameters.
Process is a set of Activities. , where is a set of possible activities defined in the process model or dynamically added/removed during simulation.
Rule is a function whose result indicates whether all conditions to execute an activity are satisfied.
Activity is a tuple, where is a set of tasks that have to be executed if rule condition is satisfied and is a set of all possible tasks in simulation model.
Task is a function that can change any element of simulation state, e.g. activities, resources or context. Task is an atomic simulation action that can be neither divided nor interrupted.
Queue is a set of elements , where . is the task to be executed, and is the moment in time when the task should be executed.
3.2. Event Log
In the scope of this paper, event log definition is based on [9], and adapted from authors’ previous work [28]:
Definition 2. An event log over a set of activities A and time domain TD is defined as
, where:
E is a finite set of events
C is a finite set of cases (process instances),
N is a finite set of attribute names,
V is a value space of attributes,
is a finite set of attributes,
is a function assigning each event with attributes and their values,
is a function assigning each event to an activity,
is a function assigning each event to a timestamp,
is a surjective function assigning each event to a case,
is a function identifying the name of an event and
is the succession relation which imposes a direct ordering of the events in E,
is the succession relation which imposes a total ordering of the events in E
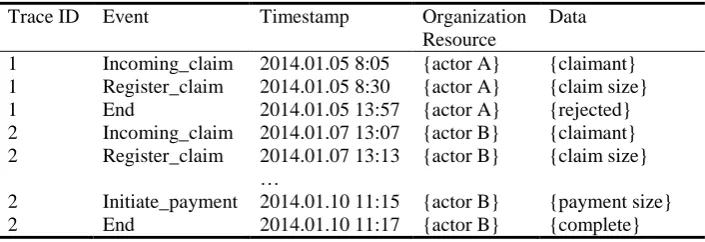
Table 1. Exemplary event log of an insurance claim process
Trace ID Event Timestamp Organization
Resource
Data
1 Incoming_claim 2014.01.05 8:05 {actor A} {claimant} 1 Register_claim 2014.01.05 8:30 {actor A} {claim size}
1 End 2014.01.05 13:57 {actor A} {rejected}
2 Incoming_claim 2014.01.07 13:07 {actor B} {claimant} 2 Register_claim 2014.01.07 13:13 {actor B} {claim size}
…
2 Initiate_payment 2014.01.10 11:15 {actor B} {payment size}
2 End 2014.01.10 11:17 {actor B} {complete}
Table 1 presents a fragment of an exemplary event log, which is based on Synthetic log used in the experiments (see section 5). It contains an identifier of a process instance (also called a trace or a case), an event name, timestamp and other associated domain data, such as claimant, payment size and others.
3.3. Transition System of an Event Log
Definition 3. Given a state representation function and an event representation function , a labelled transition system is defined as where Y is the state space and is a “head” of event sequence in a trace of first k elements. is the set of events labels, and with is the transition relation. is the singleton of initial states and is the set of final states.
In the scope of the paper, the transition system is used to calculate what events, given the current simulation state, are permitted and limit the probability calculations needed by eliminating the sequences that have never occurred and are not present in the event log. The transition system models only sequencing behaviour, but it does not model causality, decisions or data that is used in the processes.
3.4. Probabilistic Business Process Model
BPs are by nature complex and stochastic, therefore existing modelling approaches are not always suitable for simulation. The domain model must satisfy the following constraints to be usable for analysis:
1. The process is a set of activities executed in a specific sequence to transform input into output. Therefore, the model must represent control flow of the process; 2. The process has input, output and generates data. Therefore, the model must take
into account the detailed data occurring in the BP that is stored in an event log; 3. The process has stochastic nature due to human interactions, unknown and
unpredictable context such as weather, clients, third party systems and others. Therefore, the model must represent this stochastic nature;
4. The process contains feedback mechanisms because behaviour and decisions made at one point in the process impact others in complex or indirect ways, therefore, the model must represent feedback mechanisms.
The constraints mentioned above eliminate most of the standard BP modelling languages, such as BPMN, UML Activity Diagrams and Petri Nets, because while they represent control flow and data, they cannot represent stochastic nature and implicit behaviour mechanisms. Their purpose is to provide a static view that represents how the process should behave in a perfect scenario, i.e. to depict how activities follow each other via activity and arc elements. The constraints are often overlooked in real-life scenarios or, in some cases, there are no elements that depict feedback mechanisms between activities not directly linked by arcs. They also often lack detailed view of the data that is occurring in the process and is generated in software systems but not useful for analysts. Another drawback of such models is their limitation to represent past behaviour, i.e. how often and based on what decisions the splits in the control flow of the process were made.
mentioned above because they can represent stochastic nature and implicit feedback mechanisms, but a single model cannot represent control flow and data in a visible manner. They are mathematical, non-graph based models making them hard to depict in a manner that would allow easy identification of activity sequences or attribute dependencies or explain the reasoning of the models.
It leaves only the probabilistic, graph-based methods. Markov chain could be a suitable candidate, but it assumes that given the past, the future is independent and this does not satisfy the 4th constraint. The final candidate is Bayes Belief Network (BBN). It is suitable, because:
The underlying directed acyclic graph (DAG) could represent the control flow;
The conditional probability tables represent data used in the process and: o attribute and value space of the data in the process;
o stochastic nature via probabilities of data occurrence; o feedback mechanism using joint probability tables.
The belief network is defined as:
Definition 4. Belief network over event log L is defined as , where:
is a directed acyclic graph , where P is the set of nodes and E is the set of edges,
is a finite set of conditional probability tables for nodes of graph G and their attributes M,
is a surjective function assigning each conditional probability table to its corresponding node.
Belief network has a strict requirement that the graph modelling the relations between events must be directed and acyclic. Such graph is required because inference using the belief network requires iteration through all causally related nodes. The research on how to extract DAG has already been performed [29]. The DAG is defined as follows:
Definition 5. Directed acyclic graph for event log L is defined as , where:
is a set of nodes for each subset of events not forming a cycle,
is a set of edges connecting nodes, whose representative events directly follow each other,
M is a finite set of attributes,
is a surjective function assigning each attribute to a node.
Finally, all probabilities in the belief network are stored in conditional probability tables, which are defined as:
Definition 6. A Conditional Probability Table of an event is defined as a tuple ), where:
is a set of attributes and their values belonging to the main node of the probability table;
is a probability function assigning conditional probability for each attribute value of the main node related to attribute value set of parent nodes.
The discovered Bayes belief networks model the causality of the events – it facilitates prediction on what events can occur and what data occurs in those events [30]. The approach to mine Bayes belief networks from an event log to represent BP models in probabilistic form was part of previous research and is described in [28], [29].
4.
Simulation Model Generation from Belief Network
In order to simulate processes, a simulation model first needs to be created. Standard simulation models are static, i.e. all elements and the control flow of the process is known before-hand. Contrary to the standard simulation models, we combine process mining techniques with probabilistic models and dynamic BP simulation to facilitate flexible control flow in the BP. The flexibility is achieved by using predicate rules applied on process context to identify when activities can be executed instead of pre-defined arcs.
The approach to generating simulation model from an event log is based on the following sequence of steps:
1. Transition system is discovered from event sequences in an event log as defined in section 3.3;
2. A belief network is discovered from an event log as defined in 3.4;
3. Based on belief network and transition system, a simulation is generated; 4. A belief network is combined with transition system to facilitate inferences on the
events to occur during simulation;
5. The simulation model is manually customised for specific needs. This step requires human input.
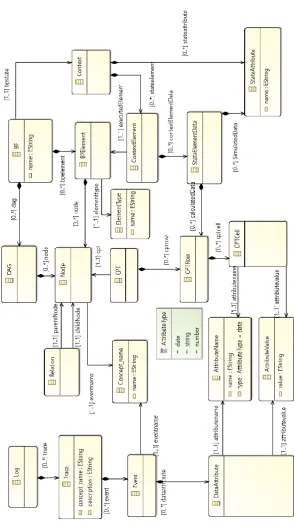
The approach performs multiple transformations and objects of each step are associated with the objects in the following steps. Figure 2 presents the relations between the elements of the event log, the discovered belief network and the simulation model. The elements and their relations are modelled using EMF notation (based on UML class diagram). Everything starts with a log. A log is a set of traces where each one describes how an instance of a process has been executed. A trace contains one or more named events where each of them can have data attributes that are specific to that log. There are two data attributes that are applicable to all events:
Concept:name of data type string that defines a name of an event;
Time:timestamp of data type date that defines when an event has occurred;
Belief Network is a Directed Acyclic Graph where each node has a Conditional Probability Table (CPT). When a belief network is discovered from a log, each node in a DAG of the belief network is named after corresponding event’s concept:name data. Each node in the belief network can have one or more relations that define a conditional dependency to other nodes. Each node has a CPT that is constructed from all occurrences of the corresponding events, their associated data attributes, and preceding events with their data attributes in the same trace. The CPT is a table, therefore it consists of Cells where each cell defines a data attribute’svalue, and each Row has a probability to occur. The probabilistic model creation is part of previous research [29][30].
For the creation of the simulation model, we start with the association of elements of the belief network, simulation model and event log:
, where is an injective surjective function mapping each node of the belief network graph to a specific name of events in the log;
aca is a function mapping each activity of simulation model s to node of a belief network graph ;
is a function generating random attributes with values from previously observed attribute list of the events represented by the activity ;
When a simulation model is being created, a belief network’s DAG is a direct source of the initial Business Process(BP). Each node in the DAG is transformed to Business Process Element (BPElement). As an event in a log can represent any element type (BPElementType) of a process, its type is, by default, selected to be Activity. If it is not the correct element type, the user of the simulation could set it to another appropriate type. This way, the initial set of activities is created:
Definition 7. is the initial set of activities, where ;
Each activity in the simulation model consists of a set of tasks and a rule that defines when an activity can occur. The rules are in the form of a predicate and define a condition, which, when satisfied, allows an activity to occur. The idea of the approach is to automatically generate a simplified simulation model, which could further be customised. Therefore, the idea is that during the simulation, activities should occur when in reality they would have the highest probability of occurrence. As such, when a node is transformed to activity, the rule when the activity can occur is defined as:
Definition 8. A default activity rule r is defined as
In other words, if the simulation is started and, based on the current state of the process, the next most probable event is represented by the activity, and then this specific activity should be executed next.
to this is if one of the data attributes and is named duration, in which case it is used as the duration of the task. Otherwise, the activity has no duration, i.e. it is instantaneous. The default task is defined as follows:
Definition 9. A default task of activity is such operation that modifies context in such a way .
Once generated, the model can be customised based on the needs of the simulation performers. The customisations can be such as the addition of other activities, modification of activation rules, and/or modification of activity behaviour. For example, if there is a need to customize the model and add a rule, that warehouse accepts incoming transport only after 9:00am and only until 6:00pm, the activity “accept transport” could be modified that its activation rule in pseudo code is “$time > (9:00am) and $time < (6:00pm) and $started = true and most_probable_next_event(accept transport) = true” . Another example could be that the performers want to test only a single decision path. In that case, generated activities could be modified to generate a specific set of data attributes that force a specific process path as opposed to pseudo-random data. This way, the approach allows simulation performers to automatically generate the initial simulation model from an event log and then modify it for their needs to test what-if scenarios or analyse general process behaviour.
5.
Evaluation of the Approach
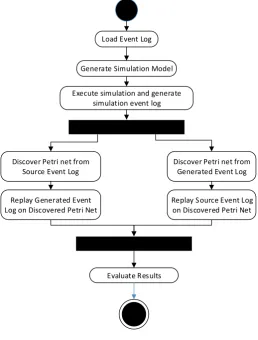
The proposed approach takes an event log describing historical BP execution and uses it to create a simulation model. The simulation imitates the behaviour of the process, therefore, in order to evaluate the effectiveness of the approach, there is a need to compare the input of the event log with the output of the simulation. The similarity between the input event log and the output of the simulation describes how well the approach is suitable for discovery of simulation models. To evaluate how effective is the approach, it was decided to discover a simulation from an event log, perform the simulation to create an output event log and cross-check it with the source event log to measure the similarity. The effectiveness of the approach is based on the calculated fitness between the event logs and Petri nets discovered from the event logs. The applied evaluation method is depicted in figure 3. It consists of the following steps: 1. Load Event Log;
2. Generate simulation model based on the event log;
3. Execute simulation and generate simulation event log. The simulation is performed for at least 250 cases and generates event log of the resulting simulation (GEL); 4. Apply conformance checking methods to test source event log (SEL) against
simulated event log:
a. Discover Petri net from Source Event Log. The discovery is done using Inductive miner;
b. Discover Petri net from Generated Event Log. The discovery is done using Inductive miner;
Load Event Log
Generate Simulation Model
Execute simulation and generate simulation event log
Discover Petri net from Source Event Log
Discover Petri net from Generated Event Log
Replay Generated Event Log on Discovered Petri Net
Replay Source Event Log on Discovered Petri Net
Evaluate Results
Fig 3. Evaluation Approach listing activities on how the proposed approach is experimentally evaluated
strict control flow between the activities. Fragment of it can be found in Table 1 and the control flow in the Figure 4. The other selected event logs were of real processes. Three of the real-life process event logs were taken from Business Process Intelligence (BPI) conference challenge to make sure at least some of the experimental data is open source and has already been investigated by other researchers.
The first of the selected BPI logs is the BPI’12 event log which belong to a process where an application is submitted through a webpage. Then, some automatic checks are performed, and the application is complemented with additional information. This information is obtained by contacting the customer by phone. If an applicant is eligible, an offer is sent to the client by mail. After this offer is received back, it is assessed. When it is incomplete, missing information is added by again contacting the customer. Then a final assessment is done and the application is approved and activated [35]. The second log is the BPI’13 event log from Volvo IT Belgium for this challenge. The log contains events from an incident and problem management system called VINST [36].The final BPI log is the BPI’15 event log of five Dutch municipalities. The data contains building permit applications over a period of approximately four years. There are many different activities present. The cases in the log contain information on the main application as well as objection procedures in various stages. Furthermore, information is available about the resource that carried out the task and on the cost of the application [37].
The final log was taken from an educational institution with student edicts. The student edict sequence depicts the study process that is governed by the edicts the faculty dean or the rector. The edicts range from admittance to university, to the grant of a degree. The process is the most complex one because it has no clear control-flow and can be stopped at any time (via acquittal edict).
The simulation was executed using those event logs, called Source Event Log (SEL). The result of the simulation was a generated event log (GEL) that was used for further evaluation. The properties of the SEL and GEL are listed in table 2.
Table 2. Parameters of the logs used in evaluation
Log Traces Unique Events Total Events Attributes
Synthetic log – source 3512 9 20339 2-6
Synthetic log - generated 530 9 4240 2-6
BPI12 – source 13087 36 262200 3-4
BPI12- generated 530 34 4526 3-4
BPI13 - source 7554 13 65535 9
BPI13 - generated 524 10 1231 9
BPI15 - source 1156 289 59083 12
BPI15 - generated 250 136 38364 12
University -source 2774 63 21392 6
University - generated 542 43 2955 6
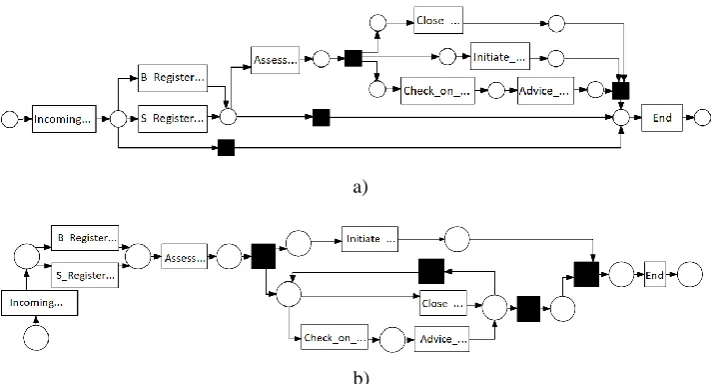
cross-replaying of the event logs against two mined Petri nets to reduce the impact of the chosen discovery algorithm.
a)
b)
Fig. 4. Petri Net discovered from Synthetic Log Source (a) and Generated Event Log (b) using Inductive Miner
Table 3. Simulation evaluation results for different event logs
Log SEL conformance with GMM GEL conformance with SMM
Trace Fitness Move-Log fitness
Trace Fitness Move-Log fitness
Synthetic log 0.795 1.000 1.000 1.000
BPI12 0.821 0.817 0.814 0.771
BPI13 0.928 0.906 0.438 0.582
BPI15 0.572 0.585 0.886 0.832
University 0.982 0.995 0.979 0.987
SEL – Source event log, SMM – Mined Model from Source event log, GEL – Generated event log, GMM – Mined model from generated event log
The fitness of the GEL against the SMM varies more widely than the other way around – range of 0.438–1.000 versus that of 0.572–0.982 for SEL against GMM. Such variation could be explained by the fact that GEL contains probabilistically generated events. Therefore some control-flow path errors might occur such as repeating or switched ({a,b} instead of {b,a} as required by SMM). Furthermore, the lowest fitness was for BPI13 log that might have insufficient inferred causality between the attributes causing errors in the log, although this needs to be further analysed.
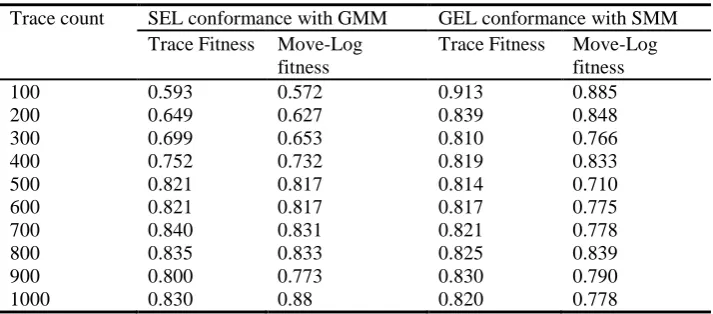
To test whether increasing the amount of simulated traces improved the expressiveness of the generated process and to find the lower bound of the traces that stabilised simulation results, we tried a different length of simulation with differing amounts of resulting traces. The tests were done with 100–1000 simulation runs for the BPI12 log. This specific log was chosen because it has is not a simple process (36 possible distinct events with 3–4 attributes), and the source event log contained many traces (13087 in total) ensuring that the discovered belief network was sufficiently trained with the source data. The results are shown in table 4.
Table 4. Simulation evaluation results for differing trace counts
The fitness of generated event log against Petri Net discovered from source event log increases when the simulated trace count is decreasing, and source event log conformance with Petri Net discovered from the generated event log decreases when the count is decreasing. In both cases, the fitness stabilises at 500 traces, with fitness variation less than 5% for trace fitness, which can be accounted by the fact, that simulation is probabilistic, and each run is independent of previous runs. Therefore, such statistical significance is within acceptable boundaries. Also, each simulation run results in a unique event log, and there can be variation in the discovered BP model, increasing the fitness variation. The number of traces required to stabilise the fitness can explain why the BPI15 fitness results were so low – the process is very complex (has 289 unique events), and there were not enough simulated traces (250) to reach stable fitness results. The low fitness is further proven by the number of unique events that were in the generated event log – only 139 compared to 289 in the source event log.
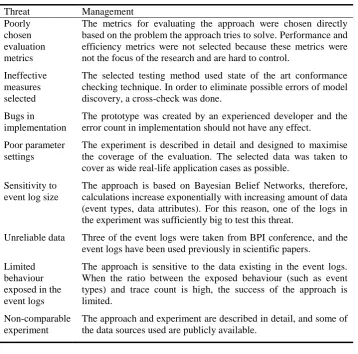
The presented approach was created using constructive research method and threats to the validity of the research must be addressed. The chosen validity threat classes were Construct, Internal and External. The assessment is presented in Tables 5–7.
Trace count SEL conformance with GMM GEL conformance with SMM Trace Fitness Move-Log
fitness
Trace Fitness Move-Log fitness
100 0.593 0.572 0.913 0.885
200 0.649 0.627 0.839 0.848
300 0.699 0.653 0.810 0.766
400 0.752 0.732 0.819 0.833
500 0.821 0.817 0.814 0.710
600 0.821 0.817 0.817 0.775
700 0.840 0.831 0.821 0.778
800 0.835 0.833 0.825 0.839
900 0.800 0.773 0.830 0.790
Table 5. Threat to Validity Assessment
Threat Management
Poorly chosen evaluation metrics
The metrics for evaluating the approach were chosen directly based on the problem the approach tries to solve. Performance and efficiency metrics were not selected because these metrics were not the focus of the research and are hard to control.
Ineffective measures selected
The selected testing method used state of the art conformance checking technique. In order to eliminate possible errors of model discovery, a cross-check was done.
Bugs in implementation
The prototype was created by an experienced developer and the error count in implementation should not have any effect.
Poor parameter settings
The experiment is described in detail and designed to maximise the coverage of the evaluation. The selected data was taken to cover as wide real-life application cases as possible.
Sensitivity to event log size
The approach is based on Bayesian Belief Networks, therefore, calculations increase exponentially with increasing amount of data (event types, data attributes). For this reason, one of the logs in the experiment was sufficiently big to test this threat.
Unreliable data Three of the event logs were taken from BPI conference, and the event logs have been used previously in scientific papers.
Limited behaviour exposed in the event logs
The approach is sensitive to the data existing in the event logs. When the ratio between the exposed behaviour (such as event types) and trace count is high, the success of the approach is limited.
Non-comparable experiment
The approach and experiment are described in detail, and some of the data sources used are publicly available.
6.
Conclusions
The paper presents a novel approach on how to automatically generate BP simulation models, where the input is an event log with historical data of BP execution taken out of an IS and the output is a simulation-ready model. In practice, the approach can be used for generating random event logs from source event logs or for simulation models to be used in BP analysis. The generated simulation model eliminates the initial workload of the analyst and allows to focus only on customisations based on business analyst’s needs, e.g. to force execution paths or modify execution of generated activities for what-if analysis.
generated event log was at least 0.886 for complex event log and 1.000 for the simple synthetic event log.
Cross-checking of discovered Petri net conformance with the source event log has shown worse fitness, but this could be explained by the fact that the simulation was shorter, and during the simulation, generated fewer instances and less data was generated than the source log while the source log represented a complex process. Therefore, the simulation did not achieve the same expressiveness compared to the source event log, and this needs further research.
The approach, in the current state, has limitations that inhibit its wide application. There is a need to identify the context where the approach reaches satisfiable results and extend the simulated behaviour to not only control flow and data but other aspects as well.
To extend the simulated behaviour, there is a need to increase the capabilities of simulation by discovering other elements (besides activities and data-based control flow) in the simulation model, such as events, decisions, resources and business rules. For such element detection, other approaches, such as BPMN model discovery [8] or resource protocol discovery [38] could be applied, but this needs to be further researched.
To clarify the context of the applicability, there is a need to investigate data dependency between the data attributes in the event log and the simulation results and how many simulation instances need to be executed to achieve the same expressiveness of the processes as is available in the source event logs. While this has been done in this paper (table 4), each event log and simulation model is unique and clear dependency rules should be identified to clarify the context when this approach could be unsuitable.
References
1. R. K. L. Ko, S. S. G. Lee, and E. Wah Lee, “Business process management (BPM) standards: a survey,” Bus. Process Manag. J., vol. 15, no. 5, pp. 744–791, 2009.
2. M. I. Kellner, R. J. Madachy, and D. M. Raffo, “Software process simulation modeling: Why? What? How?,” J. Syst. Softw., vol. 46, no. 2, pp. 91–105, 1999.
3. G. Vossen, “The process mining manifesto - An interview with Wil van der Aalst,” in Information Systems, 2012, vol. 37, no. 3, pp. 288–290.
4. N. Martin, B. Depaire, and A. Caris, “The use of process mining in a business process simulation context: Overview and challenges,” IEEE SSCI 2014 - 2014 IEEE Symp. Ser. Comput. Intell. - CIDM 2014 2014 IEEE Symp. Comput. Intell. Data Mining, Proc., pp. 381– 388, 2015.
5. W. M. P. Van Der Aalst, T. Weijters, and L. Maruster, “Workflow mining: Discovering process models from event logs,” IEEE Trans. Knowl. Data Eng., vol. 16, no. 9, pp. 1128– 1142, 2004.
6. A. J. M. M. Weijters, W. M. P. Van Der Aalst, and A. K. A. De Medeiros, “Process Mining with the Heuristics Miner Algorithm,” Tech. Univ. Eindhoven, Tech. Rep. WP, vol. 166, pp. 1–34, 2006.
7. A. J. M. M. Weijters and J. T. S. Ribeiro, “Flexible heuristics miner (FHM),” IEEE SSCI 2011 Symp. Ser. Comput. Intell. - CIDM 2011 2011 IEEE Symp. Comput. Intell. Data Min., vol. 334, no. December, pp. 310–317, 2011.
9. B. F. Van Dongen, R. A. Crooy, and W. M. P. Van Der Aalst, “Cycle time prediction: When will this case finally be finished?,” Lect. Notes Comput. Sci. (including Subser. Lect. Notes Artif. Intell. Lect. Notes Bioinformatics), vol. 5331 LNCS, no. PART 1, pp. 319–336, 2008. 10. W. M. P. Van Der Aalst, M. H. Schonenberg, and M. Song, “Time prediction based on
process mining,” Inf. Syst., vol. 36, no. 2, pp. 450–475, 2011.
11. [M. De Leoni and W. M. P. Van Der Aalst, “Data-aware process mining,” Proc. 28th Annu. ACM Symp. Appl. Comput. - SAC ’13, p. 1454, 2013.
12. Y. Liu, H. Zhang, C. Li, and R. J. Jiao, “Workflow simulation for operational decision support using event graph through process mining,” Decis. Support Syst., vol. 52, no. 3, pp. 685–697, 2012.
13. A. Rozinat and W. M. P. Van Der Aalst, “Decision mining in business processes,” BPM Cent. Rep. BPM-06-10, vol. 6, no. 10, 2006.
14. A. Senderovich, M. Weidlich, A. Gal, and A. Mandelbaum, “Queue mining - Predicting delays in service processes,” Lect. Notes Comput. Sci. (including Subser. Lect. Notes Artif. Intell. Lect. Notes Bioinformatics), vol. 8484 LNCS, pp. 42–57, 2014.
15. N. Martin, B. Depaire, and A. Caris, “The Use of Process Mining in Business Process Simulation Model Construction,” Bus. Inf. Syst. Eng., vol. 58, no. 1, pp. 73–87, 2016. 16. S. Ahn, P. S. Dunston, A. Kandil, and J. C. Martinez, “Process mining technique for
automated simulation model generation using activity log data,” in Congress on Computing in Civil Engineering, Proceedings, vol. 2015–Janua, no. January, 2015, pp. 636–643. 17. C. Giuseppe, M. Valerio, M. Teresa, and S. L. Carmela, “A Simulation Approach in Process
Mining Conformance Analysis. The Introduction of a Brand New BPMN Element.,” IERI Procedia, vol. 6, pp. 45–51, 2014.
18. M. Cho, M. Song, and S. Yoo, “A systematic methodology for outpatient process analysis based on process mining,” in Asia-Pacific Conference on Business Process Management, 2014, pp. 31–42.
19. F. Szimanski, G. Ralha, G. Wagner, and D. R. Ferreira, “Improving Business Process Models with Agent-Based Simulation and Process Mining,” Lect. Notes Bus. Inf. Process., vol. 147 LNBIP, pp. 124–138, 2013.
20. L. Ackermann, S. Schönig, and S. Jablonski, “Inter-Paradigm Translation of Process Models using Simulation and Mining,” CoRR, 2016.
21. D. R. C. Hill, Theory of Modelling and Simulation: Integrating Discrete Event and Continuous Complex Dynamic Systems: Second Edition by B. P. Zeigler, H. Praehofer, T. G. Kim, Academic Press, San Diego, CA, 2000., vol. 12, no. 1. 2002.
22. D. Kalibatiene, O. Vasilecas, T. Savickas, T. Vysockis, and V. Bobrovs, “A New Approach on Rule and Context Based Dynamic Business Process Simulation,” Balt. J. Mod. Comput., vol. 12, no. 1, pp. 408–419, 2016.
23. D. Fahland, J. Mendling, H. A. Reijers, B. Weber, M. Weidlich, and S. Zugal, “Declarative versus imperative process modeling languages: The issue of maintainability,” Lect. Notes Bus. Inf. Process., vol. 43 LNBIP, pp. 477–488, 2010.
24. O. Vasilecas, D. Kalibatiene, and D. Lavbič, “Rule- and context-based dynamic business process modelling and simulation,” J. Syst. Softw., vol. 122, pp. 1–15, 2016.
25. O. Vasilecas, T. Savickas, K. Normantas, T. Vysockis, and D. Kalibatiene, “A Goal-Oriented Approach to Dynamic Business Process Simulation,” in Databases and Information Systems IX: Selected Papers from the Twelfth International Baltic Conference, DB&IS 2016, 2015, vol. 291, p. 143.
26. S. Buckl, F. Matthes, C. Neubert, and C. M. Schweda, “Information Systems Evolution,” in Lecture Notes in Business Information Processing, 2011, vol. 72, pp. 136–149.
28. T. Savickas and O. Vasilecas, “Bayesian belief network application in process mining,” Proc. 15th Int. Conf. Comput. Syst. Technol. - CompSysTech ’14, vol. 883, pp. 226–233, 2014.
29. O. Vasilecas, T. Savickas, and E. Lebedys, “Directed Acyclic Graph Extraction from Event Logs,” in Information and Software Technologies, Springer, 2014, pp. 172–181.
30. O. Vasilecas, D. Kalibatiene, T. Savickas, A. Smaizys, J. Trinkunas, and E. Lebedys, “Decision-making in information systems based on new development framework and business process mining,” in Frontiers in Artificial Intelligence and Applications, 2014, vol. Databases, pp. 129–142.
31. S. J. J. Leemans, D. Fahland, and W. M. P. Van Der Aalst, “Discovering block-structured process models from event logs-a constructive approach,” in Application and Theory of Petri Nets and Concurrency, 2013, pp. 311–329.
32. W. M. P. Van Der Aalst, A. Adriansyah, and B. F. Van Dongen, “Replaying history on process models for conformance checking and performance analysis,” Wiley Interdiscip. Rev. Data Min. Knowl. Discov., vol. 2, no. 2, pp. 182–192, Mar. 2012.
33. S. J. J. Leemans, D. Fahland, and W. M. P. Van Der Aalst, “Discovering block-structured process models from event logs containing infrequent behaviour,” in Lecture Notes in Business Information Processing, 2014, vol. 171, pp. 66–78.
34. A. Adriansyah, B. F. Van Dongen, and W. M. P. Van Der Aalst, “Conformance checking using cost-based fitness analysis,” in Proceedings - IEEE International Enterprise Distributed Object Computing Workshop, EDOC, 2011, pp. 55–64.
35. B. F. Van Dongen, “BPI Challenge 2012.” Eindhoven University of Technology, 2012. 36. W. Steeman, “BPI Challenge 2013, incidents. Ghent University. Dataset.” Ghent University,
2013.
37. B. F. Van Dongen, “BPI Challenge 2015 Municipality 5.” Eindhoven University of Technology, 2015.
38. A. Senderovich, M. Weidlich, A. Gal, and A. Mandelbaum, “Mining resource scheduling protocols,” in Lecture Notes in Computer Science (including subseries Lecture Notes in Artificial Intelligence and Lecture Notes in Bioinformatics), vol. 8659 LNCS, S. Sadiq, P. Soffer, and H. Völzer, Eds. Cham: Springer International Publishing, 2014, pp. 200–216.
Titas Savickas has doctoral degree in informatics engineering acquired in 2017 in Vilnius Gediminas Technical University. Current research is focused on process mining and its application in business process analysis, such as prediction and simulation.
Olegas Vasilecas is a full professor in Information System Department of the Vilnius Gediminas Technical University and a researcher in Vilnius University Institute of Mathematics and Informatics. He has many years of practical and research experience in Information System development. Current research areas include business, information and software systems engineering; knowledge based information systems; business process modelling and simulation; systems theory and engineering, modern databases.
![Fig. 1. A process on how simulation of dynamic business process is performed [25]](https://thumb-us.123doks.com/thumbv2/123dok_us/1167204.1619179/4.595.132.462.475.674/fig-process-simulation-dynamic-business-process-performed.webp)