Classification and Analysis of MOOCs Learner’s State:
The Study of Hidden Markov Model
Haijian Chen1, Yonghui Dai2, Heyu Gao3, Dongmei Han3, and Shan Li2
1
Institute of science and technology, Shanghai Open University, Shanghai 200433, China [email protected]
2
Management School, Shanghai University of International Business and Economics, Shanghai 201620, China
[email protected], [email protected] 3
School of Information Management and Engineering, Shanghai University of Finance and Economics, Shanghai 200433, China
[email protected], [email protected]
Abstract. In MOOCs, learner’s state is a key factor to learning effect. In order to study on learner’s state and its change, the Hidden Markov Model was applied in our study, and some data of learner were analyzed, which includes MOOCs learner’s basic information, learning behavior data, curriculum scores and data of participa-tion in learning activities. The relaparticipa-tionship of the learning state, the environment factors and the learner’s individual conditions was found based on the data mining of the above of learning behavior data. Generally, there are three main conclusions in our research. Firstly, learners with different educational background have differ-ent learning states when they first learn from MOOCs. Secondly, the environmdiffer-ental factors such as curriculum quality, overall learning status and number of learners will influence the change of learners’ learning status. Thirdly, the learner’s behav-ioral expression is an observational signal of different learning states, which can be used to detect and manage the learner’s learning states in different periods. From the analysis results of Hidden Markov Model, it is found that learners in different learning states can adopt appropriate methods to improve their learning efficiency. If the learner is in a negative state, the learning efficiency can be improved by im-proving the learning environment. If the learner is in a positive state, the positive learning status of the surrounding learners can help him or her maintain current state. Our research can help the MOOCs institutions improve the curriculum and provide reference for the development of MOOCs teaching.
Keywords:Classification and analysis, Hidden Markov model, MOOCs Learner’s state, Learning behavior, Status transition.
1.
Introduction
the self-participation of learners, so the course withdrawal rate is high and the resource utilization of the platform is very low. (2) The evaluation system of learning outcomes is imperfect, and the relationship between the environmental indicators and learning behav-ior has not been established, so the learners with poor expression cannot help them adjust the current learning mode in time. (3) As the lack of effective data analysis, it is difficult for learners to grasp the learning state. In the past, most of the relevant research explained the relationship between environment and learning behavior from the perspective of be-havioral theory or education, and lacked quantitative analysis.
By summarizing the previous literatures, it is found that the learning state of platform learners in the real world is not only related to the psychological factors and life fac-tors of the learners themselves, but also related to the overall learning atmosphere of the MOOCs platform. Because learners’ participation in distance education is mainly based on autonomous learning. So, learners’ awareness of the platform environment will affect their attitude towards curriculum learning. In order to study the above problems, the Hid-den Markov Model was applied to our study, which was used to quantitatively explain the relationship between environmental factors, learning behaviors and learner’s individual conditions.
This paper is organized as follows. In section 2, related research of learner behavior and Hidden Markov Model are introduced. In section 3, the modeling of learning state transition is shown. In section 4, verification of model is illustrated. Section 5 is the dis-cussion and conclusions of this article.
2.
Related Works
Learning behaviors includes learning motivations and all behaviors in the realization of learning objectives, and it can be regarded as the result of interaction between learners and learning environment. From previous studies, scholars mainly focus on learning behavior and motivation.
2.1. Learner Behavior
In the study of teaching based on learning behavior, learners are classified according to learning behaviors, and teaching suggestions and measures are proposed for each cate-gory. Wang (2014) analyzed the five types of MOOCs learners, namely, non-participants, passive participants, temporary participants, passive mandatory participants, active par-ticipants, and discussed the learning effect of students on the MOOCs platform [17]. Yao (2009) defined learning behavior as negative and positive, which including the four di-mensions of attention, motivation, learning attitude and learning strategy [22]. In addi-tion, in the study of learner emotions, some scholars proposed learner’s emotion recog-nition model based on cognitive evaluation in E-learning system and OCC model, which used Mamdani fuzzy inference model to realize students’ expectation of learning events, and simulated the model by constructing dynamic Bayesian network (Qiao, 2010; Wang, 2011) [13][18].
2.2. Hidden Markov Model
Hidden Markov model can be used to describe the process of randomly generating obser-vation sequences of hidden Markov chains, which was originally applied in the field of ecology [1]. Since then many research works have focused on the application of Hidden Markov Models in signal recognition such as speech recognition and motion recognition. In the study of behavior classification, Honsel (2016) selected the software development exchange platform and scored the number of applications submitted by developers, bug fixes, and responses to related questions, and classified hidden forms by comprehensive scores [6]. In the study of motion recognition, Yamato (1992) identified the tennis ac-tion, and then transformed the picture into a sequence of features, and converted it into an observation sequence [21]. He (2016) selected netizens’ characteristics, information subjects and information content completion degree to establish three-dimensional indi-cators, and divided four implicit states according to the changes of attention, and then established Hidden Markov Model according to the event evolution process of micro blog public opinion [5]. Pu (2014) used the Hidden Markov Model to dynamically predict the user’s interest changes, and defined the interest transfer state according to the user’s change of topic interest [12].
the perspective of objective conditions. Since these states have hidden features and need to be reflected by the explicit behavior of learning, the learning state can be studied as the hidden state in the HMM.
3.
Modeling of Learning State Transition
This article chooses the platform of www.shlll.net for study. The curriculum of this plat-form includes different categories such as life and health care, literature and art, higher education, vocational education and so on. Users of the platform include students, profes-sional workers and migrant workers.
3.1. Definition of Learning State Transition
According to the application conditions of HMM, the observation behavior is determined by the hidden state, and the hidden state of the current period is affected by the hidden state of the previous period. Therefore, the following hypothesis is made in this paper. It is assumed that the learner’s course learning behavior is determined only by the learning state, that is, it will exhibit certain regular behavior in the same state. And the learning state shifts to the first-order Markov process. This paper studies the influence of objective learning environment on learning state, assuming that the learner’s life and work will not affect the learning of the online course, and the learner’s own behavior in the current period will not affect the next learning state. The relevant symbols indicating the change of the learning state in the time series are shown in Table1.
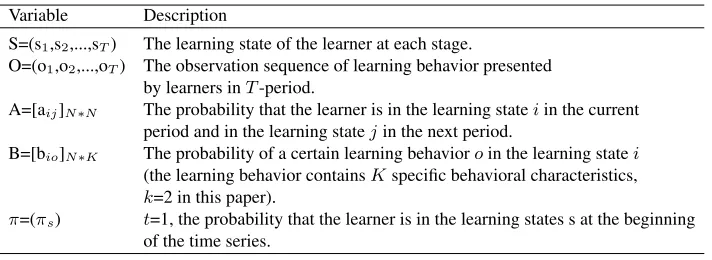
Table 1.HMM parameter symbol description
Variable Description
S=(s1,s2,...,sT) The learning state of the learner at each stage.
O=(o1,o2,...,oT) The observation sequence of learning behavior presented
by learners inT-period.
A=[aij]N∗N The probability that the learner is in the learning stateiin the current
period and in the learning statejin the next period.
B=[bio]N∗K The probability of a certain learning behavioroin the learning statei
(the learning behavior containsKspecific behavioral characteristics, k=2 in this paper).
π=(πs) t=1, the probability that the learner is in the learning states s at the beginning
of the time series.
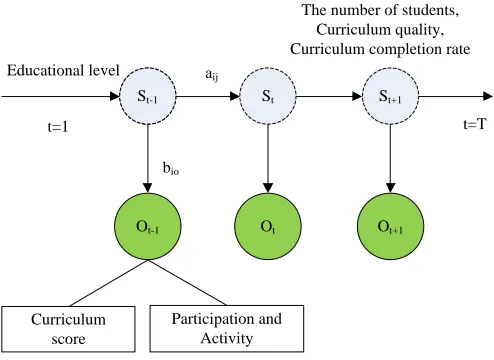
The explanation of the relationship between learning state transition and observable learning behavior in different periods is shown as Fig. 1. In each period t, the learner will be in a state of N states with a certain probability. The learning state transition probability
aij indicates that the learner is currently in a certain state, the likelihood and tendency
to move to another learning state or remain in the current state in the next period.bio
we studied the influence of objective environment on learner state transition probability aij, including internal course quality, the number of students in the internal course and
the learning situation of internal curriculum. In addition, the academic level will have an impact on the learning state att=1.
St-1
Ot-1
t=1 t=T
aij
bio
Curriculum score
Participation and Activity
St-1 St St+1
Educational level
The number of students, Curriculum quality, Curriculum completion rate
Ot Ot+1
Fig. 1.Learning state transition and observable learning behavior in different periods
According to the three basic elements in the HMM, that is observation sequence, hidden state and initial state. Three basic parameters of the model is definedλ={A,B,
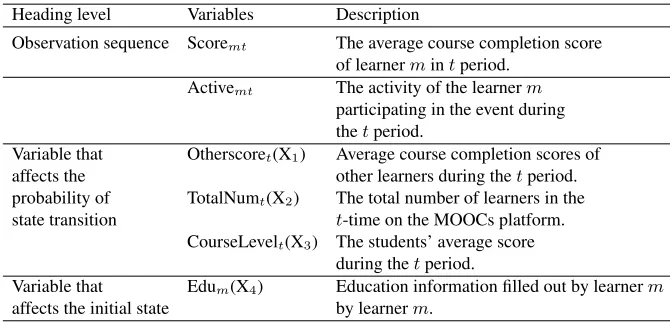
π}, which is defined respectively as the learning state transition probability, the learning behavior observation probability and the initial learning state probability. After that, some variables were selected according to HMM model, and it is shown in Table2.
3.2. Learning Behavior Observation Sequence Description
Two indexes of learning behavior observation sequence were selected, one is the com-pletion score of the internal course, and the other is the activity of participating in the activity.
Average Score of Internal Courses The learner’s course score is calculated based on the course completion rate and the learning interval. Referring to the calculation method of the credit rating [11], the course score was defined by a linear transformation according to formula (1) within a certain interval without changing the learner’s completion status. Based on the test of the model results, the learner’s score interval is defined as (1) and (2).
Score= 1 + 1∗Completionrate (1)
Table 2.HMM model selection variable interpretation
Heading level Variables Description
Observation sequence Scoremt The average course completion score
of learnermintperiod. Activemt The activity of the learnerm
participating in the event during thetperiod.
Variable that Otherscoret(X1) Average course completion scores of
affects the other learners during thetperiod.
probability of TotalNumt(X2) The total number of learners in the
state transition t-time on the MOOCs platform.
CourseLevelt(X3) The students’ average score during thetperiod.
Variable that Edum(X4) Education information filled out by learnerm affects the initial state by learnerm.
changes in the form of a negative index. If the learner’s knowledge is reduced, his or her course score will also decrease. For example, the course scores of learnermintperiod are calculated as follows, where parameterScoremt‘ refers to the recent course score of
learnerm, parameterIntervalmtrefers to the interval at which the learnermlearns the
course from thetperiod.
Scoremt=Scoremt‘exp(−KIntervalmt) (2)
The average score of internal courses is a continuous variable. The course scores in a certain state obey the normal distribution. For each learning state, the course scores have different mean and variance. The probability of learners get course scoresxin theistate is expressed as follows.
b1i(x) = 1
(2π)12σi
e−2σ12(x−ui)2, i= 1,2, ..., N (3)
Participation in Activities Another measure of activity is the statistics of the number of learners participating in activities. For example, statistics on learners’ participation in various learning activities over a period of time. If the number of learners participating in activities is 0, and the value in discrete expression is 1, the value of other activities were equalization and discretization. The sample of value of activity is shown in Table3.
Table 3.Discrete of activity value
Number of activities Value
0 1
1 2
For the activity observation sequence, the observation probability matrix is directly used for initialization and iterative estimation. The matrix form is show as follows, where b2iaindicates the probability that theistate appears as the activity ofa, andi=1,2,...,n,a= 1,2,3.
b2
11 b212 b212
b2
21 b222 b223 ..
. ... ...
b2
n1b2n2b2n3
(4)
4.
Verification of model
4.1. Data collection
The research data of this paper is collected and analysed by the MOOCs platform of www.shlll.net. The analysis shows that the quality of the course in the MOOCs platform, the online interaction of the learners, and the various interest groups on the online will in-fluence the learner’s recognition of the online course environment, and affect the learning status.
The learners who choose to study the internal curriculum are the research objects, and when analyzing the influence of the objective environment on the state transition, the average scores of other learners, the course scores and the number of learners are standardized to compare the influence of these three variables on the state transition. The sample of model is shown in Table 4.
Table 4.Sample of Model
Time Unit Month
Selection condition Learning duration is more than one year Start and end time January 2013 to December 2016 Number of students 62
Number of samples 1367
Table 5.Sample of Model
Name Number Minimum Maximum Average Standard deviation
Score 1367 0.13 2 0.99 0.41
Active 1367 1 3 1.23 0.54
Edu 1367 1 7 4.82 1.78
OtherScore 1367 0.89 2 1.46 0.15
CourseLevel 1367 3.87 5.00 4.36 0.20
TotalNum 1367 3 899 234.57 220.32
4.2. Model Parameter Estimation
The model parameters are estimated by EM algorithm (Zhang, 2014), and the hidden state as 2, 3, 4 was selected respectively, and the maximum likelihood and BIC values estimated by the model are as follows: 1027.873, 21875.13), 693.0693, 1674.954), (-654.5903, 1514.607). According to the BIC (Bayesian Information Criterion), the effect of the four states is not obvious. So three hidden states are selected for analysis in our study, and it was defined as negative, normal and positive states, and they were represented by numbers 1, 2, and 3 respectively. And then behavior theory was used to analyze the initial state probability parameters, observation probability parameters and state transition probability parameters in the model.
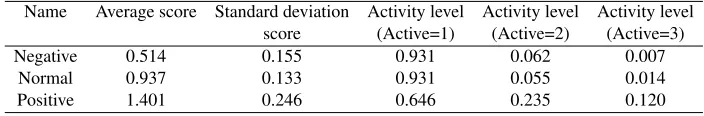
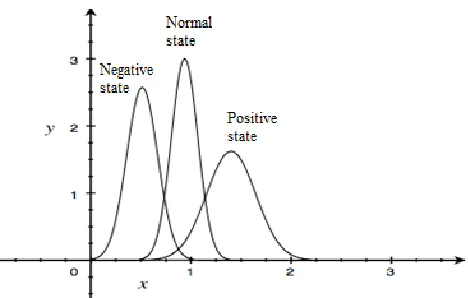
Learning Characteristics in Different States According to the model, the learner status classification result and the course score distribution can be obtained. The mean, standard deviation, and activity probability of the positive distribution of the course scores of learn-ers with different learning states are shown in Table 6. The course scores in different states are shown in Fig. 2.
Table 6.Sample of Model
Name Average score Standard deviation Activity level Activity level Activity level
score (Active=1) (Active=2) (Active=3)
Negative 0.514 0.155 0.931 0.062 0.007
Normal 0.937 0.133 0.931 0.055 0.014
Positive 1.401 0.246 0.646 0.235 0.120
Fig. 2.Course scores in different states
Previous studies have shown that learners who participate in various activities on the distance learning platform are more likely to get higher scores in course learning [15], and learners with stronger autonomy will not be limited to course of video learning, and they learn in more diverse ways. Learners who are in a negative state do not perform well in both course completion scores and activity participation, and there is a risk of exiting the learning platform. Combining the behavioral responses in different states, the three learning states are defined as follows.
(1) The learners in the negative state are slack in both course learning and activity participation, and they belong to the bystanders and are subject to the risk of losing users. (2) Learners have a good attitude towards learning at a normal state, he or she will take the initiative to study some courses and participate in the test or related activities in the course. However, there is no clear goal for completing the course, and he or she will learn with a relatively relaxed attitude.
(3) Positive state. The learners aim to complete the course study and will fully partic-ipate in the study of the class. The frequency of the course is high and they will actively participate in the activities on the platform.
According to the Viterbi algorithm, the learning state of learners in each period is predicted, which is shown as in Fig. 3.
It can be seen from Fig. 3, the number of active learners in 2014 is large, especially between July 2014 and January 2015 (the green area in Fig. 3), most of them are in a better learning state, and there are no negative learners (the red area in Fig. 3). After 2015, the proportion of learners who are in a negative state has increased. After July 2016, the proportion of negative learners has decreased. The number of learners who are in a positive and stable state has increased, and the learning attitude of learners on the platform has improved.
Fig. 3.The proportion of learners in different learning states in each period
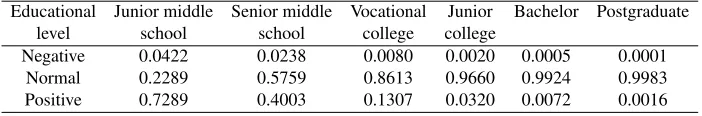
Table 7.Initial state probability of different educational level
Educational Junior middle Senior middle Vocational Junior Bachelor Postgraduate
level school school college college
Negative 0.0422 0.0238 0.0080 0.0020 0.0005 0.0001
Normal 0.2289 0.5759 0.8613 0.9660 0.9924 0.9983
Positive 0.7289 0.4003 0.1307 0.0320 0.0072 0.0016
It can be seen from Table 7 that learners of different educational levels have different probabilities of learning state at the beginning of their study. Junior middle school learners have a probability of 0.7289 and they have a very positive attitude towards learning. With the improvement of learners’ educational level, the probability value of learners’ negative state decreases gradually, and the probability value of learners’ normal state increases gradually. Especially, the normal state probability value of learners with bachelor or above is close to 1. Because of the popularity of general courses of culture and custom on this platform, the basic knowledge requirement for learning these courses is not high. Even the learners with lower educational background have strong self-confidence to complete their studies. Some learners with higher educational background often choose courses with stronger professional knowledge for the needs of their work. Relatively speaking, on this platform, the main learners are still learners who learn from the knowledge required for their work. In addition, according to the theory of habitual domain, the learners with higher knowledge level are in a relatively stable habitual domain, the expected benefits of curriculum learning are lower, the entry and absorption of new information will be more hindered, and their enthusiasm for learning will be weaker than those with lower education level, but the possibility of negative attitude is very low.
4.3. Learning State Transfer
of different MOOCs can be getted when the current period is in a negative, normal and positive state. And the negative state is taken as an example in the current period, and the negative state is maintained in the next period. The probability distribution function of
St+1=1, transition to the normal stateSt+1=2 and transition to the active stateSt+1=3 is
shown as follows.
P(St+1= 1|St= 1) =
1
1 + exp (I1) + exp (I2)
(5)
P(St+1= 2|St= 1) =
exp (I1)
1 + exp (I1) + exp (I2)
(6)
P(St+1= 3|St= 1) =
exp (I2)
1 + exp (I1) + exp (I2)
(7)
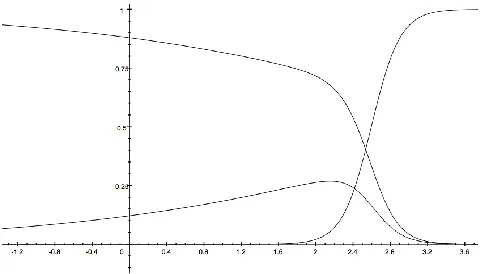
where,I1=-16.76+6.16X1+1.44X2+2.21X3,X2=-1.98+0.49X1+0.67X2+0.01X3. When there is no activity on the learning platform, that is, when the variables are 0, the prob-ability that the next learner stays in the negative state is close to 1. Without the external influence, the learner’s state will not directly change from the passive state to the positive state. Through derivation analysis of independent variables, the influence of each variable on state transition is analyzed. The probability of learners remaining in a negative state is negative for each variable, and the derivative of course scores is almost 0. The most obvi-ous effect of other learners’ course scores on state transition is that of course scores. And then we mainly analyze the influence of other learners’course scores on state transition, and fix the value of other variables to 0. The probability that learners move from negative state to other states varies with other learner course scores is shown in Fig. 4.
Fig. 4.The influence of other learner course scores on transition probability
learner is in a negative state, the probability of keeping the state unchanged is very high. If the other learners on the platform complete the course better, the possibility of the learner in a negative state will be reduced, and the probability of turning to a positive state or a better state will be increased. When the scores of other learners are still at a low level, the improvement of learners’state in a negative state will be relatively small, but with the improvement of the overall learning state, the learner’s learning state will gradually im-prove significantly, and finally the learner will transfer to a stable state with a probability of close to 1. In general, the overall learning status on the platform will have a significant effect on learners. That is to say, the heterogeneity in the learning environment promotes the learning attitude. When the learning effect of other people exceeds a certain value, the heterogeneity of the learner in the negative state is more obvious, and the learner in the negative state will be more actively close to excellent learners, the probability of learners improving their learning status will be significantly improved.
According to ARCS (2010) theory [8] and emotion regulation theory, good comple-tion of other learners will enable learners to increase their confidence in curriculum learn-ing, and increase their self-efficacy through mutual attention, and effectively improve negative learning emotions [2]. However, when other learners score far better than them-selves, learners’ state improvement will have certain limitations. At this time, learners with negative state have less similarities with learners with better curriculum completion, and it is not easy for them to establish a closer relationship. Therefore, learners with sim-ilar positive knowledge level should be organized to motivate negative learners to learn, so that negative learners can easily accept help, and change their state by communicating with each other.
It can also be seen from Fig. 4 that with the improvement of objective environment level, learners in a negative state are more likely to increase their interest in learning, and The course scores and the total number of learners have a more stable positive impact on the learners’ transition from negative to positive. When other learners’ scores are less than 1.76, the influence of course scores on improving the negative state will be weaker than that of the total number of learners. On the contrary, if other learners’ scores are higher than 1.76, their influence will be significantly improved. When the score reaches 1.8, the probability of turning to the stable state is the highest. It also shows that the learner’s learning state is a process of gradual improvement, and the probability of direct improve-ment is relatively small. By improving the environimprove-ment, it can significantly encourage learners to improve their learning status.
The current period is in a normal state, and the probability of moving to a negative state, maintaining a normal state, or shifting to a positive state in the next period is show as follows:
P(St+1 = 1|St= 2) =
1
1 + exp (J1) + exp (J2)
(8)
P(St+1 = 2|St= 2) =
1 + exp (J1)
1 + exp (J1) + exp (J2)
(9)
P(St+1 = 3|St= 2) =
exp (J2)
1 + exp (J1) + exp (J2)
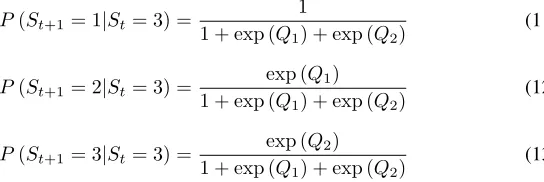
where, J1=1.65+0.02X1+0.33X2-0.05X3,J2=-1.49+0.46X1+0.46X2+0.67X3, and the current period is in a positive state, and the probability of moving to a negative state or a normal state, or keeping in a positive state in the next period is show as follows:
P(St+1= 1|St= 3) =
1
1 + exp (Q1) + exp (Q2)
(11)
P(St+1= 2|St= 3) =
exp (Q1)
1 + exp (Q1) + exp (Q2)
(12)
P(St+1= 3|St= 3) =
exp (Q2)
1 + exp (Q1) + exp (Q2)
(13)
where,Q1=12.30+0.16X1+0.22X2-0.28X3,Q2=13.77+0.53X1+0.12X2-0.39X3. Simi-larly, for the situation of normal state and positive state, the probabilistic transfer function expression is used for derivative analysis. The above three cases are summarized as shown in Table 8. The three coincidences in parentheses indicate the positive or negative effects of three learning environment factors on state transition, the order of the three variables is course scores of other learner, the total number of student of courses, the average score of the courses. The∗in the upper right corner represents the variable that has the greatest impact on the probability transition, and the + or - sign indicates a positive or negative impact on the state transition probability.
Table 8.The impact of each variable in the state transition
t Negative Normal Positive
t+1 state state state
Negative state (-∗- -) (+∗+ +) (+ +∗+) Normal state (- - -∗) (- + -∗) (+ + +∗) Positive state (- - -) (- +∗+) (+∗- -) (Course scores of other learner, Total number, Average scores)
When the learner is in a negative state, the scores of other learners’ learning scores have a significant effect on the improvement of the learning state. At this time, the learning state of other student has a greater influence on the learner in a negative state, which is easy for the learner to enhance their confidence and adopt a positive solution to turn pressure into motivation. It is explained that the MOOCs learning platform can effectively promote the learner in a negative state to improve the learning state and increase the investment in learning by improving the overall learning environment.
teaching resources. In addition, Moore’s theory provides that different stages of learning form their own views through interactive exchanges, and in the third stage, other people’s understanding of the knowledge is incorporated into their own knowledge system, and in the fourth stage, information is shared, so as to gradually realize the steady dissemination of knowledge [20]. Therefore, when the learner is in a normal state of active learning, the increase of student will promote the learner in the course discussion and learning activ-ities, which will increase the possibility of the learner to improve the learning state and effectively prevent the learner’s state sliding down.
When the learner is already in a positive learning state, the scores of other learners’ completion of the course has a significant impact on the learner’s positive state. According to the theory of confidence and satisfaction in ARCS, when the surrounding students complete well, it will encourage learners to increase the confidence of the completion of the course and the satisfaction of knowledge acquisition. At the same time, the learners in a positive state will be more actively involved in learning because of the competitive mentality, which will help the learners to maintain the current state of active learning.
5.
Discussion and Conclusions
Hidden Markov Model was used as the theoretical framework in our study, and the hidden state refers to the learner’s learning state. The observation sequence is the learner’s course completion score and the activity participation. According to our study, the learner’s knowledge level will have an impact on the initial learning state, and the learner’s learn-ing status will be affected by the environmental factors of the MOOCs. Therefore, the learners’ basic knowledge level, learning behavior and the learning environment of the course-mourning platform are correlated and modeled. In addition, the behavioral theory is applied to explain the influence of the learning behavior characteristics under different learning conditions, the total number of course learning, the learner’s course completion score, and the course score on the learner’s learning state transition.
From the results of the research, the overall activity participation on the MOOCs plat-form is low, but the active learners are more likely to actively participate in the activity and the course completion score is higher. When learners are in different states, the in-fluence of objective environment on learners’motivation is different, and the motivation factors are also different. When the learner is in a negative state, the change of the objec-tive environment will have a significant impact on the improvement of the learner’s state; when the learner is in a positive state, the influence of the learning environment on the learning state is not very great, and the completion of other learners’ courses can help learners to stay in a positive state, but the course score and the total number of students may cause the learner’s state to decline slightly; when the learner is in a normal state, the MOOCs environment has the least impact on the learning state, and the course score is the most significant effective in promoting the learner’s state.
In general, according to the research results of the learner’s state, the improvement of MOOCs teaching can be carried out from the following aspects.
4.8 can be recommended. In addition, according to the statistical results, the number of students studying in-house courses increased from July to September. During this period, courses suitable for students can be added, such as knowledge development with school associations, Graduate Development Planning and other courses.
(2) Encourage collaborative learning. According to the research results, when the learner is in a negative learning state, the increase in the number of learners can help the learner to improve his or her state significantly. Therefore, arranging positive and negative learners to study together can help negative learners increase their interest in learning, and help those negative learners improve their learning effect.
(3) Standardized management of learner behavior. For example, we can take measures such as the sign-in system or improve the learner evaluation mechanism to supervise the learner’s learning activities. Through regular testing of learners, we not only record their course completion and participation, but also track their learning status in order to promptly remind learners with poor learning and take measures to stimulate their active learning.
From the perspective of the development of MOOCs, personalized teaching based on learner’s status will become the trend of MOOCs teaching. In future research, artificial intelligence, big data analysis and other technical methods can be used to analyze learning behavior data and learner status, so as to provide help for personalized teaching.
Acknowledgements. This work was supported in part by Shanghai Higher Education Society under Grant (No. GJEL1851), Shanghai Philosophy and Social Sciences Plan (No.2016BGL004, No.2018BGL023), Shanghai Open Distance Education Engineering Technology Research Center (KFKT1701). Yonghui Dai is the corresponding author. Many thanks to Dr. Guowei Li for his assistance to Haijian Chen and Yonghui Dai who are the joint first authors of this paper.
References
1. Baum, L.E., Eagon, J.A.: An inequality with applications to statistical estimation for proba-bilistic functions of markov processes and to a model for ecology. Bulletin of the American Mathematical Society 73(3), 360–363 (1967)
2. Chen, H.J., Dai, Y.H., Feng, Y.J., Jiang, B., Xiao, J., You, B.: Construction of affective ed-ucation in mobile learning: The study based on learner’s interest and emotion recognition. Computer Science and Information Systems 14(3), 685–702 (2016)
3. Dixson, M.D.: Engaging the online learner: Activities and resources for creative instruction. Journal of Scholarship of Teaching & Learning 11(3), 120–121 (2012)
4. Guo, L.W. (ed.): Research on Dynamic Customer Relationship Management Based on Hidden Markov Model. Harbin Industrial University (2013)
5. He, J.M., Li, X.: A hidden markov model research in the microblog public opinion evolutionary analysis. Information Science 34(4), 7–12 (2016)
6. Honsel, V., Herbold, S., Grabowski, J.: Hidden markov models for the prediction of developer involvement dynamics and workload. In: International Conference on Predictive MODELS and Data Analytics in Software Engineering. pp. 1–10 (2016)
7. Hu, S.L. (ed.): Hidden Markov Model and Its Application in Finance. Huazhong Normal Uni-versity Press (2014)
9. Li, X.P., Guo, J.W.: Research on the correlation between learning attitude and learning behav-ior. Psychological and Behavioral Research 3(4), 265–267 (2005)
10. Liu, S.N.Y., Liu, Z., Gao, J., Sun, J.W.: Analysis of the differences of learners‘ learning behav-ior in the environment of mooc. Research on Electro-Education (10), 57–63, 69 (2016) 11. Pang, S.L., He, Y.Z., Wang, S.Y., Jiang, H.: Multilayer crossing credit scoring models for
en-terprise and application based on risk environment. Journal of management sciences in China 20(10), 57–69 (2017)
12. Pu, J.C. (ed.): Microblog user interest modeling and its dynamic research. Harbin Industrial University (2014)
13. Qiao, X.J., Wang, Z.L., Wang, W.S.: Emotional modeling of e-learning system based on occ model. Computer Science (05), 214–218 (2010)
14. Shen, C., He, X.: Research on the influence of college students’ group learning behavior on learning achievements. Journal of Nanjing University of Posts and Telecommunications (Social Sciences Edition) (01), 106–112 (2014)
15. Sivapalan, S., Cregan, P.: Value of online resources for learning by distance education. Inter-national Journal of Innovation in Science and Mathematics Education (formerly CAL-laborate International) 24(3), 414–429 (2012)
16. Venkatesh, V.: Determinants of perceived ease of use: Integrating control, intrinsic motivation, and emotion into the technology acceptance model. Information Systems Research 11(4), 342– 365 (2000)
17. Wang, J.D., Feng, Y.Y., Wang, W.: Cold thinking behind mooc heat. Educational Research (09), 104–111 (2014)
18. Wang, W.S., Gong, W.: Research on emotional cognition personalized student model in e-learning. Application Research of Computers (11), 4174–4176, 4183 (2011)
19. Wang, Y.S.: An empirical study of college students‘ learning input-based on data analysis of 2012 national college students‘ learning survey. China Higher Education Research (01), 32–36 (2013)
20. Wilson, J.M., Goodman, P.S., Cronin, M.A.: Group learning. Academy of Management Review 32(4), 1041–1059 (2007)
21. Yamato, J., Ohya, J., Ishii, K.: Recognizing human action in time-sequential images using hid-den markov model. Transactions of the Institute of Electronics Information & Communication Engineers 76(9), 379–385 (1993)
22. Yao, C.Z., Mi, J.R., Wang, H.C.: A review of research on ”learning behavior” at home and abroad. Teaching and Management (10), 48–50 (2009)
23. Yu, H.T., Cui, R.F., D, Q.Q.: Microblog user interest model based on forgetting curve, computer engineering and design. Computer Engineering and Design 35(10), 3367–3372, 3379 (2014)
Haijian Chenis an associate professor at the Shanghai Engineering Research Center of Open Distance Education, Shanghai Open University, China. He received his Ph.D. in Management Science and Engineering from Shanghai University of Finance and Eco-nomics, China in 2015. His current research interests include Educational technology and cloud computing. Contact him at [email protected].
Heyu Gaoreceived her Master at the School of Information Management and Engineer-ing, Shanghai University of Finance and Economics, China in 2016. Her research interests include Data mining. Contact her at [email protected].
Dongmei Han is a full Professor and Doctoral Advisor at the School of Information Management and Engineering, Shanghai University of Finance and Economics, China. She received her Ph.D. in 2002 from Quantitative Economics in Jilin University, China. Currently, her research interests include finance engineering, management science and Engineering. Contact her at [email protected].
Shan Lireceived her Master at the Management School, Shanghai University of Inter-national Business and Economics, China in 2019. Her current research interests include Network behavior analysis. Contact her at [email protected].