How Much Topological Structure Is Preserved
by Graph Embeddings?
?Xin Liu1, Chenyi Zhuang1, Tsuyoshi Murata2, Kyoung-Sook Kim1, and Natthawut Kertkeidkachorn1
1
Artificial Intelligence Research Center
National Institute of Advanced Industrial Science and Technology AIST Waterfront ANNEX, 2-4-7 Aomi, Koto-ku, Tokyo 135-0064 Japan
{xin.liu, zhuang.chenyi, ks.kim, n.kertkeidkachorn}@aist.go.jp 2
Department of Computer Science Tokyo Institute of Technology
2-12-1 Ookayama, Meguro-ku, Tokyo 152-8552 Japan [email protected]
Abstract. Graph embedding aims at learning representations of nodes in a low di-mensional vector space. Good embeddings should preserve the graph topological structure. To study how much such structure can be preserved, we propose eval-uation methods from four aspects: 1) How well the graph can be reconstructed based on the embeddings, 2) The divergence of the original link distribution and the embedding-derived distribution, 3) The consistency of communities discovered from the graph and embeddings, and 4) To what extent we can employ embeddings to facilitate link prediction. We find that it is insufficient to rely on the embeddings to reconstruct the original graph, to discover communities, and to predict links at a high precision. Thus, the embeddings by the state-of-the-art approaches can only preserve part of the topological structure.
Keywords:graph embedding, network representation learning, graph reconstruc-tion, dimension reducreconstruc-tion, graph mining.
1.
Introduction
Graphs (also known as networks) are used in many branches of science as a way to rep-resent the patterns of connections between the components of complex systems [48]. Re-cently, there has been a surge of interest ingraph embeddingthat learns low-dimensional vector representations, orembeddings, for nodes to encode their structural information in the original graph [23,3,20,75]. After the embeddings are learned, graph analysis can be easily and efficiently carried out by applying off-the-shelf vector-based machine learning algorithms [59,58,68,6,78,21,56].
It is believed that the topological structure information should, to some extent, be preserved by the embeddings that are obtained by the state-of-the-art approaches. But how well is it preserved? This question is not yet investigated and this paper intends to answer them. In this paper, we propose four evaluation methods to evaluate the amount of information preserved by the embeddings. First, we investigate how well the graph
v
iv
jOriginal Graph Embedding Space
e
ie
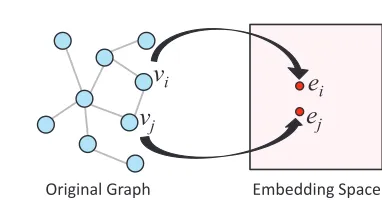
jFig. 1.An illustration of graph embedding.
can be reconstructed by the embeddings. Secondly, we study the divergence between the link distribution in the graph and the distribution derived from the embeddings. Thirdly, we focus on the difference between the communities discovered from the graph and the embeddings. Finally, we examine the effectiveness of embeddings for facilitating link prediction. We found that the current graph embedding approaches can only preserve part of the topological structure. It is insufficient to rely on the embeddings to reconstruct the original graph, to discover communities, and to predict links at a high precision.
The rest of the paper is organized as follows. Section 2 presents the definition of graph embedding. Section 3 proposes our methods in detail. Section 4 reports the experiment re-sults for different graph embedding techniques based on the proposed evaluation methods. Section 5 surveys related work. Finally, Section 6 gives our conclusion.
2.
Preliminaries and Definition of Graph Embedding
This section gives definitions of graph embedding. We begin with the symbols that will be used. Let us consider a simple graphG= (V,E), whereV={vi|i= 1,· · · , n}is the node set, andE ⊆ V × Vis the edge set. We simply suppose the edge weight is uniformly 1. The adjacency matrix ofGis denoted asA, with elements
Aij = (
1 if(vi, vj)∈ E;
0 otherwise. (1)
ki=P n
j=1Aijis the degree ofvi.
Definition: Given a graphG= (V,E), graph embedding is a mappingφ:vi7→ei ∈
Rd for ∀i = 1, . . . , n, such that d nand the embeddings maximally preserve the
structure of graph.
The most basic structure that should be preserved is the topological structure. That is, if there is a link betweenviandvj, the corresponding embeddingseiandej should be close to each other in the low dimension vector space, as shown in Figure 1.
3.
Evaluating How Much Structure Are Preserved
Embedding Space
Reconstruct Similarity
Reconstructed Graph G’ Original Graph G
e
ie
j
e
kv
iv
jv
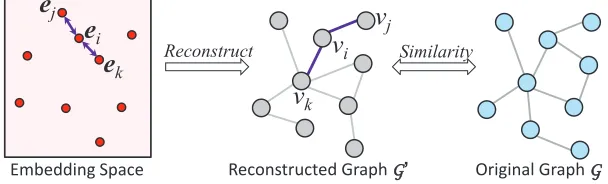
kFig. 2.The two steps for the graph similarity based evaluation.
reconstruction based on the embeddings, 2) the divergence of the original link distribution and the embedding-derived distribution, 3) the consistency of communities discovered from the graph and embeddings, and 4) link prediction based on the embeddings. We will present them in the following.
3.1. Graph Reconstruction based on Embeddings
To evaluate how much topological structure information is preserved by the embeddings, we can use the embeddings to reconstruct a graph and examine the difference between the reconstructed graph and the original one. Following this idea, we propose an evaluation method based on the similarity of the two graphs. Our method contains two steps as illustrated in Figure 2. The first step is reconstructing the graph based on the embedding. The second step is calculating the similarity between the reconstructed graph and the original graph.
Reconstructing the Graph Given the embeddings{ei | i = 1,· · ·, n}, the similarity function for a pair of embeddings SIM(ei,ej) : (ei,ej) → R, and the node degree
sequence{ki | i = 1,· · ·, n}of the original graph, we take the following procedure to obtain the reconstructed graphG0.
1. G0keeps the same node set{v
i|i= 1,· · ·, n}asG.
2. For eachviwhose degree iskiinG, createkilinks connectingviand the nodes whose corresponding embeddings are among thekimost similar embeddings toei, with the weight of each link equal to 0.5.
SIM(ei,ej) quantifies the similarity of ei andej in the embedding space, and is dependent on the approach for generating the embeddings. For example, if an approach expresses the similarity by dot product, the similarity function would be based on dot product.
Note that for each created link we attach a weight of 0.5. This is because the link creation is a mutual process, i.e., forviwe create a link tovj, and forvjwe may create another link tovi. As a result,G0keeps the same number of weights asG.
Also note thatG0can be exactly the same asGunder the condition that for each node
Evaluating the Graph Similarity Good embeddings that well preserve the topological structure will result in that the reconstructed graphG0 is similar to the original graphG.
Thus, we can evaluate the amount of preserved information by calculating the similarity betweenG andG0. Specifically, we use DELTACON[32,31] as a metric to measure the
similarity. DELTACONis scalable to large graphs and obeys the following axioms – Identity Property: DELTACON(G,G0) = 1iffG=G0.
– Symmetric Property: DELTACON(G,G0) =DELTACON(G0,G).
– Zero Property: DELTACON(G,G0)→0forn→ ∞, whereGis the complete graph,
andG0is the empty graph (i.e., the edge sets are complementary).
DELTACONessentially measures the differences in the corresponding node’s affinity ofG andG0, and thus it is based on global structure of the graphs. Specifically, the
cal-culation of DELTACON(G,G0)contains three steps. First, we calculate the node affinity
matricesSandS0forGandG0, respectively. The node affinity matrixScan be expressed
as
S= (I+2D−A)−1, (2)
whereis a positive constant encoding the influence between neighbors inG, andDis the degree diagonal matrix, with elements
Dij = (
ki ifi=j;
0 otherwise. (3)
The element Sij indicate the affinity (influence) of node vi to vj in G. Similarly, we calculate the node affinity matrixS0 for G0. Secondly, we calculate the root Euclidean
distance betweenSandS0.
ROOTED(S,S0) = s
X i,j
(Sij−Sij0 )2 (4)
Finally, we have
DELTACON(G,G0) = 1
1 +ROOTED(S,S0). (5)
DELTACON(G,G0)∈[0,1]. On the one extreme, a score of 0 implies thatG0is totally
irrelevant ofG, implying that none of the topological structure information is preserved in the embeddings. On the other extreme, a score of 1 indicates thatG0is a perfect
reconstruc-tion ofG, implying that the topological structure are100%preserved in the embeddings. Intermediate scores suggest situations in between the two extremes.
The graph reconstruction procedure requires a quadratic time complexity, since we need to calculate SIM(ei,ej)for each pair of embeddings. Given the original graph and the reconstructed graph, the calculation of DELTACON(G,G0) needs another quadratic
3.2. Divergence of the Original and Embedding-Derived Link Distributions
Our second method is to evaluate the KL Divergence between the link distribution derived from the embeddings and the empirical distribution observed from the original graph. Given the embeddings{ei|i= 1,· · ·, n}and their similarity function SIM(ei,ej), we can define a link distribution
Pe(vi, vj)∝
1
1 +exp(−SIM(ei,ej))
. (6)
The idea is that the more similareiandej are, the more likely a link will exist between
vi andvj. This is the link distribution derived from the embeddings. On the other hand, the empirical link distribution observed from the original graph is
Pg(vi, vj) =
Aij P
i<jAij
. (7)
Pe and Pg are distributions defined over the space V × V. We can employ the KL-divergence [33]
KL(Pe, Pg) =−X
vi,vj
Pe(vi, vj)logPg(vi, vj) + X vi,vj
Pe(vi, vj)logPe(vi, vj) (8)
to measure the distance between the two distributions.KL(Pe, Pg)approaching 0 indi-cates that the topological structure are well preserved in the embeddings.
Note that the calculation ofPg needs a linear time complexity, while the the calcu-lation of Pe needs a quadric time complexity. As a result, the total complexity for this evaluation method isO(n2).
3.3. Consistency of Communities Discovered from the Graph and Embeddings
Good embeddings should also preserve the mesoscopic graph structure, i.e., the commu-nity structure (clusters). Therefore, the third method for evaluating how well the topolog-ical structure is preserved is to measure the consistency of communities discovered from the original graph and from embeddings. Specifically, we employ the Louvain algorithm [1] and the K-Means algorithm [42] to discover the communities from the graph and em-beddings, respectively3. Then, we estimate the consistency of the communities based on the Normalized Mutual Information (NMI) [17,12] and Adjusted Rand Index (ARI) [27].
SupposeΩgandΩeare community partitions for the graph and embeddings (node/embedding community label assignments). NMI is an information theoretic measure that calculates the amount of common information between two partitions:
NMI(Ωg, Ωe) =
−2 cg
P i=1
ce
P j=1
ngeijlog(ngeijn/ngine j)
cg
P i=1
ngilog(ngi/n) + ce
P j=1
ne
jlog(nej/n),
(9)
wherecg is number of communities inΩg,ceis number of communities inΩe,nis the total number of nodes,ngi is the number of nodes in thei-th community ofΩg,ne
jis the number of nodes in thej-th community ofΩe, andngeij is the number of nodes that are both in thei-th community ofΩg and thej-th community ofΩe. IfΩgandΩematch completely, we have a maximum NMI value of 1.0, whereas ifΩg andΩe are totally independent of one another, we have a minimum NMI value of 0.0.
On the other hand, ARI computes a similarity by considering all pairs of samples and counting pairs that are assigned in the same or different communities inΩgandΩe. The mathematical definition of ARI is
ARI(Ωg, Ωe) = cg P i=1 ce P j=1
ngeij 2 − " cg P i=1
ngi 2 c e P j=1 ne j 2 # / n2
1 2 " cg P i=1
ngi 2 c e P j=1 ne j 2 # − " cg P i=1
ngi 2 c e P j=1 ne j 2 # / n2
. (10)
The ARI has the maximum value 1 whenΩg andΩe agree perfectly, and its expected value is 0 in the case thatΩgandΩeare totally independent of one another. A larger ARI means a higher agreement betweenΩgandΩe.
The Louvain algorithm has time complexity ofO(nlogn), while the K-Means al-gorithm has time complexity of O(ncedl), where l is the number of iterations for the algorithm to converge. Moreover, the calculation of NMI and ARI has time complexity
O(n2max(cg, ce))in the worst case. Note thatcg, ce, d, lnand thus can be ignored. Consequently, the total complexity for this evaluation method isO(n2).
3.4. Link Prediction Based on Embeddings
Finally, we evaluate the effectiveness of the embeddings for facilitating link prediction. This is based on the following idea: Suppose embeddings can well preserve the graph topological structure; If we remove a small amount of the topology information of the original graph, the resulting embeddings should still keep the main structure of the graph somehow; Therefore, we can use the embedding to facilitate the recovery of some of the removed information, i.e., link prediction.
Specifically, given a graphGwe remove 10%of the links and obtainG0. We test how
the embeddings learned fromG0 can help predict the removed links. Suppose we focus
onvi, and(vi, vj)is a removed link that we aim to predict. Also note that SIM(ei,ek) is the score for predicting(vi, vk)for∀vk. Then, given the query(vi, vj), we can rank
vj against all other nodes4based on the scores. A high rank forvjindicates that we are able to predict(vi, vj)in a positive sense. Finally, we evaluate the performance for all the queries based on Mean Reciprocal Rank (MRR) [53] and HITS@K:
4We filter out the nodesv
MRR= 1
|Q|
|Q|
X t=1
1
Rankt (11)
HITS@K= 1
|Q|
|Q|
X t=1
Hitst (12)
Hitst= (
1 if Rankt≤K;
0 otherwise. (13)
whereQis the set of queries, Ranktrefers to the rank position ofvj for thet-th query (vi, vj). MRR∈ (0,1]and HITS@K∈[0,1]. A maximum value of 1.0 implies we can predict all the links perfectly.
For a query(vi, vj), the procedure for rankingvj against all other nodes requires a time complexity ofO(n). Therefore, the total complexity for this evaluation method is
O(|Q|n).
4.
Experiment
In this section, we show the results based on the proposed evaluation methods. We con-sider the following graph embedding approaches that represent the state-of-the-art.
– GraRep (GRep) [4]: This approach defines a loss function by integrating the transition probabilities. Minimizing this loss function has proven to be equivalent to factorizing a matrix that is related to the k-step transition probability matrix. For eachk the factorization produces a sub-embedding. Then it concatenates sub-embeddings on differentkas the final embedding solution.
– HOPE [50]: This approach learns embeddings by factorizing the Katz similarity [29] matrix. It uses generalized Singular Value Decomposition algorithm to obtain the embeddings efficiently.
– DeepWalk (DW) [51]: This approach first transforms a graph into a collection of linear sequences of nodes using multiple random walks. It then learns embeddings by applying the Skip-Gram model [46,47], originating from natural language processing, to the node sequence.
– Node2Vec (N2V) [21]: This approach is a variant of DeepWalk. It also samples node sequences and feed them to the Skip-Gram model. Instead of DeepWalk’s random search sampling strategy, Node2Vec uses 2nd-order random walks that can bias to-wards a particular search strategy.
– LINE [57]: This approach learnsd-dimensional embeddings in two separate phases. In the first phase, it learnsd/2dimensions by BFS-style simulations over immediate neighbors of nodes. In the second phase, it learns the nextd/2dimensions by sam-pling nodes strictly at a 2-hop distance from the source nodes. Finally, it concatenates the embeddings learned at the two phases.
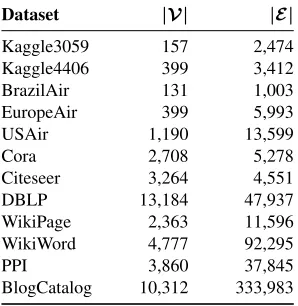
Table 1.Statistics of the datasets: number of nodes|V|; number of edges|E|.
Dataset |V| |E|
Kaggle3059 157 2,474
Kaggle4406 399 3,412
BrazilAir 131 1,003
EuropeAir 399 5,993
USAir 1,190 13,599
Cora 2,708 5,278
Citeseer 3,264 4,551
DBLP 13,184 47,937
WikiPage 2,363 11,596 WikiWord 4,777 92,295
PPI 3,860 37,845
BlogCatalog 10,312 333,983
According to the mechanism of these approaches, the embeddings’ similarity fuction can be uniformly expressed as
SIM(ei,ej) =e>iej. (14) In addition, we consider randomly generated embeddings as a baseline. We do not include approaches for supervised graph embedding because they require additional in-formation such as node labels for training [74,61,63,30].
We set the embedding dimension as 120 for all approaches. Moreover, the parameter settings for these approaches are the same as the original literature. Specifically, for Deep-Walk and Node2Vec, we set the window size to 10, the walk length to 80, and the number of walks per node to 10. For HOPE and GRA, we set the decay rate to 0.95 divided by the spectral radius ofAandAD−1, respectively. For LINE, we set the number of negative samples to 5. For GraRep, we set the maximum transition step to 6. Lastly, for Node2Vec, we obtain the best in-out and return hyperparameters based on a grid search over{0.25, 0.50, 1, 2, 4}.
We use a variety of real-world graphs from various domains as the testing datasets. A brief description of them follows.
– Kaggle3059 [8]5, Kaggle4406 [8]3: Graphs representing the friendship of Facebook users.
– BrazilAir [55]6, EuropeAir [55]7, USAir [55]8: Graphs representing the air traffics in Brazil, Europe, and the USA, respectively. Nodes correspond to airports and edges denote the existence of commercial flights.
– Cora [72]9, Citeseer [30]7, DBLP [56]10: Graphs representing the citation relationship of scientific papers.
5https://www.kaggle.com/c/learning-social-circles/data 6http://www.anac.gov.br/
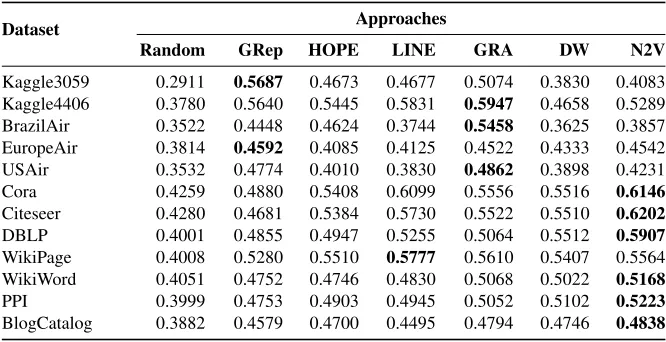
Table 2.DELTACONscores for different approaches (the higher the better).
Dataset Approaches
Random GRep HOPE LINE GRA DW N2V
Kaggle3059 0.2911 0.5687 0.4673 0.4677 0.5074 0.3830 0.4083 Kaggle4406 0.3780 0.5640 0.5445 0.5831 0.5947 0.4658 0.5289 BrazilAir 0.3522 0.4448 0.4624 0.3744 0.5458 0.3625 0.3857 EuropeAir 0.3814 0.4592 0.4085 0.4125 0.4522 0.4333 0.4542 USAir 0.3532 0.4774 0.4010 0.3830 0.4862 0.3898 0.4231 Cora 0.4259 0.4880 0.5408 0.6099 0.5556 0.5516 0.6146 Citeseer 0.4280 0.4681 0.5384 0.5730 0.5522 0.5510 0.6202 DBLP 0.4001 0.4855 0.4947 0.5255 0.5064 0.5512 0.5907 WikiPage 0.4008 0.5280 0.5510 0.5777 0.5610 0.5407 0.5564 WikiWord 0.4051 0.4752 0.4746 0.4830 0.5068 0.5022 0.5168 PPI 0.3999 0.4753 0.4903 0.4945 0.5052 0.5102 0.5223 BlogCatalog 0.3882 0.4579 0.4700 0.4495 0.4794 0.4746 0.4838
Table 3.KL-divergence scores for different approaches (the lower the better).
Dataset Approaches
Random GRep HOPE LINE GRA DW N2V
Kaggle3059 1.6519 1.2567 1.5330 1.5347 1.5068 1.5229 1.5170 Kaggle4406 3.2092 2.6315 3.0915 3.0773 2.9063 3.0967 3.1023 BrazilAir 2.2033 1.9945 2.0438 2.0890 2.1268 2.1258 2.1119 EuropeAir 2.6476 2.4191 2.5451 2.5748 2.5616 2.5327 2.5126 USAir 4.0158 3.5418 3.9185 3.9315 3.8230 3.8590 3.8406 Cora 6.6088 5.9681 6.5171 6.5020 6.2449 6.5199 6.5378 Citeseer 7.1230 6.5599 7.0393 6.9926 6.7138 7.0588 7.0621 DBLP 7.5638 6.9417 7.4929 7.5001 7.2152 7.4774 7.4936 WikiPage 5.5452 4.9841 5.4620 5.4642 5.3207 5.3809 5.4388 WikiWord 4.9990 4.6942 4.8085 4.8823 4.8139 4.7442 4.7234 PPI 5.3436 4.9735 5.2719 5.2673 5.2381 5.1422 5.1680 BlogCatalog 5.2800 4.8913 5.0656 5.0847 5.0431 5.0068 4.9814
– WikiPage [61]11: A graph of webpages in Wikipedia, with edges indicating
hyper-links.
– WikiWord [21]12: A co-occurrence graph of words appearing in Wikipedia.
– PPI [21]8: A protein-protein interaction graph for Homo Sapiens.
– BlogCatalog [58,8]13: A graph of social relationships of the bloggers listed on the
BlogCatalog website.
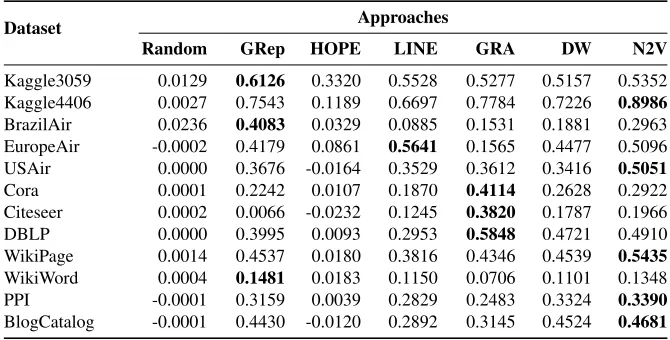
Table 1 summarizes the number of nodes and edges in each dataset. Table 2 lists the DELTACONfor graph reconstruction. Table 3 presents the KL-divergence of the original 11https://github.com/thunlp/MMDW/tree/master/data/
Table 4.NMI scores for different approaches (the higher the better).
Dataset Approaches
Random GRep HOPE LINE GRA DW N2V
Kaggle3059 0.0839 0.7595 0.5454 0.7190 0.7272 0.7585 0.7755 Kaggle4406 0.1397 0.8792 0.5422 0.8530 0.9014 0.8692 0.9452 BrazilAir 0.0713 0.4893 0.0992 0.1781 0.3097 0.3660 0.4626 EuropeAir 0.0165 0.5725 0.1471 0.7049 0.4602 0.6161 0.6632 USAir 0.0349 0.6077 0.2250 0.5974 0.6149 0.6055 0.6524 Cora 0.1919 0.6592 0.4280 0.6218 0.7452 0.7099 0.7229 Citeseer 0.5153 0.6108 0.4371 0.7721 0.8825 0.8192 0.8272 DBLP 0.0110 0.6315 0.2515 0.5581 0.7186 0.6819 0.7072 WikiPage 0.0270 0.6287 0.2488 0.5863 0.6163 0.6323 0.6827 WikiWord 0.0033 0.1833 0.0346 0.1676 0.0599 0.1661 0.1824 PPI 0.0091 0.4163 0.0866 0.3746 0.3528 0.4002 0.4275 BlogCatalog 0.0010 0.5220 0.0088 0.3697 0.3331 0.5221 0.5478
Table 5.ARI scores for different approaches (the higher the better).
Dataset Approaches
Random GRep HOPE LINE GRA DW N2V
Kaggle3059 0.0129 0.6126 0.3320 0.5528 0.5277 0.5157 0.5352 Kaggle4406 0.0027 0.7543 0.1189 0.6697 0.7784 0.7226 0.8986 BrazilAir 0.0236 0.4083 0.0329 0.0885 0.1531 0.1881 0.2963 EuropeAir -0.0002 0.4179 0.0861 0.5641 0.1565 0.4477 0.5096 USAir 0.0000 0.3676 -0.0164 0.3529 0.3612 0.3416 0.5051 Cora 0.0001 0.2242 0.0107 0.1870 0.4114 0.2628 0.2922 Citeseer 0.0002 0.0066 -0.0232 0.1245 0.3820 0.1787 0.1966 DBLP 0.0000 0.3995 0.0093 0.2953 0.5848 0.4721 0.4910 WikiPage 0.0014 0.4537 0.0180 0.3816 0.4346 0.4539 0.5435 WikiWord 0.0004 0.1481 0.0183 0.1150 0.0706 0.1101 0.1348 PPI -0.0001 0.3159 0.0039 0.2829 0.2483 0.3324 0.3390 BlogCatalog -0.0001 0.4430 -0.0120 0.2892 0.3145 0.4524 0.4681
and embedding-derived link distributions. Table 4 and Table 5 report the NMI and ARI for the consistency of the communities discovered from graph and embeddings. Table 6 and Table 7 reveal the MRR and HITS@K14 for link prediction based on embeddings.
Based on these results, we have the following observations.
– The DELTACONfor evaluating graph reconstruction reveals that GraRep and GRA are more successful in smaller graphs such as Kaggle3059, Kaggle4406, BrazilAir, EuropeAir, and USAir. On the other hand, Node2Vec outperforms the others in 6 larger graphs including Cora, Citeseer, DBLP, WikiWord, PPI, and BlogCatalog, but shows less success in the other graphs (especially in Kaggle3059 and BrazilAir). This
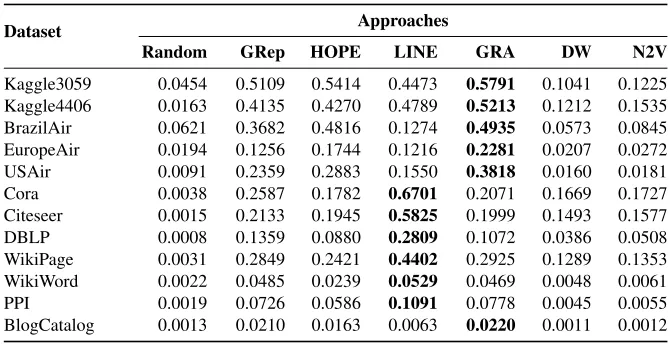
Table 6.MRR scores for different approaches (the higher the better).
Dataset Approaches
Random GRep HOPE LINE GRA DW N2V
Kaggle3059 0.0454 0.5109 0.5414 0.4473 0.5791 0.1041 0.1225 Kaggle4406 0.0163 0.4135 0.4270 0.4789 0.5213 0.1212 0.1535 BrazilAir 0.0621 0.3682 0.4816 0.1274 0.4935 0.0573 0.0845 EuropeAir 0.0194 0.1256 0.1744 0.1216 0.2281 0.0207 0.0272 USAir 0.0091 0.2359 0.2883 0.1550 0.3818 0.0160 0.0181 Cora 0.0038 0.2587 0.1782 0.6701 0.2071 0.1669 0.1727 Citeseer 0.0015 0.2133 0.1945 0.5825 0.1999 0.1493 0.1577 DBLP 0.0008 0.1359 0.0880 0.2809 0.1072 0.0386 0.0508 WikiPage 0.0031 0.2849 0.2421 0.4402 0.2925 0.1289 0.1353 WikiWord 0.0022 0.0485 0.0239 0.0529 0.0469 0.0048 0.0061 PPI 0.0019 0.0726 0.0586 0.1091 0.0778 0.0045 0.0055 BlogCatalog 0.0013 0.0210 0.0163 0.0063 0.0220 0.0011 0.0012
is because that Node2Vec uses two hyperparameters to control the search strategy and this enables it to learn long-term dependencies in larger graphs.
– The KL-divergence for evaluating the divergence of the original and embedding-derived link distribution suggests that GraRep demonstrates the best performance in all of the graphs. A main reason is that GraRep is adapt in separating the embeddings of dissimilar nodes, i.e., putting the embeddings of dissimilar nodes far away from each other. Eq. (6) indicates that in the derived link distribution there is a probability for each pair of nodes, while Eq. (7) implies that in the empirical link distribution only a few pairs of nodes have link probability. Therefore, properly separating the embeddings of dissimilar nodes will help achieve a better KL-divergence score. – The NMI for evaluating the consistency of the communities discovered from graph
and embeddings indicates that Node2Vec achieves good results in Kaggle3059, Kag-gle4406, USAir, Cora, Citeseer, WikiPage graphs. A common feature of these graph is that they are unconnected. This means that the graph is naturally separated into sev-eral communities, each representing a connected component. Therefore, the commu-nity partitions by graph and embeddings can easily reach a relatively high agreement for a unconnected graph, and contribute to the high NMI scores. On the other hand, the ARI scores are more strict on the exact partition of a large connected component into small communities. Hence, the ARI scores are much lower than NMI scores. For example, Node2Vec obtains NMI scores of 0.7229 and 0.8272 on Cora and Cite-seer graphs, while the corresponding ARI scores are as low as 0.2922 and 0.1966, respectively.
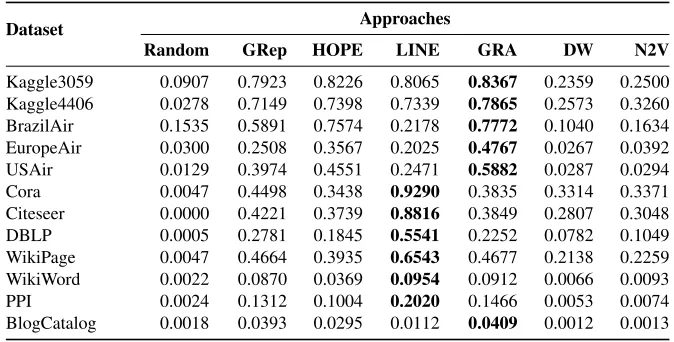
– The MRR and HITS@10 for evaluating the embedding-based link prediction indicate the similar performance patterns. LINE and GRA outperforms the other approaches by a large margin. For example, GRA achieves passable performance in Kaggle3059, Kaggle4406, and BrazilAir graphs, while LINE delivers an acceptable performance in Cora and Citeseer graphs.
Table 7.HITS@10 scores for different approaches (the higher the better).
Dataset Approaches
Random GRep HOPE LINE GRA DW N2V
Kaggle3059 0.0907 0.7923 0.8226 0.8065 0.8367 0.2359 0.2500 Kaggle4406 0.0278 0.7149 0.7398 0.7339 0.7865 0.2573 0.3260 BrazilAir 0.1535 0.5891 0.7574 0.2178 0.7772 0.1040 0.1634 EuropeAir 0.0300 0.2508 0.3567 0.2025 0.4767 0.0267 0.0392 USAir 0.0129 0.3974 0.4551 0.2471 0.5882 0.0287 0.0294 Cora 0.0047 0.4498 0.3438 0.9290 0.3835 0.3314 0.3371 Citeseer 0.0000 0.4221 0.3739 0.8816 0.3849 0.2807 0.3048 DBLP 0.0005 0.2781 0.1845 0.5541 0.2252 0.0782 0.1049 WikiPage 0.0047 0.4664 0.3935 0.6543 0.4677 0.2138 0.2259 WikiWord 0.0022 0.0870 0.0369 0.0954 0.0912 0.0066 0.0093 PPI 0.0024 0.1312 0.1004 0.2020 0.1466 0.0053 0.0074 BlogCatalog 0.0018 0.0393 0.0295 0.0112 0.0409 0.0012 0.0013
in another two graphs (BrazilAir and EuropeAir). Similarly, GRA dramatically out-performs the others for community discovery in graphs such as Cora, Citeseer, and DBLP. However, it is less successful in graphs such as BrazilAir and WikiWord. – The performances are also task-dependent. For example, GraRep consistently
outper-forms the others in all of the 12 graphs for KL-divergence scores, but it just puts in an average performance in the other three tasks. Similarly, Node2Vec demonstrates acceptable performance in graph reconstruction and community discovery, but it con-spicuously fails in link prediction.
– The DELTACON, KL-divergence, NMI, ARI, MRR, and HITS@10 scores all indicate that graph embedding approaches are significantly outperforms the randomly gener-ated embeddings. However, they are far from perfect. For example, the DELTACON scores mostly range between 0.4 and 0.6, but none of the approaches obtains scores closing to 1.0. NMI and ARI scores in graphs such as BrazilAir and WikiWord in-dicates that the embedding communities are quite different from graph communities. Moreover, the MRR and HITS@10 scores in large graphs such as WikiWord, PPI, and BlogCatalog imply that embeddings are not always trustworthy for link predic-tion. Therefore, the embeddings preserve only part of the topological structure of the graph. It is insufficient to rely on the embeddings to reconstruct the original graph, to discover communities, and to predict links at a high precision. This fact applies to ap-proaches such as HOPE and LINE that is originally designed to preserve high-order proximity of the graph. One important reason is because of the highly non-linear structure of the graph, which poses a great challenge.
5.
Related Work
unsuper-vised graph embedding [4,50,51,57,41,39], superunsuper-vised graph embedding [74,61,63,41,21,30], community preserving embedding [68,6,78,10], and embedding in graphs of various types, such as the bipartite graphs [19], the heterogeneous graphs [28,7,56,14,18,65,76], the multi-relational graphs [52,45], the signed graphs [9,67,65], the uncertain graphs [24], the incomplete graphs [73], the dynamic graphs [77,36,79,44], the scale-free graphs [15], the hyper-graphs [62], and the attributed graphs (accompanied with attribute information such as categories and texts on nodes or edges, or both) [71,67,36,60,25,26,37].
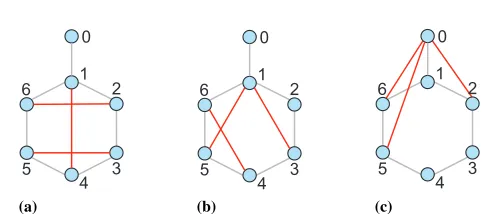
This paper studies the problem of how well the topological structure information is preserved by the embeddings. One relevant research are [50,63] that use the metric PRE-CISION@K for measuring the graph reconstruction precision. However, this metric is based on graph reconstruction at the local scale of each node and thus cannot give an trust-worthy evaluation. We give an explanation using the illustrations in Figure 3. Figure 3(a) shows a graph with the top node weakly connected to a cluster of 6 nodes. Figure 3(b) and Figure 3(c) are two reconstructed graphs of Figure 3(a). It is obvious that Figure 3(b) is a better reconstruction since the main structure of the original graph are kept. On the other hand, Figure 3(c) is a worse reconstruction, since the top node becomes a member of the cluster and the graph structure has been totally changed. However, the local metric PRE-CISION@K fails to discriminate the two examples. For example, let us look at node ’3’ and ’4’. The evaluation of these two nodes based on PRECISION@2 can be as high as 1.0 for Figure 3(c) while it is as low as 0.5 for Figure 3(b). On the other hand, the global met-ric DELTACONcan provide an unbiased evaluation of 0.6477 for Figure 3(b) and 0.5584 for Figure 3(c). Moreover, PRECISION@K is computationally expensive, especially for large graphs. To fasten the computation, we usually employ the sampling strategy, but it will cause a serious problem of unstable evaluation. To the best of our knowledge, we are the first to propose the evaluation for graph reconstruction at the global scale of graphs.
There are research on embedding-based link prediction. One line of such research focuses on the knowledge graphs, which can be viewed as a multi-relational graph com-posed of entities (nodes) and relations (different types of edges) [38,70,2,13,49]. Each edge is represented as a triple of the form (head entity, relation, tail entity). Link predic-tion in knowledge graph is typically referred to as the task of predicting an entity that has a specific relation with another given entity [66]. For example, (?, PresidentOf, USA) is to predict the president of USA. Another line centers on plain graphs, as the topic in this paper. The settings are also similar to what we have discussed in Section 3.4, i.e., to remove a small amount of the links and use the embeddings to predict the removed links [21,50]. The difference is that previous research overwhelmingly employ the Area Under the Curve (AUC) [16] as a metric for evaluation. AUC can be interpreted as the ex-pectation that a target link is predicted with a higher probability than a randomly chosen non-existent link. However, considering the sparse feature of graphs, there are dramati-cally larger number of non-existent links than the number of removed links. Consequently, AUC is not an unbiased metric for evaluation and it is much easy to achieve a high score based on it [43].
0
1 2
3 4 5 6
(a)
0
1 2
3 4 5 6
(b)
0
1 2
3 4 5 6
(c)
Fig. 3.Examples of graph reconstruction. (a) The original graph. (b) A reconstructed graph that has similar structure as the original one. (c) A reconstructed graph that has, to some extent, changed the structure of the original one. The red color emphasizes the difference between the three graphs.
6.
Conclusion
We studied how well the graph topological structure is preserved by the embeddings from four aspects: 1) graph reconstruction based on the embeddings, 2) the divergence of the original link distribution and the embedding-derived distribution, 3) the consistency of the communities discovered from graph and embeddings, and 4) link prediction based on the embeddings. We did experiments on 12 graphs for 6 state-of-the-art graph embedding approaches. We found that the embeddings by these approaches can only preserve part of the topological structure. It is insufficient to rely on the embeddings to reconstruct the original graph, to discover communities, and to predict links at a high precision. This suggests that although the current graph embedding techniques can benefit graph analysis tasks such as label classification, we still cannot employ them for applications such as graph compression.
Graph embedding is not perfectly solved and there is still some room for improvement. Most of the embedding approaches ignore the hubness phenomenon that results in the heavy-tail degree distribution [54]. How to effectively utilize the dimensionality of the embeddings to encode the heavy-tail degree distribution will be left for our future work.
On the other hand, the proposed evaluation methods could be a standard for studying the problem of graph reconstruction or graph compression based on the embeddings, and be a benchmark for graph embedding approaches.
Acknowledgments.This paper is based on results obtained from a project commissioned by the New Energy and Industrial Technology Development Organization (NEDO). We would like to thank JSPS Aid for Early-Career Scientists (Grant Number 19K20352), JSPS Grant-in-Aid for Scientific Research(B) (Grant Number 17H01785) and JST CREST (Grant Number JP-MJCR1687).
References
2. Bordes, A., Usunier, N., Garcia-Duran, A., Weston, J., Yakhnenko, O.: Translating embeddings for modeling multi-relational data. In: Proceedingss of NIPS. pp. 2787–2795 (2013)
3. Cai, H., Zheng, V.W., Chang, K.C.C.: A comprehensive survey of graph embedding: problems, techniques and applications. IEEE Transactions on Knowledge and Data Engineering 30(9), 1616–1637 (2018)
4. Cao, S., Lu, W., Xu, Q.: Grarep: Learning graph representations with global structural infor-mation. In: Proceedings of CIKM. pp. 891–900 (2015)
5. Cao, S., Lu, W., Xu, Q.: Deep neural networks for learning graph representations. In: Proceed-ings of AAAI. pp. 1145–1152 (2016)
6. Cavallari, S., Zheng, V.W., Cai, H., Chang, K.C., Cambria, E.: Learning community embedding with community detection and node embedding on graphs. In: Proceedings of CIKM. pp. 377– 386 (2017)
7. Chang, S., Han, W., Tang, J., Qi, G.J., Aggarwal, C.C., Huang, T.S.: Heterogeneous network embedding via deep architectures. In: Proceedings of KDD. pp. 119–128 (2015)
8. Chen, S., Niu, S., Akoglu, L., Kovaˇcevi´c, J., Faloutsos, C.: Fast, warped graph embedding: Unifying framework and one-click algorithm. arXiv preprint arXiv:1702.05764 (2017) 9. Cheng, K., Li, J., Liu, H.: Unsupervised feature selection in signed social networks. In:
Pro-ceedings of KDD. pp. 777–786 (2017)
10. Choong, J.J., Liu, X., Murata, T.: Learning community structure with variational autoencoder. In: Proceedings of ICDM. pp. 69–78 (2018)
11. Dai, Q., Li, Q., Tang, J., Wang, D.: Adversarial network embedding. In: Proceedingss of AAAI. pp. 2167–2174 (2018)
12. Danon, L., Duch, J., D.-Guilera, A., Arenas, A.: Comparing community structure identification. J. Stat. Mech. p. P09008 (2005)
13. Dettmers, T., Minervini, P., Stenetorp, P., Riedel, S.: Convolutional 2d knowledge graph em-beddings. In: Proceedingss of AAAI. pp. 1811–1818 (2018)
14. Dong, Y., Chawla, N.V., Swami, A.: metapath2vec: Scalable representation learning for hetero-geneous networks. In: Proceedings of KDD. pp. 135–144 (2017)
15. Feng, R., Yang, Y., Hu, W., Wu, F., Zhuang, Y.: Representation learning for scale-free networks. In: Proceedingss of AAAI. pp. 282–289 (2018)
16. Fielding, A.H., Bell, J.F.: A review of methods for the assessment of prediction errors in con-servation presence/absence models. Environmental concon-servation 24(1), 38–49 (1997) 17. Fred, A.L.N., Jain, A.K.: Robust data clustering. In: Proceedings of IEEE Computer Society
Conference on Computer Vision and Pattern Recognition. pp. 128–133. Madison, WI, USA (Jun 2003)
18. Fu, T.y., Lee, W.C., Lei, Z.: Hin2vec: Explore meta-paths in heterogeneous information net-works for representation learning. In: Proceedings of CIKM. pp. 1797–1806 (2017)
19. Gao, M., Chen, L., He, X., Zhou, A.: Bine: bipartite network embedding. In: Proceedingss of SIGIR (2018)
20. Goyal, P., Ferrara, E.: Graph embedding techniques, applications, and performance: A survey. Knowledge-Based Systems 151, 78–94 (2018)
21. Grover, A., Leskovec, J.: node2vec: Scalable feature learning for networks. In: Proceedings of KDD. pp. 855–864 (2016)
22. Hamilton, W.L., Ying, R., Leskovec, J.: Inductive representation learning on large graphs. In: Proceedings of NIPS. pp. 1025–1035 (2017)
23. Hamilton, W.L., Ying, R., Leskovec, J.: Representation learning on graphs: methods and appli-cations. IEEE Data Engineering Bulletin 40, 52–74 (2017)
24. Hu, J., Cheng, R., Huang, Z., Fang, Y., Luo, S.: On embedding uncertain graphs. In: Proceed-ings of CIKM. pp. 157–166 (2017)
26. Huang, X., Li, J., Hu, X.: Label informed attributed network embedding. In: Proceedings of WSDM. pp. 731–739 (2017)
27. Hubert, L., Arabie, P.: Comparing partitions. Journal of Classification 2(1), 193–218 (1985) 28. Jacob, Y., Denoyer, L., Gallinari, P.: Learning latent representations of nodes for classifying in
heterogeneous social networks. In: Proceedings of WSDM. pp. 373–382 (2014)
29. Katz, L.: A new status index derived from sociometric analysis. Psychometrika 18(1), 39–43 (1953)
30. Kipf, T.N., Welling, M.: Semi-supervised classification with graph convolutional networks. In: Proceedings of ICLR (2017)
31. Koutra, D., Shah, N., Vogelstein, J.T., Gallagher, B., Faloutsos, C.: Deltacon: principled massive-graph similarity function with attribution. ACM Trans. Knowl. Discov. Data 10(3), 28:1–28:43 (2016)
32. Koutra, D., Vogelstein, J.T., Faloutsos, C.: Deltacon: A principled massive-graph similarity function. In: Proceedings of SDM. pp. 162–170 (2013)
33. Kullback, S., Leibler, R.A.: On information and sufficiency. The Annals of Mathematical Statis-tics 22(1), 79–86 (1951)
34. Lai, Y.A., Hsu, C.C., Chen, W., Yeh, M.Y., Lin, S.D.: Preserving proximity and global ranking for node embedding. In: Proceedings of NIPS (2017)
35. Li, H., Wang, H., Yang, Z., Odagaki, M.: Variation autoencoder based network representation learning for classification. In: Proceedings of ACL Workshop. pp. 56–61 (2017)
36. Li, J., Dani, H., Hu, X., Tang, J., Chang, Y., Liu, H.: Attributed network embedding for learning in a dynamic environment. In: Proceedings of CIKM. pp. 387–396 (2017)
37. Li, Y., Sha, C., Huang, X., Zhang, Y.: Community detection in attributed graphs: An embedding approach. In: Proceedings of AAAI. pp. 338–345 (2018)
38. Lin, Y., Liu, Z., Sun, M., Liu, Y., Zhu, X.: Learning entity and relation embeddings for knowl-edge graph completion. In: Proceedingss of AAAI. pp. 2181–2187 (2015)
39. Liu, X., Kertkeidkachorn, N., Murata, T., Kim, K.S., Leblay, J., Lynden, S.: Network embed-ding based on a quasi-local similarity measure. In: Proceeembed-dings of PRICAI. pp. 429–440 (2018) 40. Liu, X., Murata, T., Kim, K.S.: Measuring graph reconstruction precisions—how well do em-beddings preserve the graph proximity structure? In: Proceedings of WIMS. pp. 25:1–4 (2018) 41. Liu, X., Murata, T., Kim, K.S., Kotarasu, C., Zhuang, C.: A general view for network
embed-ding as matrix factorization. In: Proceeembed-dings of WSDM. pp. 375–383 (2019)
42. Lloyd, S.: Least squares quantization in pcm. IEEE Transactions on Information Theory 28(2), 129–137 (1982)
43. Lobo, J.M., Jim´enez-Valverde, A., Real, R.: Auc: a misleading measure of the performance of predictive distribution models. Global Ecology and Biogeography 17(2), 145–151 (2008) 44. Ma, J., Cui, P., Zhu, W.: Depthlgp: learning embeddings of out-of-sample nodes in dynamic
networks. In: Proceedings of AAAI. pp. 370–377 (2018)
45. Ma, Y., Ren, Z., Jiang, Z., Tang, J., Yin, D.: Multi-dimensional network embedding with hier-archical structure. In: Proceedingss of WSDM. pp. 387–395 (2018)
46. Mikolov, T., Chen, K., Corrado, G., Dean, J.: Efficient estimation of word representations in vector space. arXiv preprint arXiv:1301.3781 (2013)
47. Mikolov, T., Sutskever, I., Chen, K., Corrado, G., Dean, J.: Distributed representations of words and phrases and their compositionality. In: Proceedings of NIPS. pp. 3111–3119 (2013) 48. Newman, M.E.J.: Networks: An Introduction. Oxford University Press, New York (2010) 49. Nguyen, D.Q., Nguyen, T.D., Nguyen, D.Q., Phung, D.: A novel embedding model for
knowl-edge base completion based on convolutional neural network. In: Proceedingss of NAACL-HLT. pp. 327–333 (2018)
50. Ou, M., Cui, P., Pei, J., Zhang, Z., Zhu, W.: Asymmetric transitivity preserving graph embed-ding. In: Proceedings of KDD. pp. 1105–1114 (2016)
52. Qu, M., Tang, J., Shang, J., Ren, X., Zhang, M., Han, J.: An attention-based collaboration framework for multi-view network representation learning. In: Proceedings of CIKM. pp. 1767–1776 (2017)
53. Radev, D.R., Qi, H., Wu, H., Fan, W.: Evaluating web-based question answering systems. In: Proceedingss of LREC. pp. 1153–1156 (2002)
54. Radovanovi´c, M., Nanopoulos, A., Ivanovi´c, M.: Hubs in space: popular nearest neighbors in high-dimensional data. Journal of Machine Learning Research 11, 2487–2531 (2010) 55. Ribeiro, L.F.R., Saverese, P.H.P., Figueiredo, D.R.: struc2vec: Learning node representations
from structural identity. In: Proceedings of KDD. pp. 385–394 (2017)
56. Tang, J., Qu, M., Mei, Q.: Pte: Predictive text embedding through large-scale heterogeneous text networks. In: Proceedings of KDD. pp. 1165–1174 (2015)
57. Tang, J., Qu, M., Wang, M., Zhang, M., Yan, J., Mei, Q.: Line: Large-scale information network embedding. In: Proceedings of WWW. pp. 1067–1077 (2015)
58. Tang, L., Liu, H.: Relational learning via latent social dimensions. In: Proceedings of KDD. pp. 817–826 (2009)
59. Tang, L., Liu, H.: Scalable learning of collective behavior based on sparse social dimensions. In: Proceedings of CIKM. pp. 1107–1116 (2009)
60. Tu, C., Liu, H., Liu, Z., Sun, M.: Cane: Context-aware network embedding for relation model-ing. In: Proceedings of ACL. pp. 1722–1731 (2017)
61. Tu, C., Zhang, W., Liu, Z., Sun, M.: Max-margin deepwalk: discriminative learning of network representation. In: Proceedings of IJCAI. pp. 3889–3895 (2016)
62. Tu, K., Cui, P., Wang, X., Wang, F., Zhu, W.: Structural deep embedding for hyper-networks. In: Proceedingss of AAAI. pp. 426–433 (2018)
63. Wang, D., Cui, P., Zhu, W.: Structural deep network embedding. In: Proceedings of KDD. pp. 1225–1234 (2016)
64. Wang, H., Wang, J., Wang, J., ZHAO, M., Zhang, W., Zhang, F., Xing, X., Guo, M.: Graphgan: graph representation learning with generative adversarial nets. In: Proceedings of AAAI. pp. 2508–2515 (2018)
65. Wang, H., Zhang, F., Hou, M., Xie, X., Guo, M., Liu, Q.: Shine: Signed heterogeneous in-formation network embedding for sentiment link prediction. In: Proceedings of WSDM. pp. 592–600 (2018)
66. Wang, Q., Mao, Z., Wang, B., Guo, L.: Knowledge graph embedding: a survey of approaches and applications. IEEE Transactions on Knowledge and Data Engineering 29(12), 2724–2743 (2017)
67. Wang, S., Aggarwal, C., Tang, J., Liu, H.: Attributed signed network embedding. In: Proceed-ings of CIKM. pp. 137–146 (2017)
68. Wang, X., Cui, P., Wang, J., Pei, J., Zhu, W., Yang, S.: Community preserving network embed-ding. In: Proceedings of AAAI. pp. 203–209 (2017)
69. Xu, L., Wei, X., Cao, J., Yu, P.S.: On exploring semantic meanings of links for embedding social networks. In: Proceedings of WWW. pp. 479–488 (2018)
70. Yang, B., Yih, W.t., He, X., Gao, J., Deng, L.: Embedding entities and relations for learning and inference in knowledge bases. In: Proceedingss of ICLR (2015)
71. Yang, C., Liu, Z., Zhao, D., Sun, M., Chang, E.: Network representation learning with rich text information. In: Proceedings of IJCAI. pp. 2111–2117 (2015)
72. Yang, C., Sun, M., Liu, Z., Tu, C.: Fast network embedding enhancement via high order prox-imity approximation. In: Proceedings of IJCAI. pp. 3894–3900 (2017)
73. Yang, D., Wang, S., Li, C., Zhang, X., Li, Z.: From properties to links: deep network embedding on incomplete graphs. In: Proceedings of CIKM. pp. 367–376 (2017)
74. Yang, Z., Cohen, W., Salakhudinov, R.: Revisiting semi-supervised learning with graph em-beddings. In: Proceedings of ICML. pp. 40–48 (2016)
76. Zhang, J., Xia, C., Zhang, C., Cui, L., Fu, Y., Yu, P.S.: Bl-mne: emerging heterogeneous so-cial network embedding through broad learning with aligned autoencoder. In: Proceedingss of ICDM. pp. 605–614 (2017)
77. Zhang, Y., Xiong, Y., Kong, X., Zhu, Y.: Learning node embeddings in interaction graphs. In: Proceedings of CIKM. pp. 397–406 (2017)
78. Zhang, Y., Lyu, T., Zhang, Y.: Cosine: community-preserving social network embedding from information diffusion cascades. In: Proceedings of AAAI. pp. 2620–2627 (2018)
79. Zhang, Z., Cui, P., Pei, J., Wang, X., Zhu, W.: Timers: error-bounded svd restart on dynamic networks. In: Proceedings of AAAI. pp. 224–231 (2018)
80. Zhou, T., L¨u, L., Zhang, Y.C.: Predicting missing links via local information. Eur. Phys. J. B 71(4), 623–630 (2009)
Xin Liu is a researcher of The National Institute of Advanced Industrial Science and Technology (AIST). He received a Doctor degree in Computer Science from Tokyo Insti-tute of Technology in 2011. His main research interests are graph mining, data mining, machine learning, and neural networks.
Chenyi Zhuang joined Artificial Intelligence Research Center (AIRC), AIST as a re-searcher in April 2018. Prior to that, during October 2017 and March 2018, he was a post-doctor in Kyoto University. He received the BS degree in SE from Nanjing Uni-versity in 2011, the MS degree and PhD degree in Informatics from Kyoto UniUni-versity in 2014 and 2017, respectively. In between, from 2015 to 2018, he was also serving as a young scientist in Japan Society for the Promotion of Science (JSPS). His current research primarily involves structured data mining, machine learning and urban computing.
Tsuyoshi Murata is an associate professor of the department of computer science in Tokyo Institute of Technology. He has been doing research on artificial intelligence, es-pecially complex networks, machine learning and data mining. He served as one of the directors of The Japanese Society for Artificial Intelligence from 2013 to 2015.
Kyoung-Sook Kimis now the team leader of Data Platform Research Team at the Artifi-cial Intelligence Research Center (AIRC) of AIST in Japan. She served as a researcher of National Institute of Information and Communications Technology (NICT) in Japan from 2007 to 2014. She received my B.S., M.S., and Ph.D. Degrees in Computer Science from Pusan National University in Korea in 1998, 2001, and 2007, respectively. She is also serving as a co-chair of OGC Moving Features Standard Working Group and an expert of ISO TC204 WG3. Her research interests are in Geo-enabled Computing Framework based on GIS, Location-based Services, Spatiotemporal databases, Big data analysis, Machine learning, etc.
Natthawut Kertkeidkachornreceived a Ph.D. degree in Informatics from Sokendai (The Graduate University for Advanced Studies), Japan in 2017. He is currently a researcher at Artificial Intelligence Research Center, National Institute of Advanced Industrial Sci-ence and Technology and a visiting researcher at National Institute of Informatics, Japan. His research interests include the Semantic Web, machine learning and natural language processing.