DOI: 10.5958/0976-4666.2017.00030.4 ©2017 EA. All rights reserved
An Economic Analysis of Arrival and Turnover of Fruits and
Vegetables of Narwal Mandi Jammu
Naveed Hamid, Sudhakar Dwivedi*, Ashish Kumar Isher
and Shaiq Jeelani
Division of Agricultural Economics and Agri-Business Management SKUAST-Jammu, IndiaCorresponding author: [email protected]
ABSTRACT
The studywas conducted in Narwal Mandi, Jammu situated in the southern area of Jammu city. This is one among the three fruit and vegetable terminal markets in Jammu and Kashmir. The other two are Parimpora of Srinagar and Nowpora of Sopore distrcts. The study based on both the primary and secondary data. In the study 26 carrying and forwarding agents were selected through purposive sampling for the collection of primary information with the help of structured and tested schedule and the secondary information was collected from Directorate of Horticulture (Planning and Marketing), Jammu and APMC Narwal, Jammu. The collected data were analyzed by using descriptive statistical tools, seasonal variations and 95% confidence interval technique. The study also revealed that the arrival (in MT) was more in vegetables as compared to fruits, whereas turnover (in `) was more for fruits than vegetables. The reason for the same was higher average rates per quintal in fruits than vegetables. The study analyzed and depicted that the decadal highest arrival 407625 MT was received in fruits and vegetables for the year 2011-12 and decadal highest turnover ` 11875 lakh was received in the year 2013-14.
Keywords: Narwal Mandi, vegetables, horticulture
Jammu & Kashmir State is well-known for its niche in horticultural produce both in India and abroad (Malik, 2013). The state offers good scope for cultivation of horticultural crops, covering a variety of temperate fruits like apple, cherry, pear, peach, plum, apricot, sub-tropical fruits like mango, guava, citrus litchi, and phalsa, and nut crops like almond and walnut. Horticulture is gaining momentum in the state of J&K, as its contribution to the GSDP has been around 7-8 per cent over the past few years. Triggering a perceptible change in the concept of horticulture development presently around 7 lakh families comprising of about 33 lakh people in the state are directly or indirectly associated with horticulture (Reshi et al., 2010).
The major fruit grown in the State are apple, mango, walnut, almond, pear, cherry, apricot, peach, plum etc. Kashmiri apple is famous both in taste and appearance. It has gained fame in the export market and fetches a very good return. The major vegetables grown in the state are onion, potato, tomato, turnip,
mutter, radish, carrot, green vegetables etc. and spices like chilies, garlic, turmeric etc.
Horticulture development now a thrust area of the state with number of programmes culminated into generation of higher incomes in rural areas, thereby
improved the quality of life. An income of ` 5000 crore has been generated from fruit production during 2013-14 which includes an amount of 495 crore from dry fruits. With an estimated income multiplier of 1.68, it actually generates factor incomes of nearly ` 9,000 crores. The growth
momentum of horticulture sector can be attributed
to various initiatives taken by the Govt. of India and State Govt. towards market interventions viz. establishment of fruit markets, provision for support price, technological support, awareness options, publicity inputs, research/extension etc. (Economic Survey, J&K 2014-15).
The major fruit grown in the State are apple, mango, walnut, almond, pear, cherry, apricot, peach, plum etc. Kashmiri apple is famous both
in taste and appearance. It has gained fame in the export market and fetches a very good return. The major vegetables grown in the state are onion, potato, tomato, turnip, mutter, radish, carrot, green vegetables etc. and spices like chilies, garlic, turmeric etc. As per Horticulture Department an area of 3.55 lakh hectares was reported under major horticulture crops for the year 2013-14 with 68.35 percent area under fresh fruits. Production of fruit during 2013-14 was 20.74 lakh metric tonnes comprising of 18.41 lakh million tonnes of fresh fruit and 2.33 lakh million tonnes of dry fruit. Export of fruit outside State for the year 2013-14 as per Directorate of Horticulture (P&M) was 12.03 lakh metric tonnes and import of fruit & vegetable during the same year was recorded to be 5.09 lakh metric tones (Digest of Statistics 2013-14).
As far as Narwal Mandi is considered (subject for research), the Fruit and Vegetable Market Narwal is one of the terminal markets of Jammu And Kashmir State. It is situated in the southern area of Jammu city. The market is well connected with roads and National Highway 1A (Jammu by-pass). It was established in the year 1980 with a present area of 374 (kanals) approx. The total numbers of shop sites are 513 with 7 auction phars. The transport facility for public is matador service. In the Narwal mandi there are 298 commission agents with 300 number of buyers outside the state. There are two traders association viz, Fruit Association Narwal Mandi, Jammu and Vegetable Association Narwal Mandi, Jammu. The banks associated with Narwal Mandi, Jammu are The Jammu and Kashmir Bank limited and Central Bank of India. There are two cold storages present in Narwal Mandi, Jammu namely: Bahu Cold Store and KC Cold Store both having the capacity of 4000 MT. (APMC Narwal, Jammu).
MATERIALS AND METHODS
The Narwal Mandi selected purposively for the present investigation. A total number of 26 samples; in which 13 respondents (fruit forwarding agents) and 13 respondents (vegetable forwarding agents) were studied. The respondents were interviewed and information collected through pre
tested schedule and questionnaire. The secondary
information regarding arrival and turnover were collected from Directorate of Horticulture (Planning and Marketing), Jammu and APMC Narwal,
Jammu. The collected data were analyzed to obtain the results of arrival and disposal of fruits and vegetables in Narwal Mandi (Jammu), by the
Seasonal Variations and 95% confident interval. In
order to estimate the seasonal variation, the twelve month moving average (TMMA) was used which gave us the periodic changes without seasonality. The actual values were then divided by calculated values of TMMA to get the seasonal variations. Y = Output, T = Trend, S = Seasonal, C = Cyclic, I = Irregular, M.A. (12) = Twelve month moving average, PI = Market arrivals/ Price indices, S.I = Seasonal Indices for market arrivals, However to
estimate the 95% confident interval standard error
and standard deviations were used which gave us the intervals of arrival and turnover over a decade.
95% Confidence Interval, S.E = S.D/√n
95% C.I = Mean ± µ*S.E
RESULTS AND DISCUSSION
The results pertaining to the present investigation “A study of Narwal Mandi – An epicenter of fruits and vegetables” have been presented in this chapter
along with appropriate tables and figures.
Decadal Arrival & Turnover of Fruits and Vegetables
for fruits respectively. The table also showed that the average rate per Quintal in sub tropical component viz; Sub-tropical, Temperate, Dry fruits, Total Fruits and Vegetables were calculated as ` 1956.14, ` 2743.11, ` 24721.39, ` 3263.57 and `
1172.32 respectively. Thus, the result depicted that the mean value of arrival of fruits and vegetables is highest in sub tropical commodities and turnover is in temperate components.
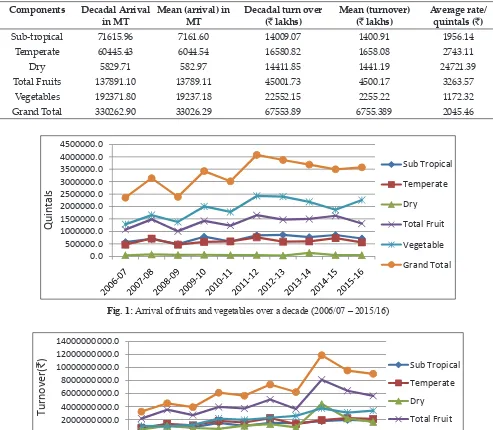
Fig. 1 indicates decadal arrival of fruits and vegetables (MT) in Narwal Mandi, Jammu. In case
of fruits, the lowest arrival is in dry fruits and highest in sub-tropical fruits. While comparing total fruits with vegetables, arrivals in total fruit are lower as compared to vegetable arrivals over a decade and the increment of arrivals in vegetables over total fruits is 12207.96 (MT).
Fig. 2 showed decadal turnover (`) of fruits and vegetables in Narwal Mandi, Jammu. In case of fruits, the highest decadal average turnover was in temperate fruits and lowest in sub-tropical fruits whereas turnover in total fruit were higher as Table 1: Total decadal arrivals (MT) and turnover (` lakhs) of fruits and vegetables
Components Decadal Arrival
in MT Mean (arrival) in MT Decadal turn over (` lakhs) Mean (turnover) (` lakhs) Average rate/quintals (`)
Sub-tropical 71615.96 7161.60 14009.07 1400.91 1956.14
Temperate 60445.43 6044.54 16580.82 1658.08 2743.11
Dry 5829.71 582.97 14411.85 1441.19 24721.39
Total Fruits 137891.10 13789.11 45001.73 4500.17 3263.57
Vegetables 192371.80 19237.18 22552.15 2255.22 1172.32
Grand Total 330262.90 33026.29 67553.89 6755.389 2045.46
0.0 500000.0 1000000.0 1500000.0 2000000.0 2500000.0 3000000.0 3500000.0 4000000.0 4500000.0
Q
ui
nt
al
s
Sub Tropical Temperate Dry Total Fruit Vegetable Grand Total
Fig. 1: Arrival of fruits and vegetables over a decade (2006/07 – 2015/16)
0.0 2000000000.0 4000000000.0 6000000000.0 8000000000.0 10000000000.0 12000000000.0 14000000000.0
Tu
rn
ov
er
(
`
)
Sub TropicalTemperate Dry Total Fruit Vegetable Grand Total
compared to vegetable turnover in 10 years. The arrivals in total fruits and vegetables have increased by ` 5798.54 lakhs in 10 years.
Seasonal indices for arrival and turnover of total fruits and vegetables over a decade
Table 2 depicts the arrival and seasonal indices of total fruits and vegetables over the whole decade. In 2006-07 the arrival of fruits and vegetables is 23544.31(MT), which is 28.7% lesser than the overall average of the whole decade and is also the lowest arrival. Similarly, arrival of the rest years can be interpreted in the same way. The arrival seasonal index in 2011-12 is 23.4% (highest) more than average arrival of the whole decade. Moreover, the
turnover of total fruits and vegetables is shown in the last two columns of the above table. The lowest turnover is in 2006-07 which is 51.4% lesser than the overall average of the whole decade, also 2013-14 indicates 78.1% (highest) more than the overall average of turnover of total fruits and vegetables over the whole decade.
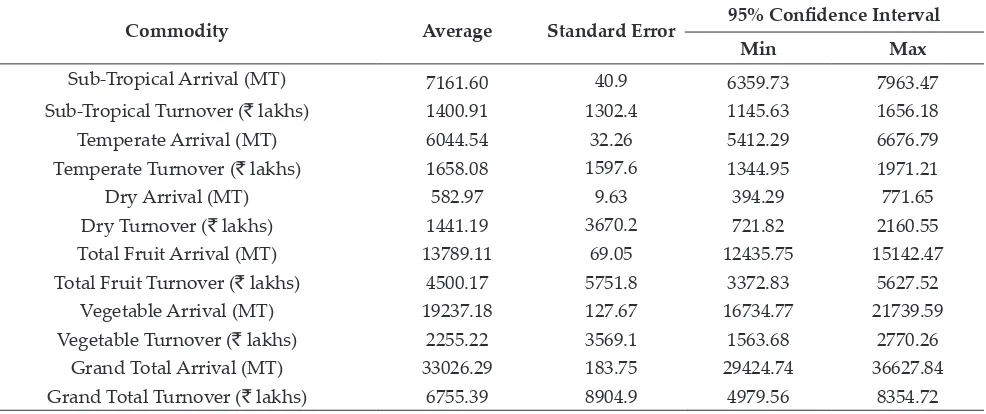
The 95% confident interval (C.I) in Table 3 gives
the range, both upper and lower limits, of the occurrence in past, present or future. The 95% C.I assures us that the 95 times out of 100 occurrences will be following in this range. Hence the table 5.23 suggested that arrivals (MT) in sub-tropical fruits over a decade would have been in the range of 6359.73 MT – 7963.47 MT i.e., for at least 95% of
Table 2: Seasonal indices for arrival and turnover of total fruits and vegetables over a decade
Sl. No. Year Arrival Seasonal Indices Turnover Seasonal Indices
1 2006-07 23544.31 71.3 3238.17 48.6
2 2007-08 31396.66 95.1 4577.55 68.7
3 2008-09 23891.17 72.3 3920.27 58.8
4 2009-10 34249.07 103.7 6131.85 92.0
5 2010-11 30136.96 91.3 5684.83 85.3
6 2011-12 40762.44 123.4 7391.45 110.9
7 2012-13 38717.99 117.2 6229.19 93.4
8 2013-14 36845.99 111.6 11875.27 178.1
9 2014-15 34966.04 105.9 9526.54 142.9
10 2015-16 35752.27 108.3 9036.71 135.6
Table 3: Confidence interval for the arrivals (quintals) and turnover (`) in fruits and vegetables
Commodity Average Standard Error 95% Confidence Interval
Min Max
Sub-Tropical Arrival (MT) 7161.60 40.9 6359.73 7963.47
Sub-Tropical Turnover (` lakhs) 1400.91 1302.4 1145.63 1656.18
Temperate Arrival (MT) 6044.54 32.26 5412.29 6676.79
Temperate Turnover (` lakhs) 1658.08 1597.6 1344.95 1971.21
Dry Arrival (MT) 582.97 9.63 394.29 771.65
Dry Turnover (` lakhs) 1441.19 3670.2 721.82 2160.55
Total Fruit Arrival (MT) 13789.11 69.05 12435.75 15142.47
Total Fruit Turnover (` lakhs) 4500.17 5751.8 3372.83 5627.52
Vegetable Arrival (MT) 19237.18 127.67 16734.77 21739.59
Vegetable Turnover (` lakhs) 2255.22 3569.1 1563.68 2770.26
Grand Total Arrival (MT) 33026.29 183.75 29424.74 36627.84
the arrivals in each year in sub-tropical fruits were in between 6359.73 MT – 7963.47 MT. Similarly, the table suggests the interval for each year turnover (`) of sub-tropical fruits i.e., ` 1145.63 lakhs – `
1656.18 lakhs, arrival in temperate fruits is 5412.29 MT – 6676.79 MT, turnover in temperate fruits is `
1344.95 lakhs – ` 1971.21 lakhs, arrival in dry fruits is 349.29 MT – 771.65 MT, turnover in dry fruits is
` 7218.24 lakhs – ` 2160.55 lakhs, arrival in total fruits is 12435.757 MT – 15142.47 MT, turnover in total fruits is ` 3372.83 lakhs – ` 5627.52 lakhs, arrival in vegetables is 16734.77 MT – 21739.59 MT and turnover in vegetables lies between ` 1563.68 lakhs – ` 2770.3 lakhs.
This study reveals that the highest arrival ‘4076244.0’
quintals in total fruits and vegetables in Narwal
Mandi over the period 2006-07 to 2015-16 have been during the year 2011- 12. However, the highest turnover ‘11875272956.0’ (`) in total fruits and vegetables in Narwal Mandi has been during the year 2013-14. This is due to the changing rates of commodities depending upon the season and demand. Moreover study depicts that the average
rates rupees/quintal of fruits are higher as compared
to vegetables in every year over this decade and in case of fruits average rates are highest for dry fruits followed temperate and sub-tropical respectively.
This study also shows the arrival (in quintals) of vegetable 19237180.0 quintals is higher than fruits 13789110.0 quintals.
CONCLUSION
The study concluded that the arrival (in MT) was more in vegetables as compared to fruits, whereas turnover (in `) was more for fruits than vegetables. The reason for the same was higher average rates
per quintal in fruits than vegetables. The study
analysed and depicted that the decadal highest
arrival 407625 MT was received in fruits and vegetables for the year 2011-12 and decadal highest turnover ` 11875 lakh was received in the year 2013-14. The study also concluded that the peak season period for arrival and turnover in Narwal Mandi
is Aug-Dec due to both, highest arrival in quintals
and highest turnover in (`) in Temperate and Dry fruits collectively.
REFERENCES
Anonymous. 2011. Department of Agriculture and Cooperation Ministry of Agriculture Government of India March, Indian Economy 2011.
Anonymous. 2011. Directorate of Economics & Statistics, Jammu and Kashmir.
Anonymous. 2011. Directorate of Horticulture and food processing.
Arora, V.P.S. 2005. Marketing and Export of horticultural products of Uttaranchal, Indian J. Agri. Market., 19(2) : 194-206.
Ayieko, M., Tchirley, D.L. and Mathenge, M. 2005. Fresh Fruit and Vegetable Consumption and Trade in Urban Kenya: Implications for Policy and Investment Priorities. Tegemeo Institute of Agricultural Policy and Development, Egerton University, 3(2) : 105-109.
Dwivedi Sudhakar,Morup Dolma and Pawan Kumar Sharma. 2016. Improving Marketing Efficiency of Broiler for Small Production Units in Jammu and Kashmir State of India.
Indian Journal of Ecology.43(Special Issue-1): 400-403.
Kumar, Ganesh., Pramanik, S.C. and Shakila Nawaz. 2004, Economics of production and marketing of vegetables in Andaman and Nicobar islands. Indian J. Agri. Market., 18(2) : 36-40.
Kachroo, Jyoti., Bhat, Anil. and Singh, S.P. 2014. A study on behavior of arrivals and prices citrus in Narwal Market of Jammu, Indian J. Agri. Market., 13(2): 6-14.
Vikas Kumar, Sudhakar Dwivedi, Sarju Narain and Sudhir K. Rawat. 2016. Assessment of Marketable and Marketed Surplus of Rice in Relation to Farm Size. Agro Economist–