Geschke Center
Doctoral Dissertations Theses, Dissertations, Capstones and Projects
4-2018
A Geospatial Analysis of a Transit Program on
California Community College Students
Alicia Kathryn De Toro
University of San Francisco, [email protected]
Follow this and additional works at:https://repository.usfca.edu/diss Part of theHigher Education Commons
This Dissertation is brought to you for free and open access by the Theses, Dissertations, Capstones and Projects at USF Scholarship: a digital repository @ Gleeson Library | Geschke Center. It has been accepted for inclusion in Doctoral Dissertations by an authorized administrator of USF Scholarship: a digital repository @ Gleeson Library | Geschke Center. For more information, please [email protected].
Recommended Citation
De Toro, Alicia Kathryn, "A Geospatial Analysis of a Transit Program on California Community College Students" (2018).Doctoral Dissertations. 458.
The University of San Francisco
A GEOSPATIAL ANALYSIS OF A TRANSIT PROGRAM ON CALIFORNIA COMMUNITY COLLEGE STUDENTS
A Dissertation Presented to
The Faculty of the School of Education Organization and Leadership Department
In Partial Fulfillment Of the Requirements for the Degree
Doctor of Education
by
Alicia Kathryn De Toro San Francisco
THE UNIVERSITY OF SAN FRANCISCO
Dissertation Abstract
A GEOSPATIAL ANALYSIS OF A TRANSIT PROGRAM ON CALIFORNIA COMMUNITY COLLEGE STUDENTS
Subsidized transit policy is a strategy used to lessen environmental impacts and increase institutional accessibility in higher education. Program funding to support this subsidized transit policy can vary between institutions. This research focuses on the geographic analysis of Eco Pass, a student led initiative implemented in the Foothill De Anza Community College District in California to offset transportation costs for students. Through the use of Environmental Science Research Institute software, the research aimed to determine which geographic areas, if any, were of high and low probability of Eco Pass use from data during 2011-2017 using Tobler’s first law of geography. Exploratory regression was conducted using income, population, crime, vehicle ownership, and educational attainment (per census block) to determine Eco Pass use prediction. The results of the analysis indicate that over time the mean of the Eco Pass population, by student address, shifted eastward for the entire district. The impact of De Anza College’s Eco Pass students impacted the overall district, more than Foothill. Exploratory regression of selected variables revealed that population, with crime index on the borderline, as predictors of Eco Pass use. Ultimately, regression models were rejected to non-stationarity.
Recommendations based on findings include assessing the goals of the Eco Pass policy. This study found that Foothill has less influence in the district Eco Pass
Signature Page
This dissertation, written under the direction of the candidate’s dissertation committee and approved by the members of the committee, has been presented to and accepted by the Faculty of the School of Education in partial fulfillment of the requirements for the degree of Doctor of Education. The content and research methodologies presented in this work represent the work of the candidate alone.
Alicia K. De Toro April 26, 2017
Candidate
Dissertation Committee
Dr. Danfeng Koon April 26, 2018
Chairperson
Dr. Nicola McClung April 26, 2017
Acknowledgements
"When we try to pick out anything by itself, we find it hitched to everything else in the Universe."
John Muir, naturalist
My background in environmental sciences allowed for a unique experience in a
social science based doctoral program. But as stated by John Muir, all things are
interconnected. Expanding my education to deepen my understanding of organization and
leadership allowed me to explore ideas that further reinforced my environmental science
knowledge. Like an ecotone, where two communities meet, my knowledge represents the
overlapping communities of social and environmental sciences. In a time where we are
experiencing impacts from climate change, to me this is an important space. For without
a healthy environment, the Earth cannot support a healthy population.
I have met many colleagues during my time in this doctoral program in the school
of Education at the University of San Francisco. It is because of these supportive
individuals that I have been able to accomplish this goal, some of whom I would like to
personally thank. Dr. Patricia Mitchell has always been a compassionate and exemplary
scholar who I continue to admire. She provided me with support during a time of personal
struggle, which is appreciated. My committee members Dr. Danfeng Koon, Dr. Nicola
McClung, and Dr. Darrick Smith are ascending leaders in the scholar community who
provided me with encouragement throughout the dissertation process. I definitely would
important contributors to the future of education and I am proud to have worked with them.
Additionally, I would like to thank Thanh Ly for all of the work that she does for the
Organization and Leadership program; she is an amazing asset.
During this program I met many new friends. These colleagues provided a
community of supporters with similar interests that I could not have found elsewhere. I
will cherish the memories and remember our learning experiences. I look forward to
working with many of them in our future. Friends and family who have supported me
through this process will be happy to see more of me and should know that I appreciate
every conversation, text, shoulder for crying, and everything else that got me here.
Ultimately, I would like to acknowledge my mother and father, Judith and Pedro De Toro.
My parents have always supported me in my academic endeavors. To be capable of
unconditional love is a unique characteristic and they have it. I am forever grateful for all
that they have done to provide me with access to higher education and the resources
Table of Contents
Dissertation Abstract 2
Signature Page 1
Acknowledgements 2
CHAPTER ONE: THE RESEARCH PROBLEM 6
Introduction 6
Statement of the Problem 8
Purpose of the Study 10
Research Questions 13
Delimitations 14
Limitations 14
CHAPTER TWO: REVIEW OF LITERATURE 16
Purpose of Community Colleges 16
Access and Barriers to Community College 18
University Transportation Policies 21
Eco Pass Policy 25
CHAPTER THREE: METHODOLOGY 27
Research Questions 27
Background: Foothill De Anza Community College District 28
Methods 32
Sample 33
Data Sources 33
Data Analysis 36
Ethical Considerations 39
Summary 40
CHAPTER FOUR: RESULTS 41
Introduction 41
Findings 41
Geographic Distribution of Eco Pass Users 41
Summary of Findings 55
CHAPTER FIVE: DISCUSSION OF FINDINGS 57
Discussion of findings 57
Foothill College 59
De Anza College 60
Epilogue 62
List of Tables
Table 1. Table identifying the variables used in exploratory regression 35 Table 2. Spatial statistics used in the Eco Pass analysis with calculation methodology and
visual representation 38
Table 3. Table showing output of the Ordinary Least Squares Regression 54
Table of Figures
Figure 1. Environment Systems Research Institute Community Analyst output infographic for a ten-minute walking distance radius from the De Anza Campus. 28 Figure 2. Environment Systems Research Institute Community Analyst output infographic
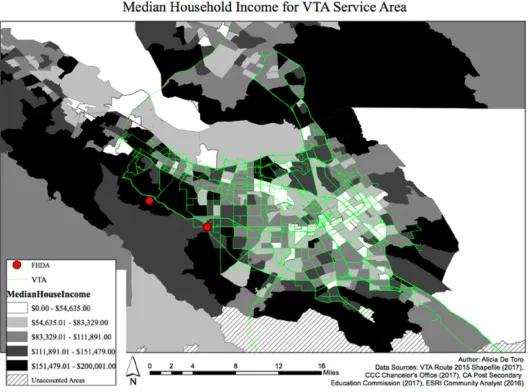
for a ten-minute walking distance radius from the Foothill Campus. 29 Figure 3. Map depicting income differences in the communities connected to FHDA
through the VTA transportation network. College campuses are depicted by the red
dots. 30
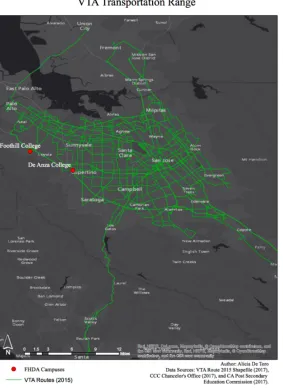
Figure 4. Map depicting the transportation network provided to students through the
approval of the Eco Pass program at each campus location. 31
Figure 5. Map showing median center by year for all Foothill De Anza Eco Passes. 42 Figure 6. Map showing median center by year for all Foothill and De Anza Eco Passes by
year and campus. 43
Figure 7. Graph showing the distances, in miles, between the campus location and annual
median. 44
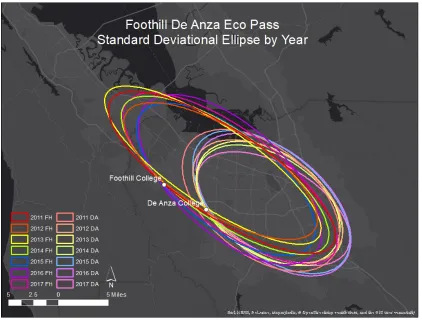
Figure 8. Map showing standard deviational ellipses, showing one standard deviation by
year for all Foothill De Anza Eco Passes. 45
Figure 9. Map with results of spatial join showing Eco Pass count per California Census Block group at the regional level closest to the college campuses. 46 Figure 10. Results of spatial autocorrelation of Eco Pass counts for Foothill De Anza
College District indicating clustering, non-randomness. 47
Figure 11. Map of hot spot analysis output based on the 99% confidence interval features of
the region. 48
Figure 12. Map of hot spot analysis of the 99% confidence interval features of the Eco Pass
distribution for Foothill only. 50
Figure 13. Map of hot spot analysis of the 99% confidence interval features of the Eco Pass
CHAPTER ONE: THE RESEARCH PROBLEM
Introduction
Scientific models indicate that climate change is occurring. Global changes in
temperature, soil moistures, precipitation, drought frequency and intensity, and sea level rise are already having negative impacts on social and economic systems. The burden of climate change will disproportionately impact poorer countries and lower income populations around the world. In addition to the direct environmental fall out, there will be social implications that exacerbate the hardships suffered by people of color and/or low-income communities in areas such as health, employment, housing, and food (“NAACP |
Environmental & Climate Justice,” n.d.). Leaders who foresee the need to prepare populations for a changing environment through lessening future anthropogenic impacts have embraced environmental policy (U.S. Global Change Research Program, 2014).
Despite the current political discourse in the United States, there is no debate within the scientific community on the anthropogenic responsibility for climate change. According to the International Panel on Climate Change, “Human influence on the climate system is clear, and recent anthropogenic emissions of greenhouse gasses are the highest in history. Recent climate changes have had widespread impacts on human and natural systems” (Pachauri, 2014). The dependence on fossil fuels for transportation along with the
organizational transportation focused policies aim to reduce vehicle emissions through mass transit, carpooling, and parking initiatives (Withgott & Laposata, 2014).
A specific response to offsetting carbon emissions at an organizational level is that of subsidized bussing. Universities and employers offer transit subsidies and passes to encourage use of public transportation. Many community colleges, in particular, have adopted these policies for both environmental reasons and access and equity concerns. The state of California provides higher education opportunity through the community college system, which serves as the entry point to higher education for many underrepresented groups such as low-income, African American, Latinos, immigrants, and working adults (Dowd, 2003). Community colleges are the only branch of the California Higher education system that does not have extensive requirements for admission to ensure that higher education is available to “any student capable of benefiting from instruction” (“Admission Requirements,” 2012; UC Office of the President, 2007). With specialized courses in vocational and academic subjects, along with basic skill and English as second language courses, financial assistance opportunities, and specialized programs to assist with student success, transit passes for community college students are a valuable resource to low-income groups (Sengupta & Jepsen, 2006).
Statement of the Problem
Universal transit, universal access, fare-free access, and Eco Passes are agreements between colleges and local transportation agencies that result in subsidized mass transit fees for students, allowing them to use the service at a discounted rate (Hess, Brown, & Shoup, 2004). Use of these passes has been rooted in both environmental and social goals (“De Anza College Eco Pass”, 2011).
Environmental benefits of subsidized transit are well documented. Research demonstrates that alternative transportation options reduce single car ridership and thus offset some of the negative environmental impacts of transportation. This is revealed by the decrease in demand for on-campus parking and an increase in transit system usage in studies of subsidized transit program implementation (Brown, Hess, & Shoup, 2003). Alternative transit is encouraged in dense urban areas where traffic congestion causes concern about air quality. Promoting mass transit, and encouraging “carpooling” and other alternatives, lowers the number of cars on the roadways, ultimately decreasing air pollution (“Transportation Research Board,” 2001). These results are desirable and necessary in achieving
organizational goals for leaders who embrace sustainability.
more level among varying socioeconomic statuses. In a car-dominated community, busing makes higher education more accessible to those in lower socioeconomic groups who may not be able to afford their own cars. This type of financial assistance is uniquely important to low-income students on community college campuses (Brown, Hess, & Shoup, 2003).
In fall 2010 student leaders began advocating for subsidized transportation on the De Anza College campus. They proposed that the Foothill De Anza Community College
District (FHDA) establish a subsidized transit plan with the Santa Clara Valley
Transportation Authority (VTA), deemed “Eco Pass.” The program is similar to the other subsidized transit programs yet has a name that gives it instant marketability to the
environmentally conscious consumer.
Leading up to the decision to allow the greater campus to vote on the initiative, the De Anza Student Body (DASB), or the governing body representing students at the college, debated the numerous pros and cons of implementation in session. Meeting minutes
After the DASB student leaders embraced the Eco Pass program the student body followed, with 89% of students voting in favor of the ballot measure on May 15, 2011 (“De Anza College,” 2011). Approval of the student body moved the Eco Pass forward and it proposed that the Foothill De Anza Community College District Board of Trustees
[T]ake action to charge a mandatory quarterly fee of up to five dollars to all full-time De Anza College students and a mandatory quarterly prorated fee to all De Anza College part-time students to make VTA Eco Passes available to all De Anza students.
The Board of Trustees then passed the aforementioned transportation fee resolution for De Anza Community College and implementation began in Fall 2011 (Foothill De Anza Community College District, 2013).
Although the use of subsidized transit occurs in many organizations, most research has been conducted on four-year university programs. Very little information exists on community college programs and increased research is necessary to fully
understand how transit passes impact access, inclusion, and diversity on community college campuses. Through quantitative analysis of cross-sectional data, this research examines whether decreasing public transportation costs through Eco Passes increases accessibility to students and changes the demographic composition of on-campus community college student populations.
Purpose of the Study
demand for on-campus parking, increased accessibility to housing and employment, recruiting and retention, reduction in costs of attendance, and increase in transportation equity (Transportation Research Board, 2001). Community colleges are unique from four-year universities because of the limited requirements for admission and the cost of
attendance. The influences of community colleges on underserved groups is substantial, therefore more exploration into the effects of universal passes is warranted and necessary.
The Foothill De Anza Community College District are well known for their high academic standing. In 2015-2016 De Anza was identified as the number one large community college in California and Foothill was named the number one medium
California community college. The two colleges have the highest graduation, transfer, and retention rates of all community colleges in California (“The 15 Best Community Colleges in California | 2015-2016,” 2015). Despite the colleges residing in affluent communities, the resources at these colleges are beneficial to success, which are valuable to many students throughout the South San Francisco Bay Area. Access to campus, and thus the assistance available, is important to student success, especially for students from lower-income communities. This study focuses on identifying communities who are served using the Eco Pass subsidized bussing program.
providing more community college access to lower-income communities.
FLG is a theory developed by Waldo Tobler, which states, “everything is related to everything else, but near things are more related than distant things” (Miller, 2004). The theory states that “similar values for nearby features occur because of similar conditions” (Mitchell, 1999). Based on this theory, communities closest to the colleges, and thus the students that reside within them, will be most like the communities the colleges inhabit. In contrast, communities farther away from the colleges, will be less like the closer
communities. Since the colleges in this study are located within affluent communities, this theory states that the further a student travels to access campus, the less likely their
community will be similar to that of the college.
In this study, each student address was plotted, grouped by census block, and spatial statistics, including median center analysis were conducted. Lastly the ESRI/census data was connected to the student data to determine the impact of selected variables on the prediction of Eco Pass use. Data used in this study included 2017 median income, 2017 total population, 2017 crime index, household ownership or leasing of vehicle, and 2017
educational attainment (“Census and ACS—Esri Demographics | ArcGIS,” n.d.). The connection of this data provided insight for analysis of the sample.
Significance
Although public transportation exists, it only allows for physical access to campuses at a cost to the individual user. The subsidization of public transportation is a strategy used by higher education institutions to assist with managing parking and transportation for campus access and studies have indicated a significant increase in transit ridership as a result.
This research allowed for a better understanding of the geographies of students who are likely or unlikely to request an Eco Pass in the Foothill De Anza Community College district. Determining differing characteristics allows for further evaluation of benefits and purpose of existing campus programs and future program development alignment with student needs. Also, identification of predictors to Eco Pass use was beneficial to a better understanding of the social or demographic variables that may or may not influence subsidized bussing use in community colleges.
On a larger scale this research contributes to the breadth of knowledge on higher education and transportation policies. It creates a more profound, multidimensional
understanding of community college students’ needs, which, in turn, contributes to a greater understanding of the importance of aligning programs and policies to student needs.
Research Questions
This research aimed to analyze a sample of students who chose to use subsidized transportation. The two main research questions were
1. What geographic neighborhoods/communities are most likely to utilize Eco Pass to access the community colleges? What geographic neighborhoods/communities are least likely to utilize Eco Pass to access the community colleges?
Eco Pass use?
Delimitations
This study analyzed the students from Foothill De Anza Community Colleges enrolled in courses during Fall 2011 through Spring 2017 who requested Eco Passes. The data for this study was gathered from the district’s Office of Institutional Research and Planning (“Welcome!,” n.d.). Analysis of census block data was selected by the researcher to drill down in to the smallest geographic scale.
Additional delimitations include selection of variables, which were determined by the researcher, informed by the literature and the availability of data. The selection of variables was limited to availability of data. For this study manipulation of data occurred to limit the impact of outliers that existed within the dataset. A 30-mile district radius was created to identify Eco Pass users who reasonably could access the Valley Transportation Authority network. This removed geographic outliers that may have been the result of inaccurate data entry, to limit impact on findings.
Limitations
for this study, the influence of theft will not be considered.
Additionally, the availability of data impacted the results of this study. Geographic Information Science was used for mapping the distribution in a geographic spatial context to show relationships. Various types of spatial analysis were conducted using ArcGIS
CHAPTER TWO: REVIEW OF LITERATURE
A comprehensive literature review was conducted to guide this research. A
foundational understanding of community college is imperative to this study and served as the starting point for research. The topics that served as a focus within the subject included history and purpose of community colleges, access and barriers to community colleges, and transportation policies.
Purpose of Community Colleges
The inception of the California Community College began in the early 1900’s. In his piece titled The Junior College, or Upward Extension of the High School, C.L. McLane, the Superintendent of the Fresno City School District at the time, identified the need for college access in California in a geographic context. California is geographically large and the number of universities was insufficient; there were only two “great universities,” Stanford University and the University of California at Berkeley, at the time. This created a cultural hardship for students and families who were far from higher education campuses. Parents who sent their child to a university would have to travel far to visit and vice versa for the student- limited family time was a concern for educational leaders and politicians. Fresno leadership argued that “there is no institution of higher education within two hundred miles of Fresno where students may continue their studies beyond the regular high school courses” and many who wish to attend “cannot afford the expense necessary to college attendance” (McLane, 1913).
programs such as workforce education, certificates and degrees for vocational training, and transfer to four-year institutions. (“Chancellor’s Office Portal Home,” 2017). Chancellor Eloy Ortiz Oakley stated in the 2016 State of the System report, the CCCs the state faces many challenges, including “delivering a workforce that fuels our state’s changing economy.” He predicts a shortage of one million middle skilled workers (those who have credentials, certification and associates degrees) and of 1.1 million workers with a bachelor’s degree. He states that the CCCs are “well positioned” to wrestle these issues stating, “our colleges are the most powerful engines of social and economic progress in the state.” Together relationships with the University of California and California State
Universities will assist with transfer rates to address the lack of bachelor’s degrees, improve completion rates, close achievement gaps, and work towards more investment in public higher education (Oakley, 2016).
According to the Institute for Higher Education Leadership and Policy educational attainment is down in the State of California. Success of California is dependent upon an educated workforce, specifically the Latino population (Moore, Shulock, & California State University, 2010). Community colleges serve as the “entry point to higher education for youth and adults who are historically underrepresented in higher education” and serve more “first generation, part time, nontraditional age, low income, minority, and female students than any other type of public higher education institution” (Bragg & Durham, 2012). Kindergarten thru twelfth grade education for the underrepresented minority groups are more likely to have attended segregated, overcrowded schools with low concentration of qualified teachers and college preparatory curriculum, which hinders college success
completion rates for underrepresented minority students (Public Policy Institute of California, 2017).
Access and Barriers to Community College
Community colleges are often referred to as the “people’s college” and
“democracy’s college” due to role in expanding higher education enrollments and increasing educational opportunities (Dowd, 2003). In his presidential address to American
Educational Research Association (AERA) in 2013 William Tierney acknowledged that education in the 21st century has been “exceptional in the wrong way.” Education was once
an option for social mobility, but the United States now has less upward mobility and low-income continuance compared to other industrialized countries, thus “moving out of the poorest sector of society [has become] even harder.”
the researcher he feels that intellectuals are responsible in all areas and that education benefits the country, not just from training, but also from democratic engagement (Tierney, 2013).
Expanding on the ideas of Tierney, Scherrer (2014) respectfully states that educational reform has focused narrowly on one of the two components of poverty. He states that there are two dimensions of poverty; resource availability and ability to convert said resources to a usable form. Together these components of equality will result in equity. Educational reform typically is generated from a resource-based perspective, focusing solely on buffering of poverty through the provision of resources. A new lens is necessary to ensure success, one that includes a perspective of capabilities. This perspective identifies the value of the resource, which is dependent upon the individual’s ability to utilize. In addition to consideration of both variables of poverty and a different view, the Scherrer states that a collective or collaborate approach is necessary. This ensures that multiple organizations hold the responsibility of eliminating poverty. Ultimately the existence of poverty in society depends upon social and economic policy. Until reform is broadened and bolder, inequities will continue to come from the narrow-focused reform of the resource-based perspective (Scherrer, 2014). This collaborative effort is one that has been taken on by the community colleges.
consists of access, readiness, and success. The idea behind the implementation of specific programs is to “adopt an equity agenda that deliberately links access to college readiness, success would be more attainable by diverse student groups” (Bragg & Durham, 2012).
In addition to access issues, there are obstacles, or barriers that exist. Community college student success is difficult to measure (Sengupta & Jepsen, 2006). Barriers faced by students include the relationship of access to completion, equity gaps, linking access to readiness, students’ disconnect of readiness and aspirations, and importance of
understanding the community needs in policy formation (Bragg & Durham, 2012). Bragg and Durham (2012) state that the community colleges are stuck in a catch 22, with the pressure “to maintain open access while producing many more students who complete and receive a credential.” They do not support “the refocus of higher education from access to completion” as encouraged in national conversation by President Obama. They state that “by offering the primary pathway to higher education for historically underserved students, including learners who are underprepared for college-level coursework and who struggle to finish, community colleges diminish their chances of demonstrating success.” A shift in the interpretation of “college success” without acknowledgment of the interdependence of access and success would be devastating to the community colleges (Bragg & Durham, 2012).
Physical ability to access resources is addressed by transportation studies. Options for students to get to campus, to be in the classroom, to physically immerse oneself in the higher education environment, are an important component. There are two primary ways that students can participate in community college classes; on-campus or online. Low-income students face barriers to both. Accessibility to online learning environments is hindered affordability of technology as addressed by the digital divide (“The Digital
Divide,” n.d.). The ability to access the physical campus is another hindrance to low-income learners; “transportation is a major component of the cost of attending college” (Brown, Hess, & Shoup, 2001). Sanchez, Qing, & Zhong-ren, (2004) found that households
receiving Temporary Assistance for Needy Families (TANF) from the Department of Health and Human Services had low rates of vehicle ownership. Lack of vehicles has led to their dependency on public transit. If students fall into this category, then they too will benefit from assistance in transportation costs. Staff at Rio Honda Community College reported “that students were spending more on transportation expenses then they were on books,” which ultimately led to the launch of the GO RIO subsidized bus pass program (Martinez & Castañeda-Calleros, 2009).
University Transportation Policies
and a reduction in capital expenditure on transportation infrastructure” (Bond & Steiner, 2006).
Alternative transportation inclusion at universities is not a modern concept. After World War II suburban sprawl began to occur in many areas of the United States, including the San Francisco Bay area. The American Dream of single-family home ownership
corresponded with a move of land development away from the center of urban areas. Coinciding with the move in residences came the dependence on the automobile. Over time it has become the norm in many social groups to participate in single user vehicle
transportation, however this is not financially feasible for those who exist in the low-income bracket (Wheeler, 2009). During the 1960’s some universities implemented bus pass
programs. The idea moved slowly to more schools during the 1980’s, but gained momentum in the 1990’s because of transit system maturation, fiscal situations, student and
administrative goals. Today, transit programs at colleges include goals aimed at reduction in demand of parking, increased access to housing, employment, etc., reduction of congestion on campus in nearby neighborhoods (Transportation Research Board, 2001).
in predicting transportation needs considering campus needs and growth (Hess, Brown, & Shoup, 2004).
Universal access (UA) is beneficial to all stakeholder groups. According to Brown, Hess, and Shoup “unlimited Access reduces parking demand, increases students’ access to the campus, helps to recruit and retain students, and reduces the cost of attending college” (2001). Universities like UA because it reduces parking demand, increases student access to housing and employment, recruiting and retention of students, reduces the cost of
attendance, and increases transportation equity colleges. Universal Access also reduces vehicle travel and emissions, decreasing impacts of air pollution, resulting in support from the environmentally conscious. Improved air quality incentive- in areas that struggle with meeting the requirements of Clean Air Act (1990), some programs are able to use funding aimed at decreasing air pollution (Transportation Research Board, 2001). Increased mobility provides more opportunity for employment, internships, and other social, cultural,
educational, and recreational opportunities (Hess, Brown, & Shoup, 2004).
Hess, Brown, & Shoup (2004) have extensively researched universal access passes. In their study that looked at 35 universities in the United States, the authors found that universal, or fare free access was beneficial to students and transit agencies, through
evidence of increased ridership. Research has shown that characteristics of colleges such as town or city size, size of student population, and urban or rural location, do not influence universal access success, indicating that universal access is plausible for all types of college campuses. The Transportation Research Board National Research Council (2001) reinforces this, “although is it believed to be impractical in large urban areas, prepaid transit that would allow users unlimited access to high-quality service has been tried and proven successful in university communities through the country.” Provision of subsidized transit influences student behavior and has shown a shift from cars to buses for some users. Passes also “reduces parking demands, increases access to social services and employment, helps recruitment and retention, reduces costs of attendance, and increases transportation equity” (Balsas, 2003).
Offering transit passes shifts the “bus-car frontier,” which can be used to designate how many will utilize transit in addition to those who already do. Additional research has revealed that those who will choose to utilize universal access have a difference of value in time and money than those who do not. Thus, those who utilize universal access are more likely to be lower income students that have a lower value associated with time and/or do not have the extra income to offset time costs (Brown, Hess, & Shoup, 2001).
Florida, and the selected University of California, and California State Universities (Transportation Research Board, 2001; Brown, Hess, & Shoup, 2001).
The major issues in implementation of universal access include impacts on transit demand, equity of fee implementation, and fraudulent use of the system (Transportation Research Board, 2001).
The literature indicates that programs are beneficial, which is reflected in the high number of users after implementation. From the university vantage, these programs also decrease the demand for parking. Ultimately the users, and the greater community, benefit by reducing traffic and congestion by taking drive-alone riders off the road.
Eco Pass Policy
Eco Passes are a variation of universal pass programs, typically focusing on
employer-based transportation subsidies. These programs are offered by transit agencies in Dallas, Denver, Salt Lake, and San Jose. Employers pay the cost as the university would in a traditional universal access program. Similarly, this lowers the cost per individual in
comparison to the standard rates offered by the transit agency (Shoup, 2004). The benefits are similar as well. Eco Passes decrease the demand and need for parking, which can save employers money on capital costs. Eco Passes result in the same benefits to the transit agencies as well, providing a steady revenue source. Commuter studies in the Silicon Valley for companies that have implemented the Eco Pass have shown a decrease of 16% in solo-drivers, from 76% pre-implementation to 60% solo drivers post implementation (Hess, Brown, & Shoup, 2004).
agreement with the University of Washington that allows ticket holders for stadium events to use their tickets as a transit pass on game day. Analysis of ridership increased by five times after the implementation of the Eco Pass program in comparison to prior ridership for game day events. Internationally this concept has been used in sporting events as well, including the 2004 Athens Olympics and sporting events in German cities (Shoup, 2004).
Other industries that are utilizing subsidized transit passes are those of hospitality and residences. To decrease their parking demands and to encourage use of local transit, “transit-in-lieu-of-parking” arrangements are used by hotels. Coronado, California has a reduced parking requirement for the lodging industry if they offer guests free transit passes. This concept is also used in living communities and apartments. Cities can use the same strategy as Coronado in community developments. By including provisions or benefits to developers who incorporate free transit passes to the residents the requirements for parking are decreased. Developers are also encouraged to include transit amenities in the community to ease the use of transit. The inclusion of the transit passes is also used by the complex management to attract residents who have fewer vehicles and want to access transit lines (Shoup, 2004).
Overall, this literature suggests that the use of subsidized transportation increases student use of transit services. Community colleges are the largest providers of higher education to underserved students. Although most of the literature on subsidized transit has been studied in four-year university settings, less is known about the impact on community college student populations. Given the expressed purpose of community colleges in
CHAPTER THREE: METHODOLOGY
Research Questions
This research analyzes the characteristics of a sample of students who registered for subsidized bussing in a community college district. Understanding the predictors of Eco Pass adds to the greater knowledge of transit policies in higher education. The two main research questions were:
1. What geographic neighborhoods/communities are most likely to utilize Eco Pass to access the community colleges? What geographic neighborhoods/communities are least likely to utilize Eco Pass to access the community colleges?
2. Do the selected variables of median income, total population, crime index, household vehicle ownership or lease, or educational attainment alone or in combination predict Eco Pass use?
To answer the research questions data was collected from Foothill De Anza. Although the data was accessible through convenience sampling due to the relationship of the
researcher with the district, interest was the main driver for this research. The methods used in this study are grounded in geospatial analysis. Through the use of FLG theory,
Background: Foothill De Anza Community College District
The Foothill De Anza Community College District (FHDA) is home to 2 of the 113 other community colleges in the state of California (“Home Portal,” n.d.). However, this district is unique due to its location within the Silicon Valley. De Anza Community College resides in the affluent community of Cupertino, otherwise known as the home of Apple computers (Ha, 2015). As shown in figure 1, 92% of the surrounding community’s workforce is considered white-collar with the median household income being $119,980.
Figure 1. Environment Systems Research Institute Community Analyst output infographic for a ten-minute walking distance radius from the De Anza Campus.
These statistics fare well for a certain demographic of De Anza’s students, but the student population is not derived solely from this immediate and well-resourced area. In 2012, CNN reported that De Anza boasts over 70% success rates, making it one of three-dozen top-performing community colleges in the U.S. The article quoted President Brian Murphy, “many students drive past other community colleges to attend classes at De Anza” (Clark, 2012). This statement implies that there are alternative community college
choices in closer proximity to certain students, however despite an extended commute they choose De Anza because they desire a better education. Consequently, subsidized
Figure 2. Environment Systems Research Institute Community Analyst output infographic for a ten-minute walking distance radius from the Foothill Campus.
transportation passes are beneficial to low-income students who wish to access the campus for higher education and social services.
the town enjoys a median household income of $200,001 and 0% unemployment; 85% of the employment is categorized as white collar and 96% of community members have some higher education. Foothill College’s success rates are also similar to De Anza (Figure 2). Together these colleges exist in and serve some of the most affluent communities in Silicon Valley. Preliminary research reveals inequalities in income that exist along the Valley Transportation Authority transit routes. The income disparities between communities connected to the colleges through the transit network are displayed in Figures 3 and 4.
When the Associated Students of Foothill College presented the same transportation measure as DASB to their student body during the winter of 2013 it passed with 1,112 out of 1,333 votes (Foothill De Anza Community College District, 2013). Implementation of the Eco Pass program gave students from both colleges access to the large transportation network provided by Valley Transportation Authority (Figure 4).
The ability of student leaders to pass a subsidized bussing initiative demonstrates their understanding of the importance of social and economic diversity in their schools. However, increased research is necessary in order to more fully understand how transit passes
positively contribute to this diversity on community college campuses. Community colleges are the only branch of the California Higher education system that do not have extensive requirements for admission to ensure that higher education be available to “any student capable of benefiting from instruction” (“Admission Requirements,” 2012; UC office of the President, 2007).
Initial research of potential variables that may influence Eco Pass user-ship reveals that the Valley Transportation Authority transit network has a far reach not only
geographically, but also potentially socioeconomically as well (Figures 3 & 4). Median household income data from the U.S. Census reveals a diverse distribution of variation when added as a layer onto a geographic map. Exploration of the geographic distribution of the student population will allow for a better analysis than the use of flat, two-dimensional data. Based on this initial map there is a lot of opportunity for the Foothill De Anza
campuses to pull students from many different communities through the implementation of the Eco Pass. In addition to the social impacts of implementation, there is potential for impacts on the environmental and economic aspects as well.
Methods
This research utilized Geographic Information Science as the instrument for
(National Geographic Society, 2011). For this project, the data was collected from the Foothill De Anza Community College District. The data included: student address, college campus, and Eco Pass requests. This study included student data for students who were enrolled and requested Eco Passes at the corresponding college during the study period from Fall 2011 through Spring 2017.
Sample
The population of this study is students within community colleges who resided in modern suburban and exurban metropolis (Walker & Schafran, 2015). The characteristics of the population have a wide range due to the admissions policies of community colleges (California Community Colleges, 2012). Thus, the population consists of all ages that are able to attend the colleges. Purposive sampling will be used to collect the data through an export of data from the Foothill De Anza Community College District’s database.
Data Sources
Two data sources informed this study: Foothill De Anza Community College District provided data and ESRI data. The data collected from Foothill De Anza included Eco Pass requests, college campus, and student address locations. The ESRI data was used in the exploratory regression and was gathered from a web-based tool that allowed export of income, population, crime index, vehicle ownership or lease, and educational attainment from the United States census (Table 1) (ESRI Community Analyst, n.d.).
variable of population was expected to have an affiliation with Eco Pass usage because of the higher likelihood of accessibility to transit in densely populated areas. As stated by Cervero & Guerra, “[i]t is broadly accepted that fairly dense urban development is an essential feature of a successful public transit system.” Crime index data compiled by Environmental Systems Research Institute was used as a variable due to use avoidance of mass transit systems in areas of high crime (Spicer & Song, 2017). The ESRI crime index is
the result of a calculation which utilizes the primary crime reporting categories used by the Federal Bureau of Investigation- murder, rape, robbery, assault, burglary, theft, and motor vehicle theft (“Crime Indexes—Esri Demographics | ArcGIS,” n.d.). Household vehicle
Table 1.
Predictors of Eco Pass usage.
Exploratory Variable Data Source Hypothesis
2017 Median Income ESRI/
Census
Students using Eco Pass will more likely come from communities of lower income households 2017 Total Population ESRI/
Census
Denser populations or higher population per census block will most likely contain higher Eco
Pass use
2017 Crime Index ESRI/
Census
Students using Eco Pass will not likely come from communities with a higher crime index Household vehicle
ownership or lease
ESRI/ Census
Students using Eco Pass will most likely come from communities where vehicle availability is
relatively low 2017 Educational
Attainment
ESRI/ Census
Students using Eco Pass will most likely come from communities where educational attainment
is lower than that of the college communities
As shown in table 1, the relationship of Eco Pass user ship with the selected variables differs from a hypothesized positive to negative correlation. Of the selected variables, it was expected that Eco Pass would have a positive relationship with only with population. Research indicates that ridership increases with population. Population density is considered an “essential feature of a successful public transit system,” which influences the infrastructure development by transportation agencies. The ability of a transit system to succeed is dependent upon optimization of high ridership to offset costs (Cervero & Guerra, n.d.).
students are more likely to use subsidized bussing due to the financial savings, thus
indicating that lower income areas would result in higher Eco Pass usage (Brown, Hess, & Shoup, 2001). Similarly, the crime index was expected to impede on Eco Pass use due to the perception of crime associated with transit. The fear associated with the perception of crime can cause avoidance and whether the potential crimes are believed tooccur in the transit hub or during pedestrian access, the perception will impact use (Spicer & Song, 2017). Likewise, was the expectation that Eco Pass use would decrease with vehicle ownership and educational attainment. The convenience of having access to a personal vehicle led to the expectation that students would prefer to drive, rather than use Eco Pass. The likelihood of higher education levels in the community were expected to differ between the colleges and the users’ residences being that the colleges exist in highly educated areas.
Data Analysis
To better understand the social impacts relative to campus communities of Eco Pass implementation spatial statistical analysis was conducted. Use of descriptive statistics was used to quantify geographic mean and standard deviational ellipses. To determine whether Eco Pass usage by students was not geographically random, spatial autocorrelation was conducted. To predict the probability of Eco Pass use in specific geographic areas hotspot analysis was conducted. To assess the influence that the median income, total population, crime index, household vehicle ownership or lease, or educational attainment had on Eco Pass distribution, an exploratory regression was conducted to inform the ordinary least squares regression analysis. These methods are described in more detail below.
Initially the geographic distribution of all Eco Pass addresses was reviewed to
Hawaii and Washington, with potentially others. This outcome implied possible collection and entry errors exhibiting limitations within the provided data or perhaps these were permanent addresses of parents but not the residential addresses of the students. Since it is not feasible for students to access either of these colleges using the Valley Transportation Authority transit network in these locations. Through the use of a 30-mile buffer and dual hot spot analysis, outliers were removed.
To address the research questions, specialized spatial analysis tools within the ESRI spatial analysis were used. These included measurement of geographical distributions, analyzing patterns and mapping clusters, and modeling spatial relationships. Geospatial distribution patterns analyses were used to identify the location of the students who
requested Eco Pass at each of the colleges within the Foothill De Anza Community College District. To address the first research questions specifically, “What geographic
neighborhoods/communities are most likely to utilize Eco Pass to access the community
colleges? What geographic neighborhoods/communities are least likely to utilize Eco Pass
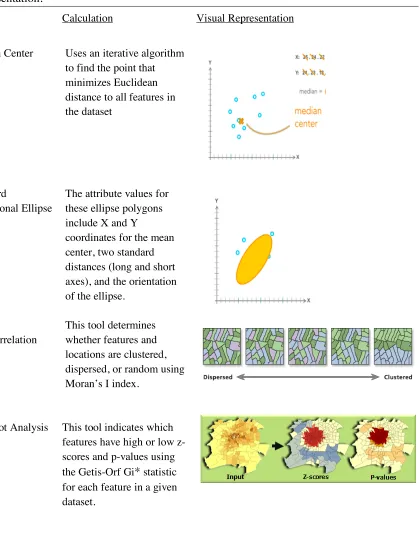
Table 2
Spatial statistics used in the Eco Pass analysis with calculation methodology and visual representation.
Tool Calculation Visual Representation
Median Center Uses an iterative algorithm
to find the point that minimizes Euclidean distance to all features in the dataset
Standard
Deviational Ellipse
Spatial
Autocorrelation
Hot Spot Analysis
The attribute values for these ellipse polygons include X and Y
coordinates for the mean center, two standard distances (long and short axes), and the orientation of the ellipse.
This tool determines whether features and locations are clustered, dispersed, or random using Moran’s I index.
This tool indicates which features have high or low z-scores and p-values using
the Getis-Orf Gi* statistic
The second research question focused on whether the selected variables of income, population, crime index, vehicle ownership or lease, and educational attainment were statistically significant predictors for Eco Pass use. This allows for a better understanding of the communities that students using Eco Pass come from and whether the Eco Pass policy is providing more access to communities that have been traditionally excluded from higher education. To achieve this exploratory regression was used. This tool within ArcGIS runs all possible combinations of the five selected variables to identify which combination, if any, best predict Eco Pass use. The informed output is then run through ordinary least squares regression to determine whether the effect, if any, is statistically significant.
Ethical Considerations
Summary
Analyzing programs affecting community college students is important in
CHAPTER FOUR: RESULTS
Introduction
This research seeks to analyze the characteristics of a sample of students who
registered to use subsidized bussing, Eco Pass, in a community college district. A thorough understanding of the selected predictors of Eco Pass usage contributes to higher education transit policy and access discourse. The two main research questions were:
1. What geographic neighborhoods/communities are most likely to utilize Eco Pass to access the community colleges? What geographic neighborhoods/communities are least likely to utilize Eco Pass to access the community colleges?
2. Do the selected variables of median income, total population, crime index, household vehicle ownership or lease, or educational attainment alone or in combination predict Eco Pass use?
Findings
Geographic Distribution of Eco Pass Users
Figure 5. Map showing median center by year for all Foothill De Anza Eco Passes.
Figure 6. Map showing median center by year for all Foothill and De Anza Eco Passes by year and campus.
Figure 7. Graph showing the distances, in miles, between the campus location and annual median.
Applying Tobler’s First Law of Geography to analyze the distances between campus location and median allows for interpretation of this data. The law states that as distance increases, so does similarity. This indicates that De Anza’s Eco Pass program use has increased over the selected time period for students from communities that are dissimilar to that of the college. Interestingly, Foothill has experienced fluctuations over time and ultimately users’ communities over the selected times are more similar to that of the college campus. Districtwide there has been an increase in distance over the study time beginning in 2011with a mean of 10.4 miles, a peak of 12.39 in 2016, and a decrease slightly to 11.46 in 2017.
The standard deviational ellipses shown in figure 8 reinforced the findings of the median center. Campus based analysis shows the distribution of Eco Pass users for De Anza to come from the South Bay area, whereas Foothill Eco Pass users are more inclusive of the peninsula. This information contributes to the first part research question one, “What
geographic neighborhoods/communities are utilizing Eco Pass access to community 2011 2012 2013 2014 2015 2016 2017 FH 5.61 4.51 4.21 5.31 5.26 4.97 4.35 DA 4.79 5.97 6.07 6.28 6.83 7.35 7.11 District 10.40 10.49 10.28 11.59 12.09 12.32 11.46
0 2 4 6 8 10 12 14 Mi le s
colleges?” Further inquiry was conducted to dive deeper into this question and to address the second part, “What geographic neighborhoods/communities are not utilizing Eco Pass to access community colleges?”
Figure 8. Map showing standard deviational ellipses, showing one standard deviation by year for all Foothill De Anza Eco Passes.
underlying phenomena impacting the distribution of the Eco Passes for the overall Foothill De Anza Community College District. Subsequently, a hotspot analysis was conducted to gain a better understanding of concealed patterns in the sample.
Figure 9. Map with results of spatial join showing Eco Pass count per California Census Block group at the regional level closest to the college campuses.
determine clustering, dispersion, or randomness. As shown in figure 10 the output indicated that Eco Pass distribution was clustered, thus indicating that Hot Spot Analysis could be conducted.
Figure 10. Results of spatial autocorrelation of Eco Pass counts for Foothill De Anza College District indicating clustering, non-randomness.
is most and least likely to occur, thus identifying which neighborhoods are more likely to use or not use Eco Pass for the overall district as posed in the first research question.
Figure 11. Map of hot spot analysis output based on the 99% confidence interval features of the region.
As with the overall district data, Eco Pass spatial distribution for each college was assessed to determine clustering, dispersion, or randomness to determine if Hot Spot analysis could be conducted independently at the college level. Spatial autocorrelation was conducted on both Foothill and De Anza Eco Pass users separately, which resulted with both data subsets revealing clustering, with a p value of zero and z scores of 63.14 and 122.39 respectively. This satisfied the criteria for spatial autocorrelation and allowed for continuation of Hot Spot analysis at the campus level.
Figure 12. Map of hot spot analysis of the 99% confidence interval features of the Eco Pass distribution for Foothill only.
program management. Perhaps Foothill college needs a transit program that aligns more closely with their current student needs, or maybe they would like to encourage more
enrollment from areas not currently served by Eco Pass. If the second were true and the need at De Anza is greater, then it would be advised that campus leaders to strengthen the support of students with transportation needs.
Figure 13. Map of hot spot analysis of the 99% confidence interval features of the Eco Pass distribution for De Anza only.
Demographic variables and their impact on Eco Pass usage.
Modeling relationship tools within ArcMap were used to address the second research question addressing the influence of median income, total population, crime index,
household vehicle ownership or lease, and/or educational attainment on Eco Pass use. ArcMap’s Spatial Statistics tool of exploratory regression was used to select the
combination of variables that were best predictors of Eco Pass usage to run in an ordinary least squares regression. A subset of variables, including median income, total population, crime index, household ownership, leasing of vehicle, and educational attainment were the selected because of their connection to community needs. These variables were
hypothesized to predict Eco Pass usage. Lower median income is hypothesized to predict greater Eco Pass usage because lower income populations are less likely to own cars and more likely to need transportation subsidies. Population was used because increased traffic occurs in areas of high density, indicating that students that reside in denser areas may be more likely to use subsidized transit. Crime index was hypothesized to predict Eco Pass usage because students might be less likely to use Eco Pass in areas of higher crime for fear of safety (Ferrell, Mathur, Meek, & Piven, 2012). Vehicle ownership or lease was used because use of Eco Pass is hypothesized to be less likely for someone who has access to a vehicle. Lastly, educational attainment was selected as an oft-used proxy for
portion of the district population (“California Community Colleges Chancellor’s Office - Data Mart,” n.d.).
Exploratory regression was used to determine if the selected variables could have influencedEco Pass count. This tool ran all possible combinations of the explanatory variables to find which variable(s) passed the ordinary least squares regression diagnostic requirements. Then the selected variable(s) were run for the Eco Pass count at the 99% hot and cold spots as represented in figure 11. This initial inquiry eliminated the variable of educational attainment and the OLS was conducted using the variables of median income, total population, crime index, and household ownership, or leasing of vehicle.
Explanatory regression for the hot spot output did not reveal any models with an R2
greater than .014, indicating a poor fit and tells us that combinations of the variables of median income, total population, crime index, and household ownership, or leasing of vehicle only explain at most 14% of Eco Pass requests. Analysis for the hot spots revealed a higher R2 with a maximum of 0.24 for combinations that met the additional criteria for OLS.
The cold spots output was the lowest of all the explanatory assessments, with the highest R2
of 0.02.
As was indicated in the exploratory regression output, the adjusted R2 of the OLS
performed on the collective data over all years equaled 0.24 with the multiple R2 of 0.26
Table 3
Ordinary Least Squares Regression output.
Coefficient t-statistic Probability
Intercept -7.69 -0.47 0.64
Median Income 0 -0.92 0.36
Population 0.02 2.00 0.048*
Crime Index 0.16 1.93 0.06**
Vehicle 0.01 0.30 0.77
* p<0.5 level
** indicates borderline results at p<0.5 level
Lack of statistical significance in the relationship between Eco Pass and median income or vehicle attainment is a finding itself. Interestingly, these variables are identified in the research as a means of assessing potential subsidize bussers, however the findings of this research indicate that although low income and students without vehicle access may use the Eco Pass, others do as well, and that income and lack of vehicle are not statistically significant predictors of Eco Pass requests.
Overall, the lack of statistical significance of the selected variables provides insight. The fact that educational attainment, median income, and vehicle attainment do not predict Eco Pass use for the Foothill De Anza Community College District implies that the
environmental impact of subsidized bussing may be more substantial than the social impacts of campus access for low socioeconomic students. Median income and vehicle ownership are not predictors of Eco Pass use, which indicates that the implementation of Eco Pass is used by a variety of students from different communities with varying characteristics. This is important because it indicates that the students who are using Eco Pass are not solely those who have the least access to college but includes a wide range of students.
Summary of Findings
Overall the finding of this study include:
• Foothill De Anza district geographic mean of Eco Pass requests shifted eastward during
period of analysis.
• Per college, the mean for Foothill fluctuated between the Sunnyvale and Mountain View
areas while De Anza mean moved eastward.
• Distance between Eco Pass request addressees was initially greatest for Foothill.
However, immediately it decreased with an increase in 2014, but never regaining the initial distance of 2011. In contrast De Anza had a steady increase in distance over the study period.
• Standard deviational ellipses reinforced the median data per campus, indicating a
stronger representation of Eco Pass students for Foothill college in the peninsula
• Eco Pass requests are clustered indicating an underlying phenomenon at play.
• The area closest to De Anza college campus is where the majority of Eco Pass students
live, with two patches of representation elsewhere. These patches are located in the east area of San Jose and the Mountain View area.
• Individual campus hot spot analysis failed to showed any geographic significance for
Foothill Eco Pass usage, whereas De Anza showed strong geographic significance throughout the study parameter of 30 miles.
• Exploratory regression of selected variables showed no predictive capabilities of
variables including median income, educational and vehicle attainment. Population and to some extent crime index resulted in significance (or borderline significant), but the stationarity requirement of the model was not met. Additionally, the residuals were not randomly distributed, thus determining any combination of the variables as
non-predictive.
Through the use of geospatial analysis, the two research questions were answered. Findings revealed that there is a difference in Eco Pass users based on campus, there are differences in community demographics between likely and unlikely Eco Pass users, and the selected variables of median income, population, crime index, vehicle access, and
CHAPTER FIVE: DISCUSSION OF FINDINGS
Understanding the use of Eco Pass at Foothill De Anza Community College District is important to the overall knowledge of transit policy and equity access at community colleges. Proponents of Eco Pass policies have argued that these policies can reduce harmful emissions, reduce parking and traffic congestion, and provide increased access to community college education to low-income and students of color. This study tested these arguments by using geo-spatial analysis of Eco Pass users addresses at two community colleges during a seven-year span of implementation.
Discussion of findings
Using measurement of distance between annual medians and college campus and Tobler’s first law, the district overall had an increase in distance with the implementation of the Eco Pass. De Anza is pulling in more students who reside in communities that differ from the college community, more so than Foothill. The influence of De Anza users on the district distribution is understandable due to the college’s close proximity to the largest web of transit infrastructure. Differentiation between the college communities and that of Eco Pass users is ultimately the greatest for De Anza college.
The impact of Eco Pass users from De Anza was observed in the hot spot analysis conducted for each of the colleges. Hot spot analysis for the Foothill sub sample
Foothill may want to focus on other alternatives to transportation, while De Anza may benefit more from Eco Pass marketing due to the high probability of Eco Pass use throughout a large geographic area.
The second research question was answered through the regression analysis. This study indicated that selected variables of median income, total population, crime index, household vehicle ownership or lease, and educational attainment do not predict Eco Pass use for the two community colleges in this study. Analysis showed the selected variables in any arrangement do not predict Eco Pass use. Although the variables lacked predictive power, they do provide insight. Ultimately, the regression analysis revealed that
predicting Eco Pass use is complicated. The study suggests that Eco Passes are being used by a wide range of students, not just those in low socioeconomic groups. This may be due to the unique nature of the cost of living in the Silicon Valley, where many high paid technology employees are struggling themselves ((“Scraping by on six figures? Tech workers feel poor in Silicon Valley’s wealth bubble | Technology | The Guardian,” n.d.).
that many students from differing communities utilize the bus pass program, not exclusively students from lower income communities.
This research confirms that Universal Access is beneficial to all stakeholders as stated by Brown, Hess, and Shoup (2001). Social benefits to specific groups may be difficult to determine, as revealed in this research, and further research is needed. However, this research did not support the idea that Eco Pass provides more access to the colleges for specific groups. Overall the environmental benefits of Eco Pass implementation are beneficial to many. Providing subsidized transit decreases traffic, parking demand, and pollution, and increases access for many. Combined, a lower carbon footprint and subsidized transit at Foothill De Anza are contributing positively to a healthier and more equitable future. Ultimately, whether environmentally minded subsidized bussing programs provides social benefits was not determined by this study.
Implications for Practice
The results of this study are beneficial to the Foothill De Anza Community College District and the corresponding colleges. As a result of the research there is now a better understanding of the geospatial dynamics that underlie Eco Pass use. Based on the analysis conducted in this study, there are different recommendations per campus.
Foothill College