SPATIAL POOLER
by
Paul Jeffrey Mitchell
A thesis
submitted in partial fulfillment of the requirements for the degree of
Master of Science in Electrical & Computer Engineering Boise State University
DEFENSE COMMITTEE AND FINAL READING APPROVALS
of the thesis submitted by
Paul Jeffrey Mitchell
Thesis Title: A Novel FPGA Implementation of Hierarchical Temporal Memory Spatial Pooler
Date of Final Oral Examination: 30 October 2018
The following individuals read and discussed the thesis submitted by student Paul Jeffrey Mitchell, and they evaluated the student’s presentation and response to questions during the final oral examination. They found that the student passed the final oral examination.
Nader Rafla, Ph.D. Chair, Supervisory Committee
Jennifer A. Smith, Ph.D. Member, Supervisory Committee
Hao Chen, Ph.D. Member, Supervisory Committee
v
vi
space require large sets of labeled data to first train, and then classify inputs. Hierarchical Temporal Memory (HTM) is a biologically inspired machine intelligence framework which aims to classify and interpret streaming unlabeled data, without supervision, and be able to detect anomalies in such data.
In software HTM models, increasing the number of “columns” or processing elements to the levels required to make meaningful predictions in complex data can be prohibitive to analyzing in real time. There exists a need to improve the throughput of such systems. HTMs require large amounts of data available to be accessed randomly, and then processed independently. FPGAs provide a reconfigurable, and easily scalable platform ideal for these types of operations. One of the two main components of the HTM architecture is the “spatial pooler”. This thesis explores a novel hardware implementation of an HTM spatial pooler, with a "boosting" algorithm to increase homeostasis, and a novel classification algorithm to interpret input data in real time. This implementation shows a significant speedup in data processing, and provides a
vii
DEDICATION ... iv
ACKNOWLEDGEMENTS ... v
ABSTRACT ... vi
LIST OF TABLES ... xi
LIST OF FIGURES ... xiii
LIST OF ABBREVIATIONS ... xv
CHAPTER 1: INTRODUCTION ... 1
1.1 Motivation: The Demand for Smarter Machines ... 1
1.2 Research Goals ... 2
1.3 Evaluation Methodology... 3
1.3.1 Software Implementation ... 3
1.3.2 Verilog and Simulation ... 3
1.3.3 FPGA Implementation ... 4
1.4 Metrics ... 4
1.4.1 HTM Spatial Pooler ... 4
1.4.2 Classification Algorithm ... 5
1.5 Organization of the Thesis ... 6
CHAPTER 2: LITERATURE REVIEW ... 8
viii
2.3 Temporal Pooler ... 15
2.3.1 Phase 1: Activation ... 16
2.3.2 Phase 2: Overlap / Prediction ... 17
2.3.3 Phase 3: Learning... 18
2.4 Classification of Sparsely Distributed Representations... 19
2.4.1 Support Vector Machines ... 20
2.4.2 Union Overlap ... 20
2.5 HTM Spatial Pooler Hardware Implementations ... 22
2.5.1 Logical Implementation ... 24
2.6 MNIST Database of Handwritten Digits ... 26
CHAPTER 3: DESIGN METHODOLOGY... 28
3.1 Overview ... 28
3.2 HTM Boosting ... 28
3.3 Online Classification ... 29
CHAPTER 4: HARDWARE IMPLEMENTATION ... 33
4.1 Overview ... 33
4.2 Primary Finite State Machine ... 34
4.3 Linear Feedback Shift Register ... 36
ix
4.6 Classification Logic ... 44
CHAPTER 5: RESULTS ... 48
5.1 Overview ... 48
5.2 Software ... 48
5.2.1 Number of Columns ... 50
5.2.2 Synapses per Column ... 51
5.2.3 Permanence Threshold ... 51
5.2.4 Inhibition Radius ... 52
5.2.5 Variable Minimum Overlap ... 53
5.2.6 Boosting ... 54
5.2.7 Minimum Overlap... 55
5.2.8 Span ... 55
5.2.9 Final Parameters for Hardware Configuration ... 56
5.3 Hardware ... 58
5.3.1 Classification Methods Results ... 59
5.3.2 Hardware Parameter Sweep ... 59
5.3.3 FPGA Resources ... 61
5.4 Comparison ... 64
5.4.1 Spatial Poolers ... 64
5.4.2 Classifiers ... 65
CHAPTER 6: CONCLUSION ... 67
x
xi
Table 1: Parameters used for Spatial Pooler (from Zyarah & Dhireesha, 2015) ... 23
Table 2. Classification registers initial values ... 46
Table 3. Software parameter sweep ... 50
Table 4. Number of columns software sweep ... 51
Table 5. Synapses per column software sweep ... 51
Table 6. Permanence threshold software sweep ... 52
Table 7. Inhibition radius software sweep... 53
Table 8. Variable min overlap software sweep ... 54
Table 9. Boosting software sweep ... 54
Table 10. Minimum overlap software sweep ... 55
Table 11. Span software sweep ... 56
Table 12. Final software experiment parameters ... 57
Table 13. Final software experiment results ... 57
Table 14. Scaled union overlap versus union overlap ... 58
Table 15. SVM vs. hardware SUO (%)... 59
Table 16. SVM accuracies with hardware vectors (%) ... 60
Table 17. SUO accuracies with hardware vectors (%) ... 60
Table 18. Hardware versus software SP ... 64
xii
Table B.5 Boosting disabled RAM utilization ... 77
Table B.6 Boosting disabled DSP utilization ... 77
Table B.7 Classification disabled LUT utilization ... 77
Table B.8 Classification disabled RAM utilization ... 78
xiii
Figure 1. System Level Diagram ... 4
Figure 2. Levels of hierarchy in an HTM (from Numenta, 2011) ... 10
Figure 3. Multi-input HTM network (from Numenta, 2011) ... 11
Figure 4. Topology of an HTM region (from Numenta, 2011) ... 12
Figure 5. SP Phase 1 pseudo-code (from Numenta, 2011) ... 13
Figure 6. SP Phase 2 pseudo-code (from Numenta, 2011) ... 14
Figure 7. SP Phase 3 pseudo-code (from Numenta, 2011) ... 15
Figure 8. Temporal pooling (from Numenta, 2011)... 17
Figure 9. Temporal pooling phase 2 ... 18
Figure 10. Inhibition comparison ... 24
Figure 11. RTL representation of a column... 25
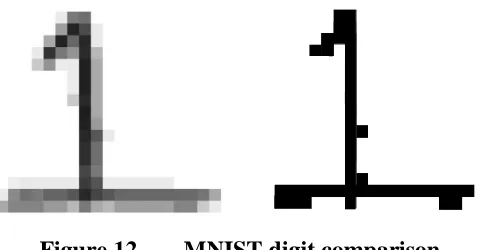
Figure 12. MNIST digit comparison ... 27
Figure 13. Scaled Union Overlap vs. regular union overlap ... 30
Figure 14. Scaled Union Overlap pseudo-code ... 31
Figure 15. Modified scaled union overlap pseudo-code ... 32
Figure 16. Primary FSM diagram ... 35
Figure 17. Column input mapping ... 37
Figure 18. Valid rang of input bits ... 38
xiv
Figure 24. Union vector SRAM ... 47
Figure 25. Classification logic ... 47
Figure 26. SUO accuracy surface plot... 61
xv
HTM Hierarchical Temporal Memory
SDR Sparsely Distributed Representation
ML Machine Learning
AI Artificial Intelligence
FPGA Field Programmable Gate Array ASIC Application Specific Integrated Circuit
SVM Support Vector Machine
UO Union Overlap
SUO Scaled Union Overlap
HDL Hardware Description Language
CPU Central Processing Unit
GPU Graphical Processing Unit
LUT Look-Up Table
DSP Digital Signal Processor/Processing
RAM Random Access Memory
SRAM Static Random Access Memory
SP Spatial Pooler
TP Temporal Pooler
LFSR Linear Feedback Shift Register
CHAPTER 1: INTRODUCTION
1.1 Motivation: The Demand for Smarter Machines
The field of artificial intelligence has been explored since the mid 1950's, but has made a recent resurgence into mainstream society [1]. Technology companies have begun marketing their products based on their use of hardware designed specifically to perform Artificial Intelligence (AI) tasks. Throughout 2016 and 2017, the technology company NVIDIA has pivoted their primary focus from video gaming hardware, to hardware accelerated neural networks. Apple has led the smartphone industry by incorporating dedicated neural network hardware directly on their SoCs in their 2017 flagship products. Qualcomm has followed suit and included similar hardware in some of their top-of-the-line SoCs. Even enterprise level datacenters are moving to using ASICs and
reconfigurable hardware to implement machine learning algorithms for the performance, cost, and environmental benefits [2].
large number of simple operations on large sets of matrices during training.
Consequently, GPUs are a popular choice as an alternative to commercially available CPUs for performing these computations. For instance, the popular machine learning platform TensorFlow from Google utilizes GPUs for training many of its machine learning models [4]. Whereas GPUs do provide several benefits over CPUs [5], like performance per core, and performance per Watt, when it comes to performing only one specific type of algorithm, an FPGA or ASIC in many cases will provide even greater performance, while using less power. [6, 7]
1.2 Research Goals
This thesis will describe and evaluate the effectiveness of a novel implementation of the Hierarchical Temporal Memory (HTM) spatial pooler model [8] on reconfigurable hardware. The novel elements include:
1. Pipelining between the "Phase 1" and "Phase 2" portions of the algorithm 2. FPGA implementation of the HTM "boosting" algorithm, and
3. Development and implementation of a new online classification algorithm called "Scaled Union Overlap"
To achieve this goal, the HTM algorithm was first built in software and parameterized, and then translated to synthesizable Verilog, a common hardware description language [9]. This model was then simulated and verified before
MNIST dataset [11] was used to verify the functionality of the hardware and its ability to implement the HTM algorithm as well as the classifier's accuracy relative to conventional software means.
1.3 Evaluation Methodology
This section describes the strategy which was used to evaluate the performance of the novel components of this work. In addition to the steps taken, the software and HDL tools are presented.
1.3.1 Software Implementation
To establish the effectiveness of the HTM algorithm to be implemented on the FPGA, it was built, verified, and validated in software using Python for its ease of
development, object-oriented nature, and speed. On the other hand, the new classification algorithm was implemented using a Perl script. A support vector machine library called LIBSVM [12] was used to validate the effectiveness of the spatial pooler's ability to extract meaningful features, and to benchmark the new classification algorithm. 1.3.2 Verilog and Simulation
Verilog HDL will be used to create a synthesizeable version of the spatial pooler and classification algorithm. The Xilinx IDE Vivado will serve as the synthesis / PNR tool. Simulations were run with the open source software Icarus [13] for its cross
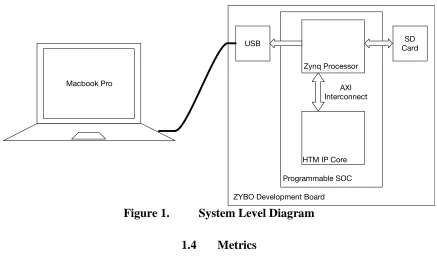
and status communicated via UART to a terminal on an external machine. The output of the system was written to an SD card, and transferred to a Macbook Pro for analysis (see Appendix A for specifications). Figure 1 illustrates the connectivity between the HTM core and the external system.
Figure 1. System Level Diagram
1.4 Metrics
1.4.1 HTM Spatial Pooler
The spatial pooler was evaluated based on four primary metrics: speed, energy consumption, resources, and feature extraction. Speed is measured by the number of training samples the spatial pooler will be able to process each second, and is denoted by
𝑓(𝑠𝑡, 𝑡) as shown in equation 1.
𝑓(𝑠𝑡, 𝑡) = number of samples training time =
𝑠𝑡
𝑡
The speeds for the software and hardware implementations are calculated using equation 1, and compared.
Energy consumption is measured in Joules per sample, and is calculated based on the total training time, number of training samples, and average power.
𝐸(𝑃𝑎𝑣𝑒, 𝑡, 𝑠𝑡) =average power × training time number of samples =
𝑃𝑎𝑣𝑒𝑡 𝑠𝑡
( (2) The average power used for the software simulation is found by taking the
average power consumed while simulating the HTM on the Macbook, and subtracting the average power measured while the system is idle. For comparison, the average power for the FPGA based solution is measured directly. In both cases, the same power
measurement device is used, which has a claimed typical error rate of 0.5% [15]. The resources metric only applies to the hardware implementation, and is a measure of the physical resources used by the FPGA implementation. These resources consist of: (a) number of lookup tables (LUTs), (b) number of slice registers (slices), (c) number of DSP slices, and (d) number of block RAMs used. The feature extraction metric is an indication of the ability of the system to encode the features of a dataset in a meaningful way. It is represented as a percentage of correctly classified samples, and is used to compare both the hardware and software implementations.
1.4.2 Classification Algorithm
𝑓𝑐(𝑡, 𝑡𝑐, 𝑠) =
time /w classifying - time /wo classifying= 𝑡𝑐− 𝑡
The value of 𝑓𝑐 represents the frequency in samples per second that the classifier can operate. If 𝑃𝑎𝑣𝑒,𝑐 represents the average power consumed during classification, then the energy consumed classifying each sample can be written as:
𝐸𝑐(𝑃𝑎𝑣𝑒,𝑐, 𝑃𝑎𝑣𝑒, 𝑡𝑐, 𝑡, 𝑠) =𝑃𝑎𝑣𝑒,𝑐𝑡𝑐 − 𝑃𝑎𝑣𝑒𝑡 𝑠
(4)
The final metric to compare classification algorithms is the classification accuracy. For a given set of vectors, each of which belong to one of a discreet set of classes, the classifier is measured by its ability to correctly identify to which class each vector belongs. The percentage of correctly identified vectors will indicate the
effectiveness of the classification algorithm.
𝐴 = 100 ×correctly identified vectors
total vectors classified = 100 × 𝑐 𝑠𝑐
(5)
1.5 Organization of the Thesis
The rest of the thesis is organized as follows
Chapter 2 discusses the related literature in the fields related to Hierarchical Temporal Memory, Spatial Pooler, and Temporal Pooler.
Chapter 3 details the design methodology for the Hierarchical Temporal Memory Spatial Pooler.
Chapter 5 discusses the software and hardware results obtained along with the experiments, verification, and tests performed.
CHAPTER 2: LITERATURE REVIEW
2.1 Hierarchical Temporal Memory
Hierarchical Temporal Memory, or HTM, is a biologically inspired theory of intelligence maintained by the privately funded company Numenta. It is based on the cortical learning algorithm, or CLA, described by John Hawkins and Sandra Blakeslee in their book "On Intelligence" [16]. The basic algorithm involved in HTM falls within the deep learning family of machine learning. The goal of HTM is to model the operation of the mammalian neocortex, and in time to help researchers understand the nature of human intelligence through building machines capable of replicating it. The HTM spatial pooling algorithm was created by Numenta, and is described by Hawkins and Subutai in their whitepaper titled “Hierarchical Temporal Memory including HTM Cortical
Learning Algorithms” [8].
The fundamental unit of the HTM model is a cell. A cell is an abstraction of a physical cell in the brain, or a neuron. HTM cells have many similarities with biological neurons, such as; they have feed forward, as well as lateral I/O connections, each is either “active” or “inactive” at a given point in time, the strength of the I/O connections is updated based on both current inputs, as well as previous inputs, and both exhibit a form of local inhibition to nearby cells. In the interest of simplifying the model, some
Cells are arranged into groups called “columns”. The name columns comes from the physical orientation most neurons have in the neocortex of mammalian brains.
Columns are an abstraction for a group of cells, and are the fundamental unit of the HTM spatial pooler. Each cell in a particular column shares its feed forward input with that of the other cells in the same column. A column can be considered active if the number of connected active inputs is greater than a particular threshold, and that number is greater than that of all other columns in its inhibition radius.
Groups of cells which share a common input space, and which can inhibit one another, make up a region. The use of an activation threshold as well as local inhibition of cells ensures that regions should always maintain a sparsely distributed representation (SDR) of the input. An SDR is a vector in which relatively few elements are non-zero. HTM SDRs maintain a sparsity of about 10%.
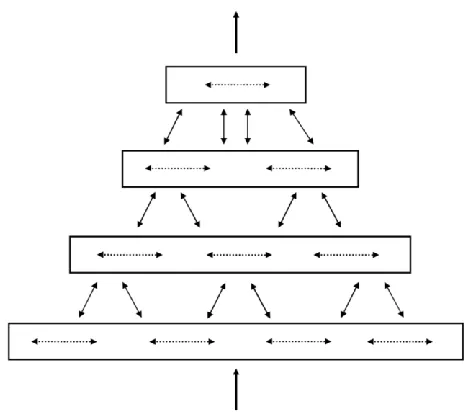
Figure 2. Levels of hierarchy in an HTM (from Numenta, 2011)
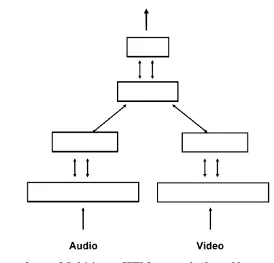
Figure 3. Multi-input HTM network (from Numenta, 2011)
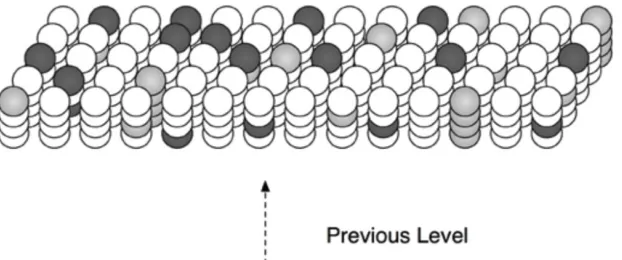
Typically, HTM regions are two-dimensional arrays of columns. Using two dimensions of columns most closely resembles the structure seen in the neocortex, but the number of dimensions are not restricted to two. The implementation discussed in this work treats the columns as a one-dimensional array of columns. Each column consists of multiple cells. All cells within a column share the same feed-forward input, but each individual cell will have a large number of its own set of distal connections to other cells in the region. A column is considered active if at least one of its cells is active. The activation of columns indicates spatial information about the input, and the activation of the individual cells contains the temporal context.
Figure 4 shows an array of columns forming a small region, each with four cells. The activated cells are shown in dark blue. The number of unique temporal contexts 𝑋
Figure 4. Topology of an HTM region (from Numenta, 2011)
𝑋 = cells per column2− 2 = 𝑐2− 2 (6)
2.2 Spatial Pooler
The spatial pooler is responsible for determining which columns within a region will be active given the state of the input. Each column is connected to only a subset of the inputs to the region. This connection, also referred to as a synapse due to its
biological counterpart, is represented with a scalar value called permanence. The permanence of a synapse is similar to the weights which are associated between connected processing elements in artificial neural networks. However, in the HTM model, synapses have only a binary weight, either 0 or 1, based on the synapse’s permanence being either above or below a certain threshold. Synapses below the threshold are labeled as "potential synapses", whereas those above the threshold are "functional synapses".
input, as well as the initial permanence. The mean of the initial permanencies should be close to the connectivity threshold, giving roughly the same number of functional synapses as potential synapses.
2.2.1 Phase 1: Overlap
In the first phase of the spatial pooling algorithm, the activation, or overlap, of each column is computed by summing all synapses in which the synapse permanence is above the threshold, and the input bit is active. Optionally, the overlap may be scaled by a "boosting" factor. Figure 5 shows the pseudo-code for this phase.
Figure 5. SP Phase 1 pseudo-code (from Numenta, 2011)
2.2.2 Phase 2: Winner Selection
Figure 6. SP Phase 2 pseudo-code (from Numenta, 2011)
2.2.3 Phase 3: Learning
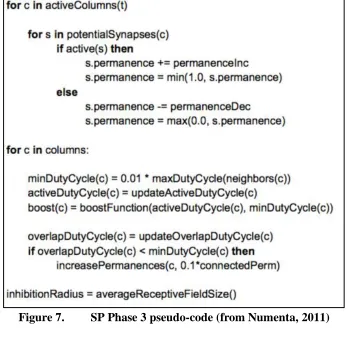
Once the winners are selected, the learning begins in "Phase 3". Learning occurs simply by adjusting the permanencies associated with each synapse of only the winning columns. For each synapse for every winning column, if the input bit was a 1, the permanence is increased. If the input bit of the synapse was a 0, the permanence is decreased. In this way, the correlation between the activation pattern and its
Figure 7. SP Phase 3 pseudo-code (from Numenta, 2011)
The first loop updates the permanence values for those columns which were deemed as winners in Phase 2. The second loop updates the duty cycles for each column, and uses those duty cycles to compute the boost factors. HTM can be used either in an "online" or "offline" learning methodology by choosing whether or not Phase 3 occurs continuously, or is disabled after training is complete.
2.3 Temporal Pooler
during the learning phase. 2.3.1 Phase 1: Activation
Temporal pooling begins where spatial pooling ends, with a set of active and inactive columns representing the current input. The temporal pooler will first determine which, if any, of the cells in the active columns are in a predictive state. The predictive state of the cells would have been set in phase 2 of the previous iteration of the temporal pooler. If no cells in an active column are in the predictive state, as is the case with all columns in the first iteration of the temporal pooler, then all of the cells in such a column are activated. When all of the cells in a column are activated, this represents an
unexpected event, possibly a transition that has never been observed before by the HTM. When a large ratio of the active columns have all of their cells activated, an anomaly has occurred in the temporal sequence. In each column, a cell is selected as being the
"learning cell" for phase 3 based on the activation of the previous time-step. The cell which contains the dendrite segment with the highest overlap with the previous activation is chosen to be the learning cell.
Figure 8. Temporal pooling (from Numenta, 2011)
2.3.2 Phase 2: Overlap / Prediction
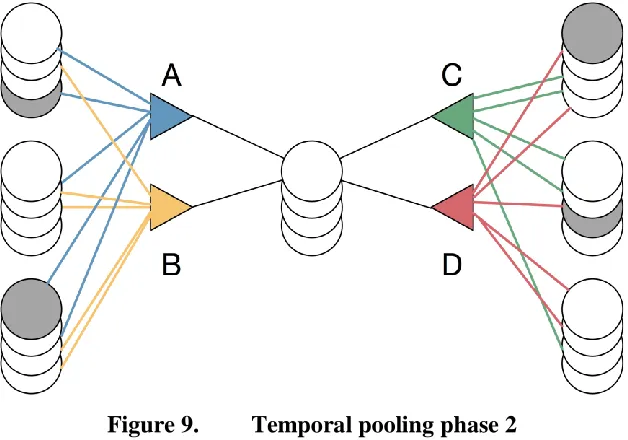
Phase 2 of the temporal pooler is similar to the overlap phase of the spatial pooler. Each cell has a number of its own synapses, but instead of being connected to the input space, these synapses are connected to other cells in the region. The synapses for a cell are grouped together into several "dendrite segments". The number of dendrite segments per cell is small in comparison to the number of synapses per dendrite segment. For each dendrite segment, the potential synapses are tested against a threshold. The synapses whose permanence is higher than the threshold are considered functional. The overlap of a dendrite segment is the sum of all of the functional synapses connected to cells in the active state. Here, the active state means a cell is active only due to feed forward input, and not simply in the predictive state. If the overlap of any of the dendrite segments for a cell is above a threshold, then that cell is put into the predictive state for the next time step.
and D is one. B and C are both zero. If the minimum activation for a dendrite segment were two or less, this cell would be placed in the predictive state for the next time-step.
Figure 9. Temporal pooling phase 2
2.3.3 Phase 3: Learning
The learning phase of the temporal pooler iterates through every cell, and checks for two conditions:
1. If the cell was previously selected as the learning cell in its column, then each of the synapses on that learning cell are reinforced by increasing their permanence, but only if the synapse is connected to a cell which was activated in the previous time step. 2. If it was not a learning cell, and not currently in the predicted state, but in the
Case 1 reinforces the correlation between the previous state and the activation of the updated cells. The result being that the next time the activation pattern from the previous time step is seen, the current activation pattern will be predicted. Case 2 looks for instances where the previous iteration of the temporal pooler incorrectly predicted that a cell would become active, but it did not. Decreasing the permanencies for these cells decreases the likelihood of another false positive.
2.4 Classification of Sparsely Distributed Representations
A sparsely distributed representation is an encoding of data using a vector in which a small minority of its elements are non-zero. When the dimensionality of the vector is sufficiently large, there can be a relatively large number of possible encodings with only a small percentage of non-zero elements. For instance, a bit string of length 512 can represent more than 287 billion possible values when only 5, or less than 1%, of its bits are 1. The sparsity of an SDR is computed using the following equation.
Sparsity =𝑤 𝑛
(7) where n is the total number of elements, and w is the number of non-zero elements. The number of unique encodings possible with an SDR is given by equation 8:
Unique SDR encodings = 𝑛! 𝑤! (𝑛 − 𝑤)!
classified using some other type of classification algorithm. 2.4.1 Support Vector Machines
Support vector machines (SVMs) aim to classify n dimensional data points by separating the data points using n dimensional hyperplanes to bifurcate them into bins. In cases where an n dimensional hyperplane is not sufficient, the data points are transformed to a space in which they are able to be ideally separated with hyperplanes. This is known as the "kernel trick." For an HTM SDR of n bits, an n dimensional SVM can be used [18]. This is a common method used to compare spatial pooler accuracy [19, 20]. 2.4.2 Union Overlap
The union overlap method described by Ahmad and Hawkins in their paper [21] is a method specifically designed for the classification of HTM output activation patterns. The method involves first taking the union of a certain number of output patterns that are all are associated with the same class. Then, to determine if an output pattern belongs to that class, the dot product of the output vector and the union vector is taken, and, if it is greater than a threshold, the input is deemed a member of the class. The three primary benefits to this method versus an SVM for a hardware implementation are:
2. Only simple addition, comparison, and bitwise operations on unsigned integers is required.
3. Recomputing the union vectors can be done online whenever labels are available to adapt to a changing HTM, thus enabling a dynamic classifier suitable for an online application.
the implementation described by Zyarah and Kudithipudi in their work titled
"Reconfigurable Hardware Architecture of the Spatial Pooler for Hierarchical Temporal Memory" [20]. In this implementation, they introduce the concept of a "synthetic synapse". In HTM, each column is connected to many, sometimes thousands, of bits in the input vector. In hardware, having thousands of nets in the fan-in to each and every column's processing logic would be prohibitively complex from a routing perspective. Instead of having individual physical connections between the inputs of each column, the input address and permanence value for each synapse is stored in a memory element, in their case a 64-byte RAM for each column. During Phase 1 of the HTM spatial pooling algorithm, for every synapse in every column the memory holding the input data is indexed with the input space address particular to that synapse, and if that input bit is high, the synapse's permanence is compared to the threshold to compute the overlap score for each column.
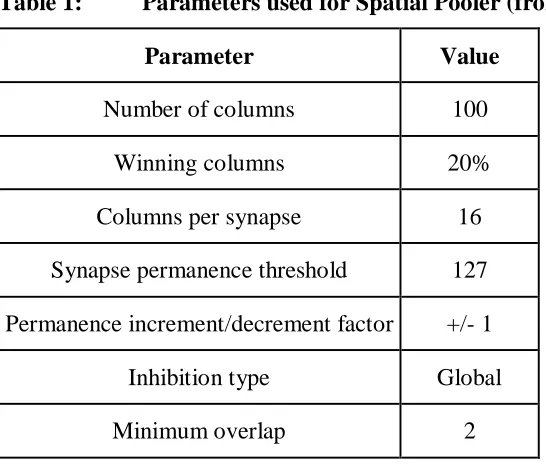
Table 1: Parameters used for Spatial Pooler (from Zyarah & Dhireesha, 2015)
Parameter Value
Number of columns 100
Winning columns 20%
Columns per synapse 16
Synapse permanence threshold 127 Permanence increment/decrement factor +/- 1
Inhibition type Global
Minimum overlap 2
In this implementation, they chose to use a global inhibition as opposed to a local inhibition. Global inhibition works by first calculating the overlap scores of all columns, and then selecting the columns with the highest overlap, in this case the top 20%, as the winners. This is in contrast to local inhibition which selects the winners by comparing the overlap score of each column to that of the columns within a certain distance, and
declaring it a winner if its score is greater than or equal to the score of the columns around it. It has been shown that there is little difference between global and local inhibition when using the MNIST dataset, in terms of the feature extraction ability of the spatial pooler [22]. The minimum overlap parameter sets the minimum overlap threshold for each column. In this case, a column must have an overlap of at least 2, while also being in the top 20% of all columns to be active.
Figure 10. Inhibition comparison
These two approaches both maintain the same level of activation, but the pattern differs slightly. The blue circle in the left figure represents the inhibition radius of the column labeled "51", and the orange circle is the inhibition radius for the column labeled "9". With local inhibition, the "9" column is declared a winner since it has a higher activation than all of the columns within its radius, but is not activated with global inhibition due to its low relative overlap score. Conversely, the "51" column is inhibited with local inhibition by the "66" to its left, but is active with global inhibition since it has a high overlap relative to all other columns.
2.5.1 Logical Implementation
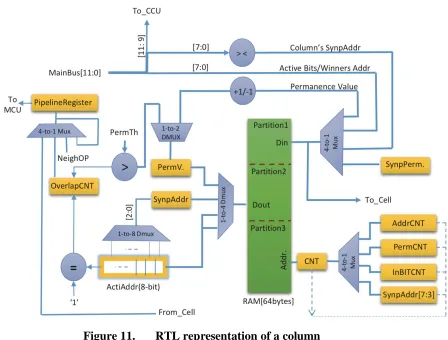
either the permanence of a synapse, the address of the input bit to which that synapse was connected, or the input bit itself. Thus, phase 1 of the spatial pooler was able to be
computed in parallel, in relatively few cycles. The activations of the columns were fed back to the "MCU", or main control unit, via a series of shift registers. The MCU would perform a sorting algorithm on the overlap scores to determine winning columns. Then, only the winners would perform the learning phase. Figure 11 gives an overview of the logic required for each column.
Figure 11. RTL representation of a column
adding regions.
Notably missing from this implementation is a method of boosting the inactive columns which is part of the core HTM spatial pooler algorithm. Failing to include the boosting mechanism would decrease the homeostasis of the HTM, and could result in reduced classification performance. When comparing the performance of HTM spatial poolers, Cui, Ahmad, & Hawkins noted both a significant reduction in classification error rate, and increased homeostasis when boosting was used [23].
The method for classification also requires an offline process, and requires storage to preserve all of the previous activation patterns. Classification using a support vector machine necessitates storing all of the activation patterns, then processing them to build the SVM.
2.6 MNIST Database of Handwritten Digits
In order to reduce the size of the HTM domain, and maintain a consistent evaluation methodology with Zyarah and Kuduthipudi [20], each pixel was translated from 8-bit resolution to one bit by simply truncating the least significant 7 bits. Figure 12 shows an original MNIST digit on the left, and one converted to a 1-bit black and white scale on the right by truncating the 8-bit value to one bit.
CHAPTER 3: DESIGN METHODOLOGY
3.1 Overview
There are two main novel components to the hardware implementation described in this thesis: implementing the HTM boosting, and an online classification algorithm. The following sections provide details on the algorithms and their hardware
implementations.
3.2 HTM Boosting
As previously stated, boosting is a technique used to maintain a higher level of homeostasis in column activation. Homeostasis is a property of a system to maintain some variable nearly constant across its constituent elements. In the context of the HTM, it is a measure of a region's ability to maintain similar activation duty cycles for all of its columns. An HTM with a high level of homeostasis would inhibit overactive columns, and boost less active columns to maintain a similar duty cycle across all columns. An HTM with poor homeostasis would have some columns which are exceptionally active relative to others. When a column is active across broadly differing input patterns, its activation becomes meaningless for classification, and reduces the likelihood other columns can express themselves and identify meaningful features in the input space. Boosting seeks to solve this problem by inhibiting overactive columns, boosting the less active columns, or a combination of both.
column, and increasing a columns overlap score if it is underactive, or decreasing its overlap score if it is overactive. The net effect is a more consistent use of each column in the regions activation patterns. The novel contribution of this work is implementing the HTM boosting functionality in reconfigurable hardware.
The implemented boosting algorithm computes a boosting factor for each column based on the duty cycle of that column, as well as the duty cycles of the columns within its inhibition radius. The overlap score of each column is then multiplied by this boosting factor to obtain its boosted overlap score. If the boosted overlap score of a column is higher than that of the other columns in its inhibition radius, that column is chosen as a winner for that iteration. This boosting methodology follows the boosting algorithm described in [8].
3.3 Online Classification
The online classification algorithm takes advantage of the fact that the output of the HTM region is an SDR. From an intuitive perspective, since the activation patterns are sparse, it is unlikely that there will be significant overlap between any two random activation patterns.
Figure 13. Scaled Union Overlap vs. regular union overlap
In this example, A and B are both union vectors representing classes A and B
respectively. s is a vector to be classified as either class A, or class B. For the purposes of this example, assume A, B, and s aredefined as follow:
𝑨 = (1,1), 𝑩 = (1,0), 𝒔 = (1,0)
𝑠 ∙ 𝑈𝑛 |𝑈𝑛| >
𝑠 ∙ 𝑈best |𝑈best|
(9) The algorithm can be summarized with the pseudo-code shown in Figure 14.
Figure 14. Scaled Union Overlap pseudo-code
For each union vector, the dot product is computed, then divided by the length of the union vector. Since the union vectors are bit strings, the Euclidean length of the vector is simply the square root of the sum of all of the non-zero elements. Making this substitution in inequality 9 yields inequality 10.
𝑠 ∙ 𝑈𝑛
√sum(𝑈𝑛)
> 𝑠 ∙ 𝑈best √sum(𝑈best)
(10)
In order to preserve the precision of the calculations and avoid floating point representations, the hardware implementation modifies this comparison slightly. Inequality 10 is altered to become inequalities 11, then 12.
(𝑠 ∙ 𝑈𝑛)2
sum(𝑈𝑛)
> (𝑠 ∙ 𝑈best)
2
sum(𝑈best)
(11)
(𝑠 ∙ 𝑈𝑛)2× 𝑠𝑢𝑚(𝑈 𝑏𝑒𝑠𝑡)
> (𝑠 ∙ 𝑈𝑏𝑒𝑠𝑡)2× 𝑠𝑢𝑚(𝑈𝑛)
(12)
Figure 15. Modified scaled union overlap pseudo-code
CHAPTER 4: HARDWARE IMPLEMENTATION
4.1 Overview
The RTL design for the FPGA implementation was written in Verilog using the 2001 standard, and was synthesized for and tested with a Digilent Zybo board containing a Xilinx Zynq XC7Z010 programmable SoC [24]. The HTM core was packaged as an AXI peripheral and communicated instructions and data on that bus with the on-die hard-core ARM based processor. A compiled C program was run on the processor to retrieve the test and classification vectors, along with their associated labels, and relay them to the HTM core (htm_core). The interface between htm_core and the AXI bus consisted of: 1. A set of control registers
2. An SRAM for transferring input vectors to the htm_core, and delivering the activation patterns back to the processor
The htm_core performs the spatial pooling algorithm, and either trains or exercises the classifier based on the status of a configuration register. First, the training vectors are loaded, and then the classification vectors. During classification, the processor compares the classifications returned by the htm_core with the correct classes read from a label file located on a micro-SD card. It then communicates the results back to a terminal connected through UART. The output vectors, or activation patterns, are also sent back to the processor via AXI, and where they can be written to a file on the micro-SD storage card. This information is then transferred to a more powerful machine for SVM
random values
3. Set of SRAMs used to store the synthetic synapses
4. A second FSM to select the winning columns based on the activations of the columns within an inhibition radius
5. An SRAM to store the duty cycles of each column
6. A second SRAM used to store the union vectors required for classification
The detailed RTL description of each of these components are described in the following sections.
4.2 Primary Finite State Machine
Two state machines are employed to manage the control signals which are
detailed in the other RTL modules. The primary FSM is responsible for several functions: 1. Initialization of the synapses
2. Communication with the AXI RAM 3. Interfacing with the synapse RAMs
Figure 16. Primary FSM diagram
Otherwise the “Write back” phase begins. During “Write back” the activation vector is deposited to the AXI interface RAM. If classification is enabled, the union vector RAM is read, and the class with the largest scaled union overlap value is selected as the winner. If classification is not enabled, then the duty cycles are updated instead of performing classification. Once the algorithm has completed, the FSM returns to the “Idle” state, and awaits further input.
4.3 Linear Feedback Shift Register
A linear feedback shift register (LFSR) is a common tool used to implement a pseudo-random number generator. This LFSR is 128 bits long, with XOR taps at bits (from 1 to 128) 128, 126, 101, and 99. This gives a unique sequence of 2128− 1 bit strings of length 128 until the sequence repeats [25]. The LFSR is used to initialize the HTM synapses with pseudo-random starting permanencies, and mappings to the input space.
This implementation uses a span width of 112 bits, which corresponds to 2 rows of pixels in an MNIST dataset image. Each consecutive column will shift its valid window by 2 bits. The first column would have possible connections to inputs 0 through 111, then the next column could be connected to 2 through 113, and so on. Figure 17 illustrates this concept of "spanning". In the example, each column can have a span of 6 with the increment is set to 2.
Figure 17. Column input mapping
Figure 18. Valid rang of input bits
As the figure illustrates, there are three valid ranges for the two different cases. Figure 19 is a block diagram of the LFSR and shows how its output bits are used to generate the initial synapse values.
For every column in the SP, the shift register is filled with 48 synapses worth of addresses and thresholds. The permanencies are initialized to values between 28 and 35 by adding 28 to a pseudo-random 3-bit number. Once the shift register has been filled with the 48 valid synapses, they are written to the synapse SRAMs for storage. The htm_core initialization is complete once all 512 columns have received initial values.
4.4 Synapse RAMs
In this design, several 36KB single port SRAMs are used to store the synapse data. They are arranged in parallel with read/write widths of 72 bits each, and have a depth of 512 words. Each synapse is composed of 12 address bits to map to the input space, and 6 bits of permanence. Utilizing 12 SRAMs with 72 bits of input data, 48 synapses, each consisting of 18 bits, can be written to or read from the SRAM array in a single cycle. Access to these RAMs is controlled by the primary state machine, which initializes its values, reads the data, and updates permanencies during SP phase 3.
Reading of the synapse RAM is done once per column. The addresses and
Figure 20. Synapse RAM
4.5 Winner Selection State Machine
Figure 21. Winner selection SM diagram
The primary FSM retrieves the input from the input SRAM one bit at a time, utilizing 2 clock cycles per synapse per column. So, every 96 clocks (48 ∙ 2) the primary FSM collects all of the data necessary for an entire column. The primary FSM passes to the winner selection FSM four values:
1. The moving average duty cycle of the column (11-bits),
2. The largest duty cycle of all columns in the current column's inhibition radius (11-bits),
synapse to compute the overlap for the column. Then, the duty cycle of the column, as well as the largest duty cycle of all columns in the inhibition radius, is used to compute a "boosted overlap" value. This boosted overlap and the input pattern are pushed into the shift register for processing. The depth of the shift register is 2 ×inhibition radius + 1, in this case 21. As the values for each column fill the shift register, the boosted activation of the center column is compared against the boosted activations of each of the columns in the inhibition radius to determine if that column is deemed a winner. A column is declared a winner if its boosted activation is greater than both the minimum activation, as well as the boosted activations of 19 out of the 20 columns in its inhibition radius.
Assuming a minimum activation of 1, this constraint still guarantees an activation pattern density of at most 1 / 6, or approximately 16.7%.
For each column, a boosting factor is calculated based on the duty cycle of each column as measured over the last 2048 iterations. The column's activation is then multiplied by its boosting factor to obtain the boosted activation. If the duty cycle is above a certain threshold, then a unity boost factor is used. Otherwise, the boost factor for
column is greater than the computed minimum, then a unity boosting factor (no boosting) is used.
𝑏𝑖 = {
1, 𝐷𝑖 > 𝑚𝑖
𝐵 + 𝐷𝑖 ×(1 − 𝐵)
𝑚𝑖 , 𝐷𝑖 ≤ 𝑚𝑖
(13)
𝑚𝑖 =𝑀𝑖 2𝑠
(14)
Since the minimum duty cycle 𝑚𝑖 is a non-constant registered value, the boost factor calculation in Equation 13 is altered to be scaled by 𝑚𝑖 in order to avoid the division operation. Thus a new boosting factor 𝑏̂𝑖 is computed as shown in Equation 15.
𝑏̂ = 𝑏𝑖 𝑖 × 𝑚 = { 𝑚𝑖, 𝐷𝑖 > 𝑚𝑖 𝐵 × 𝑚𝑖 + 𝐷𝑖 × (1 − 𝐵), 𝐷𝑖 ≤ 𝑚𝑖
(15)
Figure 22. Duty cycle computation
Figure 23 demonstrates the logic necessary to compute the boosted activation.
Figure 23. Boosting logic
4.6 Classification Logic
the union vectors during training, and logic to compare an output vector with the union vectors in order to select the winning class.
The union vector SRAM DI and DO busses are composed of 3 sections: 1. A segment of the running union vector (16 bits)
2. A segment of the "latched" union vector (16 bits)
3. The number of active bits in the "latched" union vector segment (5 bits)
Utilizing one 36Kb SRAM, union vectors can be stored for up to 31 distinct classes. Once the activation pattern is computed during training, the tag provided for the input vector is used to compute the address of the first section in the union vector RAM for that particular tag. The current activation pattern is OR'ed bitwise with the union vector in 16 bit increments, until all 512 bits of the activation pattern have been utilized. Every 100 times a tag is trained, the union vector is "latched". Then the sum of active bits are also computed and stored. When classification begins, only the latched union vectors are used in the scaled union overlap classification phase. This ensures that each union vector is comprised of the same number of output vectors.
best_length 9'd1 best_overlap_squared 0
The dot product of the output and the latched union vector representing class "0" is computed at a rate of 16 bits per clock cycle. Once complete, the comparison described in equation 12 is evaluated to determine if class "0" is a better match than the tag
contained in "best_tag". This process is performed until all union vectors have been tested, and the remaining "best_tag" register then holds the resulting class. The
comparison operation utilizes three clock cycles. Squaring of the dot product comes first, multiplication second, with the comparison operation occurring on the third clock cycle. Squaring of the dot product is performed with a ROM. The number to be squared is used as the address bus to the ROM, and the output is the precomputed squared value
Figure 24. Union vector SRAM
CHAPTER 5: RESULTS
5.1 Overview
This chapter documents the results of both the software and hardware
implementations of both the spatial pooler and the scaled union overlap classification method. Following these sections, a final summary is presented, along with some suggestions for future work.
5.2 Software
The Python implementation of the spatial pooling algorithm is used to sweep across several parameters for the spatial pooler to identify the optimal topology, as well as evaluate deviations from the canonical spatial pooling algorithm. The deviations from the spatial pooling algorithm produced only marginally better classification results, so were discarded in favor of evaluating only the implementation of the SP itself, and not the alterations.
As explained earlier, several parameters were swept with the Python script to determine the following optimal settings:
1. Number of columns
2. Number of synapses per column 3. Permanence threshold
4. Inhibition radius
7. Minimum overlap 8. Maximum boost factor
Synapses per column 32 16, 32, 48
Permanence threshold 30 16, 20, 24, 26, 28, 30, 32
Inhibition radius 4 2,4,10,20
Minimum target activated columns
Unused 0, 25, 50, 75, 100
Maximum target activated columns
Unused 25, 50, 75, 100, Number of columns
Maximum boost factor 1 (no boost) 1, 1.5, 2, 3
Minumum overlap 1 1,2,3,4,5,6,7,8,9,10
Span Input size (no span) 28, 56, 84, 112, 140, 168, Input size
5.2.1 Number of Columns
The SP was tested with two different numbers of columns, 256, and 512. In the case of scaled union overlap, increasing the number of columns provided a slight bump to classification accuracy. For this reason, 512 columns will be used in the hardware
Table 4. Number of columns software sweep
Columns SVM Mean % SVM STD SUO Mean % SUO STD
256 92.61 0.51 41.08 2.41
512 92.91 0.33 44.56 2.74
5.2.2 Synapses per Column
Interestingly, the trend seems to be opposite for the SVM and scaled union overlap accuracies when varying the number of synapses per column. However, each of the scaled union overlap means are within two standard deviations of each other. For the hardware implementation, 48 synapses per column will be used. Results are shown in Table 5.
Table 5. Synapses per column software sweep
Synapses per column SVM Mean % SVM STD SUO Mean % SUO STD
16 93.66 0.15 43.45 2.13
32 92.91 0.33 44.56 2.74
48 92.87 0.21 45.98 1.85
5.2.3 Permanence Threshold
activation patterns correlates to better classification.
Table 6. Permanence threshold software sweep
Threshold SVM Mean % SVM STD SUO Mean % SUO STD Entropy
16 93.66 0.15 49.31 1.37 421.82
20 92.22 0.12 47.63 2.31 428.34
24 93.13 0.21 50.54 1.42 430.78
26 93.16 0.21 46.87 3.23 427.83
28 93.01 0.36 46.48 2.65 424.00
30 92.91 0.33 44.56 2.74 417.13
32 92.42 0.48 42.10 2.30 406.51
5.2.4 Inhibition Radius
As shown by Table 7, increasing the inhibition radius of the columns also
Table 7. Inhibition radius software sweep
Inhibition radius SVM Mean % SVM STD SUO Mean % SUO STD
2 92.41 2.02 47.42 14.77
4 92.91 0.33 44.56 2.74
10 94.82 0.26 54.73 1.22
20 94.33 0.12 61.29 1.59
5.2.5 Variable Minimum Overlap
No minimum No maximum 92.91 0.33 44.56 2.74
12 25 87.06 2.00 31.02 27.40
25 50 90.51 0.93 31.78 27.98
37 75 92.52 0.24 58.72 10.29
50 100 92.79 0.37 44.58 23.88
75 150 94.48 0.07 54.00 1.75
100 200 93.00 0.29 45.00 1.42
5.2.6 Boosting
Increasing the maximum boosting factor shows a positive trend for the scaled union overlap classification average as explained by Table 9, but is not statistically significant. Since the boosting factor is computed based on the duty cycles of the
columns only within the inhibition radius, the full effect of boosting is likely not captured since the baseline inhibition radius is only four.
Table 9. Boosting software sweep
Maximum boost SVM Mean % SVM STD SUO Mean % SUO STD
1 92.91 0.33 44.56 2.74
1.5 92.74 0.28 44.60 2.24
2 92.61 0.27 43.27 2.33
5.2.7 Minimum Overlap
Raising the minimum overlap by a fixed value instead of varying based on activation shows an improvement in accuracy, but without the large variation in
accuracies between runs as was seen with the variable minimum overlap method. Using a value of three or four provides a nice compromise between accuracy and variation. These results are shown in Table 10.
Table 10. Minimum overlap software sweep
Minimum overlap SVM Mean % SVM STD SUO Mean % SUO STD
1 92.91 0.33 44.56 2.74
2 93.90 0.23 48.92 3.60
3 94.82 0.16 52.17 2.38
4 94.37 0.37 52.34 2.57
5 91.58 0.39 50.32 0.82
6 86.72 0.25 45.95 7.71
7 80.89 1.10 18.47 9.56
8 71.35 0.24 8.08 2.39
9 57.28 2.44 9.89 2.85
10 43.72 1.84 10.78 1.37
5.2.8 Span
that span shows higher classification and the least variation.
Table 11. Span software sweep
Span SVM Mean % SVM STD SUO Mean % SUO STD
None (entire input) 92.91 0.33 44.56 2.74
28 (1 row) 96.31 0.15 53.88 2.54
56 (2 rows) 96.25 0.16 53.58 1.77
84 (3 rows) 96.15 0.19 54.50 2.03
112 (4 rows) 95.67 0.12 55.31 0.42
140 (5 rows) 95.68 0.24 55.37 1.12
168 (6 rows) 95.45 0.23 55.06 2.74
5.2.9 Final Parameters for Hardware Configuration
Table 12. Final software experiment parameters
Parameter Value
Columns 512
Synapses per column 48
Permanence threshold 24
Inhibition radius 10
Minimum target activated columns Unused
Maximum target activated columns Unused
Maximum boost factor 2
Minumum overlap 3
Span 112
With these final parameters used, the Python model produces the following results show in in Table 13.
Table 13. Final software experiment results
SVM Mean % SVM STD SUO Mean % SUO STD
Power HTM
time per sample Energy per sample SUO time per sample SVM time per sample
by the time per sample. SUO time is the time required to process a single sample by the Perl based SUO script, and SVM time per sample is how long on average the SVM classification algorithm took to classify a single sample.
Table 14 shows the average classification accuracy of the scaled union overlap method versus that of the non-scaled union overlap across all experiments. As seen, there is a measurable difference between the average classification accuracies. The average runtime increase of adding the scaling was 53%.
Table 14. Scaled union overlap versus union overlap
SUO Mean % SUO STD UO Mean % UO STD
45.00 5.21 29.47 2.25
5.3 Hardware
5.3.1 Classification Methods Results
The parameters used to evaluate the hardware implementation are shown in the previous section in Table 14, with two exceptions: The minimum overlap parameter, as well as another parameter referred to as "shift", were swept by the Zynq processor on the FPGA. The shift parameter controls the calculation of the boost factor for each column. As discussed previously, the duty cycle of each column is represented by an 11-bit unsigned integer, and is used to calculate the variable 𝑚𝑖 in Equation 13, as shown in Equation 16.
𝑚𝑖 = 𝑀𝑖 2𝑠ℎ𝑖𝑓𝑡
(16)
Where the division operation is implemented as a logical right-shift of the duty cycle by "shift" number of bits. No boosting occurs when shift = 11, since 𝑚𝑖 = 0, and maximum boosting occurs when shift = 0. Table 15 details the best results for both SUO and SVM classification methods. Again, five separate tests were conducted with each set of parameters, each with a unique RNG seed.
Table 15. SVM vs. hardware SUO (%)
Method Mean STD Shift Min overlap Runtime
SVM (software)
94.66 0.22 8 1 47 m, 33s
SUO (hardware)
71.08 1.75 6 5 36s
5.3.2 Hardware Parameter Sweep
Shift MO 1 MO 2 MO 3 MO 4 MO 5 MO 6 MO 7
11 (no boosting) 94.62 94.64 94.48 94.43 94.31 94.06 93.49 10 94.62 94.64 94.48 94.43 94.31 94.06 93.49 9 94.64 94.65 94.46 94.45 94.31 94.00 93.49 8 94.66 94.65 94.44 94.45 94.27 93.97 93.45 7 94.55 94.53 94.39 94.41 94.21 94.10 93.47 6 94.55 94.62 94.45 94.36 94.28 93.98 93.62 5 94.55 94.42 94.34 94.33 94.16 93.83 93.55 4 93.64 93.72 93.84 93.70 93.39 93.22 92.78 3 (most aggressive boosting) 93.36 93.26 92.87 92.86 92.83 93.01 92.84
Table 17. SUO accuracies with hardware vectors (%)
Shift MO 1 MO 2 MO 3 MO 4 MO 5 MO 6 MO 7
The data in Table 16 suggests there is not much of a benefit to boosting in the spatial pooler with respect to using SVM classification. However, Table 17 shows there does seem to be a slight positive correlation between boosting and accuracy when using SUO. In fact, for this test set, across all values of minimum overlap, a shift of five produces the best results. Figure 26 provides a surface plot of the data from Table 17.
Figure 26. SUO accuracy surface plot
5.3.3 FPGA Resources
Three experiments were performed in order to determine how many hardware resources are being utilized for these three separate functions:
After placing the design, reports are written by the Vivado suite detailing how many of each type of hardware blocks were used to implement the logic. The htm_core Verilog module was written such that the boosting and classification functions can be included or excluded independently based on the definition of pre-processor macros. For the first experiment, both the boosting and classification functions were enabled to get a
Figure 27. Slice LUTs utilization
The number of slice Look-Up Tables (LUTs) reflects the combinatorial logic operations required to implement each function. The slice registers are the number of single bit memory elements used to preserve state. The block RAMs refers to the number of discreet 36 KB SRAM macros used. The Digital Signal Processors (DSPs) are logic blocks used to perform common complex arithmetic functions such as single cycle addition or multiplication.
From a utilization perspective, it should be reasonable to expect to be able to implement two htm_cores on this programmable SoC.
5.4 Comparison
This section summarizes and compares metrics between the software and
hardware spatial poolers, as well as the hardware SUO implementation against the SVM and SUO classifiers.
5.4.1 Spatial Poolers
As expected, the hardware implementation improved speed and power efficiency. Table 18 summarizes the major metrics used to characterize the spatial pooler.
Table 18. Hardware versus software SP
SP Type Accuracy (SVM)
Speed (us per vector)
Efficiency (mJ per vector)
Software 95.43 11114.43 135 mJ
Hardware 94.66 85.71 154 uJ
Difference -0.81% 130X speedup 877X reduction
5.4.2 Classifiers
This section documents the results of comparing four classifiers:
1. The support vector machine classifier, which provides a high classification accuracy at the cost of speed and power.
2. The scaled overlap method, which is the simplest yet least accurate method, and 3. Hardware implementations of scaled union overlap. Both the third and fourth
classifiers provide an intermediate level of accuracy at the expense of a slight increase in complexity.
Table 19 provides the metrics of interest for these four methods. The vectors used to characterize the classifiers are those produced by the hardware SP with the shift parameter set to 5. Each of these values represents the average across all of these test cases.
Table 19. Classifier metric comparison
Classifier Accuracy (%) Speed
(us per vector)
Energy consumption (mJ per vector)
SVM (software) 94.17 300.1 ms 3637.50
Union overlap (software)
63.93 1.54 ms 18.67
Scaled union overlap (software)
70.62 2.34 ms 28.37
Scaled union overlap (hardware)
70.65 0.1 ms 0.18
CHAPTER 6: CONCLUSION
6.1 Summary
This thesis introduced a novel implementation of the HTM spatial pooler on a programmable SoC. The design was based mostly on the work described by Zyarah and Kudithipudi titled "Reconfigurable Hardware Architectures of the Spatial Pooler for Hierarchical Temporal Memory" [20], with two main contributions. The first being the introduction of a method for boosting unused columns, and the second adding a modified version of the classification algorithm described by Ahmad and Hawkins in their work "How do neurons operate on sparse distributed representations? A mathematical theory of sparsity, neurons and active dendrites" [21], both to the programmable logic. The efficacy and benefits were explored, and a mild benefit was found from the addition of boosting, and a sizable benefit in both speed and power efficiency from the classification being moved to the programmable logic.
6.2 Future Work
dynamically create them during each pooling iteration with a linear feedback shift register, or some other pseudo-random number generator. With an LFSR, the state of the shift register could be reset to the same value at the beginning of the pooling algorithm, thus ensuring the same pattern of addresses would be repeated each iteration. In this case, a saving of 36 kilo-bytes of SRAM resources can be achieved.
REFERENCES
[1] Fast, E. and Horvitz, E., 2017, February. Long-Term Trends in the Public Perception of Artificial Intelligence. In AAAI (pp. 963-969).
[2] Ovtcharov, Kalin, et al. "Accelerating deep convolutional neural networks using specialized hardware." Microsoft Research Whitepaper 2.11 (2015).
[3] Demirci, Mehmet. "A survey of machine learning applications for energy-efficient resource management in cloud computing environments." Machine Learning and Applications (ICMLA), 2015 IEEE 14th International Conference on. IEEE, 2015. [4] Abadi, Martín, et al. "Tensorflow: a system for large-scale machine learning." OSDI.
Vol. 16. 2016.
[5] Shi, Shaohuai, et al. "Benchmarking state-of-the-art deep learning software tools." Cloud Computing and Big Data (CCBD), 2016 7th International Conference on. IEEE, 2016.
[6] Schneider, David. "Deeper and cheaper machine learning [top tech 2017]." IEEE Spectrum 54.1 (2017): 42-43.
[7] Chen, Yunji, et al. "Dadiannao: A machine-learning supercomputer." Proceedings of the 47th Annual IEEE/ACM International Symposium on Microarchitecture. IEEE Computer Society, 2014.
[8] Hawkins, Jeff, Subutai Ahmad, and Donna Dubinsky. "Hierarchical temporal memory including HTM cortical learning algorithms." Technical report, Numenta, Inc, Palo Alto
http://www.numenta.com/htmoverview/education/HTM_CorticalLearningAlgorith
ms.pdf (2011).
http://yann.lecun.com/exdb/mnist/ (1998).
[12] C.-C. Chang and C.-J. Lin. LIBSVM: a library for support vector machines. ACM Transactions on Intelligent Systems and Technology, 2:27:1--27:27, 2011. [13] Williams, Stephen. "Icarus verilog." On-line: http://iverilog. icarus. com (2006). [14] Bybell, Tony. "GtkWave electronic waveform viewer." (2010).
[15] P3 International. P4400 Kill A Watt Operation Manual, February, 2014. A.
[16] Hawkins, Jeff, and Sandra Blakeslee. On intelligence: How a new understanding of the brain will lead to the creation of truly intelligent machines. Macmillan, 2007. [17] Barth, Alison L., and James FA Poulet. "Experimental evidence for sparse firing in
the neocortex." Trends in neurosciences 35.6 (2012): 345-355.
[18] Eshghi, Kave, and Mehran Kafai. "Support vector machines with sparse binary high-dimensional feature vectors." Hewlett Packard Labs, Palo Alto, CA, USA, Tech. Rep. HPE-2016-30 (2016): 1-10.
[19] Streat, Lennard, Dhireesha Kudithipudi, and Kevin Gomez. "Non-volatile hierarchical temporal memory: Hardware for spatial pooling." arXiv preprint arXiv:1611.02792 (2016).
[20] Zyarah, Abdullah M., and Dhireesha Kudithipudi. "Reconfigurable hardware architecture of the spatial pooler for hierarchical temporal memory." System-on-Chip Conference (SOCC), 2015 28th IEEE International. IEEE, 2015.
[21] Ahmad, Subutai, and Jeff Hawkins. "How do neurons operate on sparse distributed representations? A mathematical theory of sparsity, neurons and active
dendrites." arXiv preprint arXiv:1601.00720 (2016).
[23] Cui, Yuwei, Subutai Ahmad, and Jeff Hawkins. "The HTM spatial pooler—a neocortical algorithm for online sparse distributed coding." Frontiers in computational neuroscience11 (2017): 111.
[24] Xilinx. Zynq-7000 SoC Data Sheet: Overview, July, 2018.
https://www.xilinx.com/support/documentation/data_sheets/ds190-Zynq-7000-Overview.pdf
[25] George, Maria, and Peter Alfke. "Linear feedback shift registers in Virtex devices."
Macbook Pro Specifications
A late 2016 Macbook Pro with Touchbar was used for running all simulations, as well as creating and testing of support vector machines. This machine had the following specifications:
Processor
Intel 2.9 GHz Core i7 (I7-6920HQ), 4-cores, 256 KB L2, 8MB L3 DRAM
2 DIMMs, 8 GB (16 GB total) LPDDR3 @ 2133 MHz Storage
512 GB SSD, PCI-Express 3.0 Operating System
Utilization Reports
Table B.1 All functions enabled LUT utilization
Site Type Used Fixed Available Util%
Slice LUTs 8219 0 17600 46.7
LUT as Logic 7374 0 17600 41.9
LUT as Memory 845 0 6000 14.08
LUT as Distributed RAM 424 0
LUT as Shift Register 421 0
Slice Registers 7324 0 35200 20.81
Register as Flip Flop 7324 0 35200 20.81
Register as Latch 0 0 35200 0
F7 Muxes 223 0 8800 2.53
F8 Muxes 74 0 4400 1.68
Table B.2 All functions enabled RAM utilization
Site Type Used Fixed Available Util%
Block RAM Tile 18 0 60 30
RAMB36/FIFO* 17 0 60 28.33
FIFO36E1 only 3
RAMB36E1 only 14
RAMB18 2 0 120 1.67
DSP48E1 only 44
Table B.4 Boosting disabled LUT utilization
Site Type Used Fixed Available Util%
Slice LUTs 7970 0 17600 45.28
LUT as Logic 7125 0 17600 40.48
LUT as Memory 845 0 6000 14.08
LUT as Distributed RAM 424 0
LUT as Shift Register 421 0
Slice Registers 6784 0 35200 19.27
Register as Flip Flop 6784 0 35200 19.27
Register as Latch 0 0 35200 0
F7 Muxes 206 0 8800 2.34
Table B.5 Boosting disabled RAM utilization
Site Type Used Fixed Available Util%
Block RAM Tile 17 0 60 28.33
RAMB36/FIFO* 16 0 60 26.67
FIFO36E1 only 2
RAMB36E1 only 14
RAMB18 2 0 120 1.67
FIFO18E1 only 1
RAMB18E1 only 1
Table B.6 Boosting disabled DSP utilization
Site Type Used Fixed Available Util%
DSPs 2 0 80 2.5
DSP48E1 only 2
Table B.7 Classification disabled LUT utilization
Site Type Used Fixed Available Util%
Slice LUTs 7591 0 17600 43.13
LUT as Logic 6746 0 17600 38.33
LUT as Memory 845 0 6000 14.08
LUT as Distributed RAM 424 0
LUT as Shift Register 421 0
Slice Registers 6970 0 35200 19.8
Register as Flip Flop 6970 0 35200 19.8
Register as Latch 0 0 35200 0
F7 Muxes 148 0 8800 1.68
RAMB36/FIFO* 16 0 60 26.67
FIFO36E1 only 3
RAMB36E1 only 13
RAMB18 1 0 120 0.83
RAMB18E1 only 1
Table B.9 Classification disabled DSP utilization
Site Type Used Fixed Available Util%
DSPs 42 0 80 52.5