ON ACADEMIC SUCCESS
by
Christopher Hyer
A dissertation
submitted in partial fulfillment of the requirements for the degree of
Doctor of Education in Curriculum and Instruction Boise State University
DEFENSE COMMITTEE AND FINAL READING APPROVALS
of the thesis submitted by
Christopher Hyer
Dissertation Title: Student Involvement and the Impact on Academic Success Date of Final Oral Examination: 21 June 2019
The following individuals read and discussed the thesis submitted by student Christopher Hyer, and they evaluated his presentation and response to questions during the final oral examination. They found that the student passed the final oral examination.
Lindsey Turner, Ph.D. Chair, Supervisory Committee Keith Thiede, Ph.D. Member, Supervisory Committee
Carl Siebert, Ph.D. Member, Supervisory Committee
Hannah Calvert, Ph.D. Member, Supervisory Committee
iv
v
vi
Universities have been trying to increase graduation rates for decades. Using Astin’s student involvement theory (1984), which posits the more a student is involved at the university, the more likely students will be retained and graduate from the university. Much of the research over the past 20 years has been limited to study the impact of one form of involvement has on retention and graduation, while this study combines different forms of involvement and how they impact retention and graduation rates. This study occurs with a first-year cohort entering fall 2012 at a public four-year university in the Pacific Northwest. While considering students’ entering characteristics, this study uses multiple analyses to explore how first semester student involvement (Greek life,
Recreation center use, working on campus, etc.) affects first semester GPA, first-semester and first-year retention, and graduation rates. Overall findings show first semester GPA is still the best predictor of six-year graduation rates. The study also showed certain types of student involvement impacts first semester GPA. This impact led to the creation of a weighted Student Involvement Index in an attempt to predict six-year graduation rates. This new Student Involvement Index accurately predicted over 61% of the student outcomes based on student involvement during the first semester at the university.
vii
DEDICATION ... iv
ACKNOWLEDGEMENTS ... v
ABSTRACT ... vi
LIST OF TABLES ... x
CHAPTER ONE: INTRODUCTION ... 1
CHAPTER TWO: LITERATURE REVIEW ... 4
Conceptual Framework: Student Involvement Theory ... 4
Grade Point Average ... 7
Student Attrition and Retention ... 10
Students from Diverse Racial/Ethnic Backgrounds ... 12
Campus Recreation ... 14
Service and Service Learning ... 16
Living on Campus ... 19
Fraternities and Sororities: Greek Life ... 23
Faculty/Staff and Student Interaction ... 29
On-campus Employment ... 33
Honors Programs ... 37
ROTC Programs ... 40
viii
Research Questions ... 42
Null Hypothesis ... 42
Description of Site and Research Participants ... 42
Data Collection ... 43
Treatment of Data ... 44
Data Analysis ... 45
Testing Assumptions ... 47
CHAPTER FOUR: RESULTS ... 48
Analysis ... 54
First Semester GPA and Entering Characteristics ... 55
First Semester GPA and Student Involvement ... 60
First Semester GPA and Retention Rates ... 61
First Semester GPA and Graduation Rates ... 63
Entering Characteristics and Retention Rates ... 64
Retention to Spring Semester ... 64
Retention to Fall 2013 Semester ... 68
Four-year Graduates ... 73
Entering Characteristics ... 73
Student Involvement ... 74
Five-year Graduates ... 77
Entering Characteristics ... 77
ix
Entering Characteristics ... 82
Student Involvement ... 85
Regression Analyses: Multivariable Tests of Relationships Predicting Retention and Graduation... 88
Involvement Index ... 97
CHAPTER FIVE: DISCUSSION ... 103
Strengths and Limitations ... 108
Strengths ... 108
Limitations ... 108
Conclusion ... 109
REFERENCES ... 112
APPENDIX A ... 123
x
Table 4.1 Sample demographics ... 49
Table 4.2 High school academic performance ... 50
Table 4.3 Student financial information ... 50
Table 4.4 Fall 2012 class academic performance ... 51
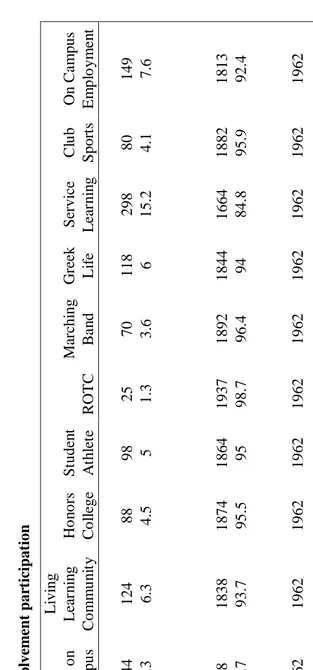
Table 4.5 Fall 2012 student involvement participation ... 53
Table 4.6 Graduation rates ... 54
Table 4.7 Correlations between Fall 2012 GPA and entering characteristics ... 57
Table 4.8 Fall GPA and entering characteristics ... 59
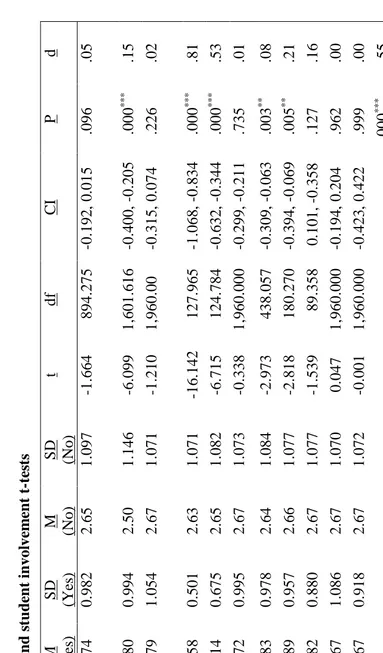
Table 4.9 First semester GPA and student involvement t-tests ... 62
Table 4.10 Cross-tabulation of entering characteristics and retention to spring semester 65 Table 4.11 Cross-tabulation of student involvement and retention to spring semester ... 66
Table 4.12 Cross-tabulation of entering characteristics and retention to fall semester ... 69
Table 4.13 Cross-tabulation of student involvement and retention to fall semester ... 72
Table 4.14 Cross-tabulation of 4-year graduation and entering characteristics ... 73
Table 4.15 Cross-tabulation of 4-year graduation and student involvement ... 76
Table 4.16 Cross-tabulation of four-year graduation and Recreation Center use ... 77
Table 4.17 Cross-tabulation of five-year graduation and entering characteristics ... 78
Table 4.18 Cross-tabulation of five-year graduation and student involvement ... 81
xi
Table 4.21 Cross-tabulation of six-year graduation and student involvement ... 86
Table 4.22 Cross-tabulation of six-year graduation and Recreation Center use ... 87
Table 4.23 Results of logistic regression model to predict retention to spring semester .. 89
Table 4.24 Results of logistic regression model to predict retention to second year ... 90
Table 4.25 Results of logistic regression model to predict graduation status at four years ... 91
Table 4.26 Results of logistic regression model to predict graduation status at five years ... 92
Table 4.27 Results of logistic regression model to predict graduation status at six years 93 Table 4.28 Summary of significant logistic regression findings and academic outcomes 95 Table 4.29 Total student involvement and six-year graduation rates ... 98
Table 4.30 Predictive involvement index ... 100
Table 4.31 Weighted predictive involvement index... 101
CHAPTER ONE: INTRODUCTION
The success of Higher Education institutions is frequently tied to graduation rates (Goenner & Snaith, 2003). The graduation rate of a university is affected by a number of factors incorporating both student and institutional inputs. Academic and social
integration have been shown to be paramount for student retention, academic success, and persistence to graduation (Barbera, Berkshire, Boronat, & Kennedy, 2017). The six-year graduation rates among doctoral granting universities varies from 10% (Louisiana State University - Eunice) to 97.8% (Yale University) (Salingo, 2013). Students who share the same individual characteristics (age, race, grades, standardized test scores, etc.) yet attend two different institutions will likely have a differing probability of completing their degree (Astin, 1993; Pascarella &Terenzini, 1991; Tinto, 1993). Institutional input variables influencing this outcome include factors such as class size, the academic performance of incoming high school students (class rank, test scores, GPA), the percentage of students from out of state, and the percentage of faculty holding a Ph.D. (Astin, 1993).
One focal point for many researchers, educational leaders, and universities is the retention of first year students at the institution. According to a National Student
indicator of persistence (Gifford, Briceno-Perriott, & Mianzo, 2006, Reason, 2003; Pascarella and Terenzini, 2005; McGrath and Braunstein, 1997; Adelman, 1998), other researchers use Astin's (1985, 1993, 1999) student involvement theory as a foundation to build a research base. Astin's (1985, 1993, 1999) theory suggests that while GPA is an important factor for persistence, the sense of belonging and connection a student feels to an institution (through their campus involvement) is just as important. Students who feel a greater sense of belonging are more likely to persist than are their peers (Astin, 1999). The National Study of Student Engagement (NSSE) has identified six high-impact practices which affect student involvement and lead to greater academic and personal success (Kuh, 2001). These practices require students to dedicate significant time and effort, but, in return, provide opportunities to interact with faculty and staff, facilitate diverse interactions, and deliver feedback to students (Kuh, 2008). They include the following: learning communities; service-learning courses; research with faculty; experiential learning projects; global learning opportunities; and senior capstone seminars. Scholars and practitioners acknowledge that increasing engagement in high-impact practices increases student achievement and academic outcomes (Astin, 1993; Hausmann, Ye, Schoelfield, & Woods, 2009, Kilgo, Sheets, & Pascarella, 2015; Kuh, 2008).
CHAPTER TWO: LITERATURE REVIEW Conceptual Framework: Student Involvement Theory
In his theory of student involvement, Alexander Astin combines 20 years of research to provide a developmental theory of student success based on student
involvement. Astin's theory suggests the more that a student is involved in an institution, the more success the student will have at the institution. Astin defines student
involvement as the “amount of physical and psychological energy that a student devotes to the academic experience.” (1999, p. 518) This energy includes, but is not limited to, engagement in groups, athletics, time spent on campus, interaction with faculty, and/or time spent on studies.
Astin's (1999) student involvement theory is a connection of three different pedagogical ideas. The first, content theory, suggests that students learn passively from lectures, reading, assignments, and library research. This assumes the "ignorant" student learns from the "knowledgeable" professor. The second, resource theory, claims that the collection of resources (e.g., well-trained faculty, laboratories, libraries, high-end
each student, it is limited due to the considerable cost of individualizing the learning process for each student.
Astin states that involvement is connected to not just the physical presence of students, but rather the behavior of students. While Astin does not discount motivation or feelings as being important, he believes what an individual does or how he or she behaves defines involvement (Astin, 1999). This leads to five postulates to define student
involvement on campus, including: 1) the investment of physical and psychological energy on either a generalized or specific subject; 2) involvement occurring on a continuum; 3) involvement as having both quantitative and qualitative features; 4) student learning and personal development associated with an educational program is directly proportional to the quality and quantity of student involvement in that program; and 5) the effectiveness of any educational policy or practice is directly related to the capacity of that policy or practice to increase student involvement. The last two components are subject to empirical proof and should be used to research the effectiveness (or lack thereof) of student involvement (Astin, 1999).
the college. Astin suggested that this attachment might help students try harder academically, which might lead to a more successful student.
According to Astin’s (1993) theory of student involvement, change or growth in a student should be measured by comparing outcome characteristics with input
characteristics. Experiences that cause change among students in different environments throughout college are assessed in his theory. The purpose of this assessment is to understand the impact that these experiences have on a student and his or her development. The impact differs from student to student depending on the input or experiences that students have prior to attending college, such as: self-prediction of success in college; courses taken in high school; preliminary choice of career; reasons to attend college; religious preference; and parental occupation, income, and education (Astin, 1993).
According to Astin, (1993) there are 192 constructs that can describe the
institutional environment, including the following categories: institutional characteristics; peer group characteristics; faculty characteristics; curriculum; financial aid; choice of major; place of residence; and student involvement, which includes classes, hours studying, honors programs, sports, and social interactions. There are many ways to examine student involvement, such as including academic involvement, involvement with faculty, involvement with student peers, involvement with work, and other forms of involvement that includes volunteer work, religious services, alcohol consumption, and counseling.
conducting research on the impact of student development on student success, it is important to determine whether there are relevant outcomes based on the experience. Second, it is important to determine how programs or experiences vary from college to college. The impact that experiences have on a student can vary based on a number of variables such as degree of exposure, time of exposure, intensity or frequency of interaction, maturation, and social change (Astin, 1993).
In general, higher levels of engagement in activities not only contributes to higher GPAs but also higher levels of satisfaction with one's academic experience (Turner, 2012; Webber, Krylow, & Zhang, 2013). Academic involvement, involvement with faculty, and involvement with peers are positively associated with academic performance, learning, and retention (Astin, 1993). Overall, academic (intellectual) development is proportional to the amount of time that students study, while growth in a particular area of knowledge is based on the number of courses taken in a particular area (Astin, 1993). Cognitive growth is negatively affected by forms of involvement that isolate students from peers or remove students from campus, such as watching television, living off-campus, working full time, or working off campus. Understanding how student involvement impacts academic performance can lead to higher graduation rates.
Grade Point Average
The comparability of course content and grading standards in first year courses are similar across colleges and universities. This similarity provides a common classroom experience while allowing for the comparison of unique institutional characteristics and programs across universities. Specifically, this includes the campus environment and culture across institutions and allowing for the study of culture and practices on college campus, efficacy of program and policies, and reasons why a high number of students transfer to other institutions or drop out after their first year (Zwick & Sklar, 2005).
According to Gayles' 2012 study, first year GPA was a significant indicator of 6-year graduation rate among students from diverse backgrounds. Gayles studied 8,743 students who entered college in the fall semester without previously earning college credits. He then compared their first year GPA to their final GPA at the 6-year
graduation time. His study found that first year GPA was a significant indicator across diverse racial groups to use to predict 6-year graduation rates.
behavior early in a student's career, but this effect may become less pronounced over time.
In 2002, Ishitani and DesJardins examined factors associated with graduation for 3,450 students who began studying at public and private U.S. institutions from Fall 1989 through Spring 1994. The sample included 51% female students, and 84.2% white students. A key predictor of persistence and graduation was first-year GPA. The study showed the higher the student’s first year GPA, the lower the attrition rate. However, rather than use GPA as a continuous variable, students were broken into ordinal groups to compare non-linear relationships. Using students who earned a GPA of 3.0-4.0 as a comparison group, researchers found that students in the 2.0-3.99 GPA group were 30% more likely to drop out than their peers, students in the 1.0-1.99 GPA group were 97% more likely to drop out, and students in the 0.00-.99 GPA group were 360% more likely to drop out after their first year (Ishitani & DesJardins, 2002). While there were still many students who dropped out during year two (the odds of dropout were 1.5 times higher for students with a 1.0-1.99 GPA compared to students with a 3.0+ GPA), the lingering effects of a poor first semester GPA waned over time (Ishitani & DesJardins, 2002).
words, the relationship between college achievement, grades, and persistence is not linear: while such a relationship could be an outlier in the research, it also might call for other factors to be considered when it comes to persistence.
Student Attrition and Retention
Attrition and retention rates have always been an important factor for gauging student success on college campuses. Attrition refers to leaving the university while retention refers to students returning to the university the following term. Attrition is not always due to financial troubles or “flunking out,” but rather can be due to factors such as academic boredom, not being prepared for collegiate academics, difficulty in
transitioning to the institution, incompatibility, a sense of not belonging, and unrealistic expectations of college (Levitz and Noel, 1989, p.67). The study suggests universities that facilitate a connection to freshmen can reduce the amount of attrition that takes place at the institution. Furthermore, Levitz and Noel (1989) state that the goals of these programs should be to connect students to the surrounding environment, help with the transition to college, and help students work towards their career goals while succeeding in the classroom.
While participation in campus activities is believed to aid in student integration and success, lack of involvement leads to lower persistence rates. Dropping out can be considered as the ultimate form of noninvolvement and lack of integration (Tinto, 1993). According to Astin (1985), while the main reason students dropped out was boredom with classes, other factors contributing to dropout also reflect a lack of involvement, such as neglecting coursework, not participating in extracurricular activities, and having little contact with faculty. Interestingly, working full-time off campus also contributes to a lack of involvement, as time and energy is not devoted to academics or soft skill development (Astin, 1999; Pike, Kuh, & Massa-McKinley, 2009; Kulm and Cramer, 2006).
(i.e. homesickness, poor health) and how well the students felt they fit into the institution. The “dropouts” used the facilities on campus significantly less than the “persisters.” The “low persisters” used the facilities significantly more than the “low dropouts,” but the difference between “high stopouts” and “high persisters,” between “low persisters” and “high persisters,” and between “low stopouts” and “high stopouts” were not significant (Churchill & Iwai, 1981).
Churchill and Iwai’s study suggests that there is a relationship between students engaging in campus and being persistent in their studies. Because the students who were “low stopouts” used the facilities significantly more than the students who were
“dropouts,” but less than the “low persisters,” this might suggest that one of two things could be true: campus facilities help with persistence, or for some reason the “low persisters” just use the facilities more than students who leave school. Either way, this study supports the use of campus facilities as an indicator of student engagement on campus.
Students from Diverse Racial/Ethnic Backgrounds
Flowers' (2004) study of almost 8,000 African American students from almost 200 public and private institutions over a ten-year period found that student involvement experiences directly impacted African American students' understanding of arts and humanities, personal and social development, thinking and writing skills, understanding science and technology, and vocational preparation. Involvement in academic-related opportunities showed a positive impact in the vocational development of African American students (Flowers, 2004). Social and recreational activities also had positive effects on educational outcomes, yet less than academic related involvement experiences. Attending social events negatively affected students' understanding of science and
technology. Following a regular exercise schedule had a negative effect on writing and critical thinking gains, but positive effects on personal and social development (Flowers, 2004).
In a 1987 study, three main factors were found to predict retention of African American/Black students: 1) use of the library; 2) the hours per week spent in the recreation center; and 3) participation in recreational activities at the student union (Mallinckrodt & Sedlacek, 1987). Mallinckrodt & Sedlacek (1987) and Baker (2008) both found that Black students develop a better sense of community and identification when engaged in varsity athletics use of the recreation center. In addition, Baker (2008) found that Latino males had similar results, whereas while Latina women had lower academic success (GPA) if they were involved in student recreation.
more students to participate in the student center, then retention rates might rise (Mallinckrodt & Sedlacek, 1987). Overall, the use of both academic and nonacademic student facilities appears to be related to student retention from diverse backgrounds.
Campus Recreation
Belch, Gebel, and Maas (2001) suggest a positive relationship between use of the student recreation center (SRC) and freshman academic performance and that sport and fitness participation are major contributors to the learning, development, and persistence of college students. The research examined 11,076 entering freshmen at Arizona State University over three years from Fall of 1993 to the Fall of 1995. Data were collected using the Student Recreation Center (SRC) card scanner, which kept track of the usage of the SRC in a central database. The number of visits was recorded during the fall
semesters of each year. Analysis examined any use versus no use, as well as the extent of use, which includes four categories: 1) 1-4 visits a semester; 2) 5-19 visits a semester; 3) 20-49 visits a semester; and 4) 50 or more visits a semester. Demographic data included student gender, ethnicity, and residency, as well as academic performance, which
included high school GPA, high school rank, SAT/ACT score, first semester GPA and first year GPA at the university (Belch et al., 2001).
on the SAT/ACT, higher high school GPAs and high school ranks. On average, the SRC users had higher first semester GPAs and higher first year GPAs compared to nonusers. The persistence rates were also higher for SRC users 92% (first semester) and 71% (first year) compared to 86% and 64% to nonusers, respectively. The persistence rate for all high-end users (20+ visits) was also higher for all freshmen than for students in their second year and beyond (Belch et al., 2001). According to the authors, the SRC might be a place where freshmen integrate themselves into the university. It is also suggested that while the use of the SRC might not be the only reason for high levels of persistence, it may play an important role in student satisfaction, thus leading to increased persistence (Belch et al., 2001). Similarly, another study (Bryant, Banta, & Bradley, 1995) found that students believe there is a strong relationship among persistence and use of the recreation center.
Bryant, Banta, and Bradley’s (1995) study demonstrates the impact and
effectiveness of campus recreation programs. Using campus recreation for integrating students into the university helped “dispel the notion that all of the important memorable learning in college goes on in the classroom” (Bryant et al., 1995, p.154). Belch et al. (2001) provide an example showcasing that experiences happening outside of the classroom help with the retention of students.
schools before it was validated (Bryant et al., 1995). There were five parts to the survey: 1) recruitment and retention; 2) involvement and interaction associated with student services in general; 3) recreation in particular; 4) satisfaction with recreation programs; and 5) student perceptions about current and future services (Bryant et al., 1995, p. 156). Ninety-five percent of the students who participated reported that they recreated two or more times a week. In addition, 30% of the students visited recreation facilities prior to selecting a college and considered that a factor in deciding where to enroll. Less than ten percent of students said that they did not recreate once a week, the main reason being they did not know about the programs offered or they had too many conflicts with their work schedule (Bryant et al., 1995).
Together these studies suggest that, apart from the required core classes, recreation may be the one experience most college students share. There was also a strong response from students that the importance of recreational activities helps with the persistence of the students at that university. Students reported that participation
provided a healthier sense of both physical and mental well-being. These factors led to a connection with the institution, thus enhancing persistence, learning, and graduation rates (Bryant et al., 1995).
Service and Service Learning
Service based learning within the classroom is designed to enhance the
educational experience as well as the personal development of students participating in service-learning classes (Chupp & Joseph, 2010). Traditional service-learning
than that of a passive classroom learner (Dewey, 1938). Students who participate in social justice-focused service engage in moral development while encouraging a sense of civic responsibility (Astin and Sax, 1998; Chupp & Joseph, 2010). Researchers of service-learning outcomes report evidence of short-term civic and cognitive gains (Batchelder and Root 1994; Gyles and Eyler, 1994).
Students’ motivation to service tend to be altruistic in nature, with 91% of students reporting “to help other people” as their number one motivation for completing service (Astin & Sax, 1998). While this may be a motivating factor, Astin and Sax's (1998) longitudinal study of 3,450 students over a four-year period compared the
development of 2309 students who participated in community service projects, with 1141 peers. The students who participated in the service projects showed significant growth in 47 of 48 possible measures of civic responsibility, with 42 of the 47 being significant at the p=.001 level. These results show the positive effects students feel towards a sense of civic responsibility.
Lockeman and Pelco (2013) found that enrollment in service-learning courses was a strong predictor of students' graduation within a six-year period. In the study, following 3,458 freshman at a large, urban mid-Atlantic school for six years beginning with their entering semester, minority and low income students who participated in service learning coursework were more likely than their peers to graduate within six years (Lockeman & Pelco, 2013). While there was an increase in graduation rates, there was no significant relationship to GPA. This might suggest that service learning courses enhance academic integration within the university which in turn, increases the
commitment students have to competing their degree even with no direct tie to GPA. Reed and colleagues (2015) studied three freshmen cohorts from three
Midwestern universities to determine whether service learning promotes student persistence in some types of institutions compared to others, and how student
Not all outcomes of service-learning courses are desired. Poorly organized experiences or those with inadequate time for reflection can reinforce stereotypes of students being providers and community members being dependent on the students' assistance (Mitchell, 2008). This reinforcement does little to challenge pre-existing feelings of prejudice, but rather it reinforces cultural stereotypes, creates feelings of superiority, and can create apathy about social change (Boyle, 2007). To combat these potential negative outcomes, ample time to reflect is imperative. While reflection is often incorporated, critical reflection that initiates change takes ample time and engagement in order to be truly meaningful for the learner. Using deep and meaningful reflection is a key component to help process experiences and connect implications of experience to coursework (Chupp & Joseph, 2010).
From an academic standpoint, participating in education-based service (tutoring and/or teaching) enhanced students’ GPA, general knowledge in the discipline, and aspirations to pursue an advanced degree in the field (Astin and Sax, 1998). Students also self-reported greater gains in "deeper learning" from service-learning based courses (Bureau et al., 2010). Astin and Sax argue that this could be interpreted as evidence of the efficacy of cooperative learning and enhanced commitment to an academic discipline. The commitment to study and community engagement might show commitment to
involvement, and hence predict higher satisfaction with the collegiate experience (Lockeman & Pelco, 2013, Reed et al., 2015).
Living on Campus
research, Astin (1985) and Pascarella and Terenzini (1991) found that living on campus is the single most important college experience that contributes to learning, cognition, and social integration. Some studies (Araujo & Murray, 2010; Noble, Flynn, Lee, & Hilton, 2007; Turley & Wodtke, 2010) have shown that freshmen living on campus have higher GPAs and higher rates of retention than students who do not live on campus. Other studies (Cotten & Wilson, 2006; de Beer, Smith, Jansen, 2009; Pokorny, Holley, & Kane, 2017) suggest that living at home and commuting to school contributes to a lack of sense of belonging because many students depart campus soon after classes have completed and never establish a sense of belonging to campus or a peer social group on campus.
Turley and Wodtke's 2010 study of 2,011 traditional aged (18-24 years old), full time, degree-seeking students from 372 various types of institutions (Carnegie I, II, Masters I, II, public, etc.) examined how different characteristics affect academic
institution, the researchers found that students with higher GPAs were from diverse backgrounds and/or students who attended liberal arts colleges (Turley and Wodtke, 2010).
Two separate studies using the same data set at Indiana University - Purdue University in 2008 examined the involvement of students living on campus compared to students who lived off campus (Araujo & Murray, 2010; Araujo & Murray, 2011). The school has a small on-campus population (1,107 beds for an enrollment of 19,700 students) which means that only about 15% of students live on campus at any time in their college experience. The first study (2010) showed that students who had ever lived on campus had GPAs .2 to.5 points higher than their classmates, and students who lived on campus had an increased GPA of .7 to 1.0 GPA points higher than their classmates. This is believed to be due to the utilization of academic support resources, learning environment created by the residence halls, and activities and support from the residence hall staff (Araujo & Murray, 2010). These findings were supported in a subsequent study.
that living on campus creates a culture that is different than living off campus and this culture is more conducive to academic focus and involvement.
Another study considering the engagement of students living on campus showed that students who lived on campus reported feeling more engaged in both social and academic relationships (Lanasa et al., 2007). This study surveyed 731 first time freshman at a public doctoral intensive university in the Midwest about the campus culture.
Engagement was a stronger predictor of GPA among those living on campus than among those living off campus. Engagement domains that were significant predictors of GPA among students living on campus included: learning strategies; academic interactions; institutional emphasis; effort; and overall relationships. In contrast, overall relationships was the only domain significantly associated with GPA for students living off campus (Lanasa, et al. 2007).
Student satisfaction is an important factor in understanding the association between living in residence halls and impact on student life. A recent study looked at different styles of residence halls (Bronkema & Bowman, 2017) to see whether the style of residence hall (traditional hall, suite style, or apartment style housing) led to
researchers attributed this to the natural and intentional community building program as well as reduction in isolation that occurs in the living environment based on the physical attribute of the building.
A study of campus design and characteristics (Hajrasouliha & Ewing, 2016) of 103 Research 1 and 2 university campuses nationwide found that students who lived on campus had higher retention rates than students who did not live on campus. A ten percent increase in the percentage of on-campus residents netted a 2.43% increase in six-year graduation rates while controlling for other factors (Hajrasouliha & Ewing, 2016). However, the researchers noted that while it is important to consider the number
(quantity) of students living on campus, the quality of the experience was also important. Fraternities and Sororities: Greek Life
Fraternities and sororities (hereafter, “Greek organizations”) have a long-standing tradition at many colleges and universities throughout the United States. There are approximately 750,000 current members and 9 million living alumni members from Greek organizations (National Panhellenic conference, 2018; North-American Interfraternity Council, 2018). While there are many stereotypes connecting Greek members to alcohol abuse, partying, and objectification of women (Routon and Walker, 2016), other studies have shown that Greek members have higher levels of involvement which has been linked to higher retention rates, higher graduation rates, and greater satisfaction with the college experience (Astin, 1999; Biddix, 2014; Pike, 2000; Routon & Walker, 2016).
survey waves beginning in the summer before beginning their first semester and during the spring of their first, second, and fourth years of college. Researchers selected 1,180 students (representative of the racial diversity of the campus) to complete surveys about the racial-diversity of their friends, the importance of social or good student was to their identity, what they spent their time doing (academics and social) on campus involvement, and the presence of alcohol and drugs at social events.
Greek students reported higher levels of involvement as well as higher levels of satisfaction with campus (Walker, Martin, & Hussey, 2015). Greek students were also more likely to have studied abroad and spent more time in extra-curricular activities. A key research question was how Greek membership would affect academic performance, relative to students not participating in the Greek system. Greek students were more likely to maintain full time status (9% higher), and were more likely to graduate (7% higher), however there was no significant difference in overall academic performance based on GPA.
To examine long-term effects of Greek membership on fourth year students, researchers examined first year students at 17 four-year colleges across the United States (those who participated in the Wabash National Study of Liberal Arts Education) to understand the influence Greek life has on educational outcomes such as critical thinking skills, moral reasoning, life-long learning, and psychological well being (Hevel, Martin, Weeden, & Pascarella, 2015). Survey questions were designed to collect information about the students’ college experience as well as measuring aspects of students’
and included 4,193 students. Follow up surveys were from Spring 2007 and Spring 2010. A total of 2,212 students with data at follow-up were included.
Results showed that Greek membership does not have negative influences on educational outcomes. However, it does not improve these outcomes either. This is perhaps surprising due to the resources (financial dues for programming, university professionals, and targeted campus services) that are directed to Greek communities (Hevel et al., 2015). The implications of this study suggest that Greek membership is not a detriment to educational outcomes, yet it is also not something to boast about, as there are many resources devoted these organizations.
Another study on Greek involvement utilized data from a sample of 2,391
students from 21 four-year institutions across the United States with a three wave survey during the first two-three weeks on campus, end of the first year, and the end of year four (Bowman & Holmes, 2017). In the sample, 54% were female, 81% were White, 7% were Asian/Pacific Islander, 5% were Black/African American, 5% were
Latino/Hispanic, and 2% were from another race/ethnicity. A total of 20% of the students were members of a Greek organization.
similar patterns, except for four-year satisfaction becoming no longer significantly elevated for Greek members. The results also showed an increase in the positive results (increase of 1.6 percentage points) of retention in the first and fourth years for Greek students.
There were slight differences in gender, with female Greek members having a positive relationship between first year GPA, first year satisfaction, and retention all three years, as well as graduation (Bowman and Holmes, 2017). Effect sizes were in the small range (.09 to .15). Meanwhile, male Greek members, reported higher levels of first-year college satisfaction and retention, yet their membership was associated with significantly lower first year grades. There was no significant difference in members of different racial/ethnic groups within this study.
Researchers examined the effects of joining a Greek organization on academic performance, based on GPA among students at Duke University (Donato & Thomas, 2017). Duke University implements an unusual policy among their student population; most college students join Greek organizations the fall of their first year, but Duke University students are not allowed to join a Greek organization until the spring semester of their first year (Donato & Thomas, 2017). Historically, 35% of Duke students choose to affiliate with Greek organizations. The sample included 1008 students from the 2001 and 2002 entering cohorts, and those samples were determined to be representative of the university overall student makeup. The study examined 29,001 student-course
(Donato & Thomas, 2017). When the researchers take into account that fraternity members strategically take leniently-graded courses the semester they join the
organization, the effect grows to a drop of .216 GPA points. These results suggest that male students attempt to offset the burdens of Greek affiliation by choosing courses that are .048 grade points more lenient in their grading practices (Donato & Thomas, 2017). Subsequent semesters show the effect on GPA differences dropping; third semester membership causes a drop of .132, and forth semester a drop of .089.
The burden of sorority membership is delayed until the members are required to plan and host sorority recruitment for new members. At Duke University, this is during the spring of sophomore year. During this time, the effects of joining a sorority cause a grade point drop of .109 but that number increases to .146 when the leniency effect is taken into consideration (Donato & Thomas, 2017). Modest effects occurred for the semester of affiliation as well as the fall of sophomore year, but those effects were almost fully mitigated by members choosing courses that are graded more leniently.
impacted. While GPA is only one measure of academic success, this impact cannot be discounted when exploring how student involvement impact academic success.
Not all the results of Greek membership are positive. Greek members did show higher levels of alcohol and drug use, lower levels of academic satisfaction and
performance, and placed lower importance on diverse thought and friendships (Walker et al., 2015, Donato & Thomas, 2017). Some of these findings were explained by pre-entry conditions such as family income and self-reported importance of social importance, suggesting that Greek organizations might not be the cause of these outcomes, but rather a reflection of predisposing characteristics.
A 2014 study conducted by Routon and Walker followed a sample of college students who graduated with their undergraduate degree from 463 different institutions from 1994-1999. Of these respondents, 19.2% (19,784) reported having joined a social Greek organization. Student responses from a survey conducted during freshman year were compared to results of surveys taken during senior year. Of notice is that all respondents must have graduated so this study examined graduates and not all Greek members. Student outcomes were broken into three categories, including "academic outcomes,” "health and behavioral outcomes," and "other outcomes." Male members of fraternities had a statistically lower GPA, although female sorority members did not show a difference in GPAs (Routon & Walker, 2014). Greek students overall were found to have graduated at higher levels than their non-Greek peers, with a 4.8 percent higher graduation rate among male students and 4.7 percent higher among female students.
cigarettes, and more hours partying. Females smoked cigarettes at levels 4% higher than non-Greek members, and males were 14.3% more likely to be frequent drinkers (Routon & Walker, 2014). Both male and female Greek members reported decreased convictions of religious belief and attendance in religious services.
Results in the "other outcomes" category found that Greek students planned to work full time at a rate of three to four percent higher than their peers. Greek members were more likely to have participated in community service and to have a professional network, which might contribute to the higher percentage of Greek students having found jobs upon graduation. The percentage of Greek students who wanted to pursue a
graduate degree upon graduation was 5% higher than their non-Greek peers (Routon & Walker, 2014). The differences in these categories were believed to be due to a greater network of peers and alumni who offered professional advice and support.
Faculty/Staff and Student Interaction
Faculty and staff interaction is an important factor in student satisfaction with their institution. Institutions of Higher Education have looked for successful ways to connect students with faculty in a variety of settings. These include undergraduate research opportunities, freshmen seminars designed to help with transition issues, and living learning communities (LLCs) within university housing.
faculty member or graduate student (Kuh, 2008). According to Kim and Lundberg, (2016) and Kim and Sax (2009), existing research focuses on two outcomes. The first area of research is based on measuring cognitive related outcomes and enhanced learning abilities. This includes the assessment of critical thinking, analysis, and problem solving. Cognitive skills and critical reasoning skills increase after engaging in undergraduate research (Kim & Lundberg, 2016). The second focus is on education attainment
outcomes such as an increase in GPA, (Kim and Sax, 2009) as well as first-year retention (Gregerman, Lerner, von Hippel, Jonides, & Nagda, 1998), persistence to graduation, and graduate school aspiration (Kilgo and Pascarella, 2016).
It is generally accepted that undergraduate research enhances faculty-student relationships, provides socialization into the discipline, and dispels myths about the accessibility of research (Bowman and Holmes, 2017). Chang, Sharkness, Hurtado, & Newman, (2014) found this is especially true for African American students, who have the lowest rate of persistence in science, technology, engineering and math (STEM) majors among all racial/ethnic groups, yet one of the highest major retentions if those students engage in undergraduate research (2014). In addition, undergraduate research in the first or second year increases student retention and graduation rates (Jamelske, 2008; Kuh, 2008). These students are more likely to move into professional and graduate schools than students who do not participate (Hathaway, Nagda, & Gregerman, 2002). Students also show signs of greater analytic and cognitive growth (Hathaway et al., 2002; Webber, Nelson Laird, & BrckaLorenz, 2013).
Student Survey on Engagement (NSSE) included 111,077 seniors who completed surveys (Webber et al., 2013). Of those who completed the study, 65% percent were women, 47% were first generation, 70% were white, and 19% had completed undergraduate research (Webber, et al., 2013). Minority students had higher participation in
undergraduate research than white students. Female students' participation was lower than male participation, and students who lived on campus was higher compared to those who lived off campus. First generation college students also participated at lower levels than their counterparts. Interestingly, being in a large research institution did not equate to higher participation rates. This study indicates that work still needs to be done to include female and first generation college students in undergraduate research.
In a 2017 study, 4,211 respondents from 46 4-year institutions responded to a three-wave survey beginning two-three weeks into their first semester at the university, a second wave two weeks prior to the end of their first year, and a third wave at the end of their fourth year in college (Bowman & Holmes). The sample was 56.6% female, 10.4% African American, 5.6% Asian American/Pacific America, 4.8% Latino/Hispanic, and 2.5% other. A total of 5.2% of the students reported engagement in undergraduate research during their first year in college. Participating in undergraduate research was positively and significantly related to fourth-year GPA and first year student satisfaction (Bowman & Holmes, 2017). Interestingly there was not a significant relationship between GPA of other years, retention rates, or 4-year graduation rates.
From their first to their fourth year at the university, only 56.5% of African American students and 58.9% of Latino/as stayed in STEM fields compared to 63.5% of white students. However, students from underrepresented groups (those from non-white racial groups and Latino ethnic groups) were 17.4% more likely to stay in STEM fields,
compared to their peers, if they engaged in undergraduate research. Students who joined a club or organization connected to their major were 9.3% more likely to stay in a STEM field compared to their peers (Chang et al., 2014). This would suggest the importance of support and mentoring from peers and faculty for students of diverse backgrounds in STEM fields.
LLC programs are designed to promote the academic integration of students living in the residence hall (Turley & Wodtke, 2010). These programs usually include a faculty member (and their family) living in the residence hall with the students. They include faculty lectures, credited and non-credited seminars, events and activities with the faculty member, and advising hours. Research on LLCs show that these communities are high-impact practices that improve student retention, GPA, graduation time, and student satisfaction by fostering students' academic involvement, peer collaboration, faculty mentoring, group identity, and interactive pedagogy (Kanoy & Bruhn, 1996; Palm & Thomas, 2015; Schneider, Bickel, & Morrison-Shetlar, 2015; Pike, Schroeder, & Berry, 1997).
toured research facilities, and reviewed research literature (Schneider et al., 2015). During the spring course, the students focused on applying for research experiences, learning about graduate college, and studying research ethics. Students also created a short research proposal that led to a digital poster due at the end of the second semester. Outside of the course, students worked three hours a week with a thesis-based master's or doctoral student through a voluntary mentor program. This small community (28
students) earned a 3.37 GPA compared to the control group of 100 students averaging a 2.79 GPA. The retention of the LLC students to their second year was 96%, compared to 74% among the control group. LLC students reported high student satisfaction of mentor relationships, community involvement and support, and student motivation (Schneider et al., 2015).
A study of engineering LLC students compared 19 members of a LLC to 61 non-engineering LLC members (Palm & Thomas, 2015). When controlling for educational inputs at the university, being in the engineering LLC improved student GPA by a significant margin of .422 grade points over a 4-year time period, compared to not participating in an LLC (Palm & Thomas, 2015). Student who were members of the engineering LLC were 2.3 times more likely to be retained at the university than those who were not part of an LLC. The authors surmised these increases were due to
community support, faculty interaction and support, and increased sense of belonging at the university.
On-campus Employment
Personnel Administration (NASPA), more than 70 percent of college students work part time while they are enrolled in classes, and 40% work more than 30 hours a week
(Carnevale, Smith, Melton, & Price, 2015). It is suggested that universities can no longer expect students to devote their full time and attention to academic demands (U.S. Dept. of Education, 2014; Scott- Clayton, 2012; Riggert, Boyle, Petrosko, Ash, & Rude-Parkings, 2006). The benefits of working while attending school are mixed: some research has found that working part time can raise student grades, yet grades decline as students approach full time employment (Pike, Kuh, & Massa-McKinley, 2009; Kulm, & Cramer, 2006). Other research has found that working detracts from the time that
students need to focus on coursework and to have positive interactions with faculty and peers (Tinto, 1993).
A qualitative study of student employees found that most students preferred to work on campus if they worked during their undergraduate experience (Cheng & Alcantara, 2007). One of the main reasons for this preference was the convenience of working on campus. While most students worked to meet immediate financial
obligations, over time, students reported greater networking opportunities, better summer positions, and in some cases, full-time employment upon graduation (Cheng & Alcantara, 2007). Students reported that working gave them insight into the job market, real world experiences, and an inside track to information to their selected careers.
surveyed. Sixty-six percent were women, 15% were first generation, and 76% lived on campus. Students' self-reported grades were compared to groups where students reported either 1) not working, 2) working fewer than 20 hours on campus, 3) working fewer than 20 hours off campus, or 4) working more than 20 hours on or off campus. Results show significantly lower grades for students working more than 20 hours a week on or off campus. The findings stayed consistent even after adjusting for student backgrounds (Pike et al., 2009). GPAs were higher for students who worked on campus fewer than 20 hours per week, but significance was lost when accounting for student backgrounds. These findings suggest both direct and indirect relationships between grades and student work (Pike et.al., 2009).
A study of 243 first-year students looked at the impact of student employment on academic performance and motivation (Huie, Winsler, & Kitsantas, 2014). Students completed a survey during the first two weeks of the semester, and a second survey near the end of the semester. There was no significant difference in GPA for students who did not work compared to peers who did work during their first semester, but they were significant at the end of the first year with students who worked more hours having lower GPAs. The study also found that students who worked on campus had higher GPAs at the end of the first semester and the end of the first year compared to their peers who worked off campus. This suggests that one semester might be too short to understand the impact of working on students (Huie et al., 2014).
According to Cheng and colleagues (2007), students do not feel that work affected their grades in any negative way, which is contradictory to some empirical research. Many students felt that work taught them how to manage their time, focus their studies, and balance their friendships and social lives (Cheng & Alcanantara, 2007; Dundes & Marx 2006). Many students felt that the ability to participate in cost-based activities increased their quality of social life on campus. The students reported a sense of financial independence that they were proud of establishing.
respectively (Dundes & Marx, 2006). The students who worked over 10 hours a week experienced more stress (70-80%) compared to those who worked fewer than 10 hours per week (19%). Students who worked more than 20 hours a week were 1.56 times (significant finding) more likely to be binge drinkers and 1.45 times (almost significant) more likely to be sleep deprived (less than seven hours a night) compared to those who worked fewer than 10 hours a week (Miller, Danner, & Staten, 2008).
There are many inconsistencies about the effect of work on students' academic performance. While most researchers agree that as students approach full time work status their grades are affected negatively, the benefits of working part time are mixed (Riggert, Boyle, Petrosko, Ash, & Rude-Parking, 2006; Huie et al., 2014, Kulm et al., 2006). Some studies have found significant relationships between work and grades, while others have shown no significant relationship, especially when accounting for pre-entry conditions. However, most studies show that the effects of on-campus employment are more beneficial than off-campus employment (Riggert et al., 2006).
Honors Programs
designed to engage and support students in the program in the hopes of attracting and retaining high achieving students. All of these specialized services require additional financial and personnel resources at a high cost to the university (Brimeyer et al., 2014).
Critics (Pehlke, 2003; Santelices & Wilson, 2010) argue that honors programs reinforce socioeconomic and racial privileges. Honors colleges tend to select students based on standardized test scores as one component of admissions standards, along with high school GPA. Standardized tests have been found to be biased against racial and ethnic minorities and groups with lower socioeconomic status (Pehlke, 2003; Santelices & Wilson, 2010). Honors colleges also segregate a small number of privileged students for distinctly different, more personalized curriculum for 20-25% of their coursework (Brimeyer, et al., 2014). This has led to some students who viewed themselves as "academically elite and deserving of academic privileges." (Mihelich, Storrs, & Pellet, 2007, p.102)
There is a significant difference between honors and non-honors students' GPA, retention rates, and graduation rates (Keller and Lacy, 2013; Astin, 1993; Goodstein & Szarek, 2013). However, this is to be expected based on the high academic standards required for admission to most honors programs (Goodstein and Szarek, 2013). This means that studies should identify and account for status within an honors program when considering predictors of outcomes (Astin, 1993; Goodstein and Szarek, 2013).
in an honors program. There were significant difference in first year retention rates, four-year, five-four-year, and six-year graduation rated after controlling for entering data (SAT scores, high school GPA, gender, residency, e.g), suggesting that participation in an honors program had meaningful impacts on retention and graduation rates.
However, Slavin, Coladarci, and Pratt (2008) found mixed results for graduation rates when comparing a group of high achieving non-honors students who matched the academic profile of honors students, versus students in the honors program (Slavin et al., 2008). After controlling for SAT scores and high school rank, results of a regression analysis showed that honors students had significantly higher one-year retention rates (94%) compared to their peers (85%). Honors students were 3.1 times more likely to return their sophomore year compared to their non-honors classmates (Slavin et al., 2008). However, it should be noted, in this study there was no significant relationship between four-year graduation rates among honors students as compared to their peers who were not in an honors program.
Lastly, a study of 4,093 students from 41 four-year institutions considered differences in academic outcomes between honors students and non-honors students (Bowman & Culver, 2018). Fifteen percent of respondents were members of an honors program, 56% were female, and 76% were white. Prior to the propensity score
membership in honors programs is small in relation to GPA and it is not significant when relating to retention rates. They suggest that high achieving students are likely to be retained regardless of whether they are members of an honors program (Bowman and Culver, 2018).
ROTC Programs
CHAPTER THREE: METHODOLOGY Purpose of this Study
The purpose of this study was to understand the impact first-semester student involvement and student characteristics on retention and graduation rates of college students. While there is extensive and growing research on the impact of each individual category of Astin's Student Involvement Theory on academic performance (with the exception of ROTC), there is a very obvious gap in the literature about how these different experiences relate to each other. Most research is siloed into its respective involvement experience and does not consider the potential influence that other involvement experiences might have on their study. This suggests there are possible interactions among variables of shared variance across variables and suggests this might be why there are so many contradictory findings in the current literature.
Secondly, while more recent studies are considering incoming student demographics as influencers of student outcomes, this has not been a well-utilized practice within the research. Astin (1993) clearly states the importance of using pre-admitted student characteristics to explain student academic outcomes, yet many researchers fail to consider these characteristics. Including incoming student characteristics is imperative for generalizing findings to other institutions.
between GPA, retention, student involvement, and persistence to (4, 5, and 6 year) university graduation, while including students’ pre-entry characteristics. This study assessed what contributors predicted academic success and/or persistence at significant levels. A secondary purpose was to understand which students have higher involvement in certain types of activities and how it affected their student success. Understanding student involvement and its subsequent impacts will help universities focus efforts towards increasing student retention and graduation rates by improving university decision-making for policies that relate to student involvement and outcomes.
Research Questions
1. Among full-time students, is there a significant relationship between the level of student involvement during the first semester and graduating at four, five, and six years later?
2. Is there a significant relationship between level of first semester student involvement and first semester GPA?
3. Are certain types of involvement more predictive of student retention than others?
4. Are certain types of involvement more predictive of graduating? Null Hypothesis
Ho: There is no significant relationship between student involvement and
graduating.
H1: There is a significant relationship between student involvement and
graduating.
The participants for this study included traditional aged (graduated from high school the spring prior to enrolling, in addition to being 16-19 years of age) full-time students (12 credits or higher) who were enrolled during the fall 2012 semester at a mid-sized public institution located in the Pacific Northwest. In 2012, the institution had a total enrollment of over 22,000 students, with 2,300 living on campus. Among those students, 2,100 began their first year of study in the fall of 2012, and were included in this study.
Data Collection
As a routine practice, the Office of Institutional Research collects a variety of information on enrolled students. Several sources constructed the data, which were then supplied to the researcher. Institutional Review Board approval was obtained for this study, under protocol (101-SB19-014).
Demographic information from entering students was gathered, including gender, residency, unmet financial need, first generation standing, high school GPA, standardized tests score (ACT and/or SAT), and an “Admissions index score,” which is based on each student’s standardized test score and GPA. These data were considered entering
characteristics and were based either upon student self-reporting during the application process, or based on submitted materials (transcripts, test scores).
learning courses, 5) Honors College, 6) on-campus employment, 7) living learning communities, 8) recreation center use, 9) marching band membership, and 10) involvement in the student conduct process. In this study, student involvement was viewed as a set of independent variables that potentially moderate student retention and/or graduation rates.
Outcome variables (and predictor variables in some models) included students’ first semester GPA, as well as enrollment status at subsequent years. The primary outcome was time to graduation. This was coded as a series of binary outcome variables (0/1) to indicate whether each student had graduated at four, five, or six years post-entry.
Treatment of Data
The Office of Institutional Research collected student involvement data from their respective sources and matched the demographics, student involvement, GPA, and graduation by way of a unique student identification number assigned to each student upon applying to the university. The student ID number and all other identifying data (first and last names) were removed from the dataset prior to being turned over to the researcher in order to remain compliant with FERPA laws. The data set was transferred to Microsoft Excel, where all data entries were assigned a unique identification number by the researcher prior to analysis.
Nominal and ordinal data were re-coded as dummy variables to allow the data to be included as predictors in regression models as a set of categorical variables (Field, 2013).
Entering characteristics of students included: 1) Gender; 2) state residency; 3) citizenship; 4) entering high school GPA, 5) entering ACT score, 6) entering SAT score, 7) Admissions Index score, 8) Expected family (financial) contribution, 9) unmet
financial need, and 10) Pell Grant eligibility
Involvement variables were coded as binary variables (0 = no, 1 = yes) for each of the following categories: 1) athletics; 2) Greek life; 3) on-campus university housing; 4) service learning courses; 5) Honors College; 6) living learning community; 7) marching band membership; 8) on-campus employment; 9) participation in the student conduct process; and 10) club sports. One involvement variable, campus recreation, was coded using an ordinal scheme based on number of campus recreation uses per semester. The raw data ranged from zero to 110 uses. These data were collapsed to five groups: zero uses were coded as “0”, 1-4 visits per semester were coded as “1”; 5-15 visits per semester (less than once a week) were coded as “2”; regular users who visited 16-31 visits per semester (one to two visits per week) were coded as “3”; and frequent users (more than 2 times a week) were coded as “4.” This allowed for analyses comparing users and nonusers (0 vs 1 or more), and for analysis comparing extent of usage.
Key student outcome variables included: 1) fall 2012 semester GPA; 2)
cumulative GPA at Boise State; 3) total credits earned at Boise State University; and 4) graduation status at 4 years, 5 year, and 6 years (each as a binary variable where 0 = not graduated and 1 = graduated).
After the data were cleaned and coded, the dataset was exported to SPSS 25 for analysis. Data were analyzed with univariate, bivariate, and multivariate analyses and reported through frequency distribution charts and graphs to characterize the sample.
Due to the dependent variables being dichotomous (retention and graduation), logistic regression was used to analyze whether student involvement significantly affected graduation, while taking into account entering demographics. Logistic regression creates a non-linear prediction variable based on the probability of each predictor variable having an impact on the dependent variable (Muijs, 2011), using a log (p/1-p) transformation to examine the probability of whether graduation occurs, based on the combined values of the independent variables (demographics and interactions). Logistic regression yields an odds ratio for each predictor variable, which represents the amount by which the outcome increases (greater than 1) or decreases (less than 1) when the predictor variable is increased by 1 unit (Field, 2013). When the 95% confidence interval does not include the value of 1.0, the predictor variable is considered to make a significant contribution to predicting the outcome. Overall model fit to examine the incremental improvement of a series of models that add predictor terms of interest was based on the Cox and Snell R2 test, where 0-0.1 is a poor improvement, 0.1-0.3 is modest
improvement, 0.3-0.5 is a moderate improvement, and more than 0.5 is a strong improvement (Muijs, 2011).
model for consideration prior to being dropped, if they were found to not be significant (p <.05).
Testing Assumptions
Continuous variables (demographics and involvement) were tested for
CHAPTER FOUR: RESULTS
There were a total of 2,230 students enrolled in a degree seeking program during the fall 2012 semester. Among those students, 246 students did not meet the criteria of being a traditional aged student (above the age of 19 years old and/or not a spring 2012 high school graduate). Twenty-two students enrolled pursued a two-year Associate degree rather than a four-year Baccalaureate degree. The students who earned an
Associate degree and did not attempt any additional credits at the university (indicator of pursuing a Baccalaureate degree) after completing their Associate degree were removed from the study. After those students were removed from the sample, a total of 1,962 students remained for analysis.
The sample (Table 4.1) included 889 students who identified as male (45.3%), 1,071 students who identified as female (54.6%) and two students (0.1%) who did not report gender. Most students (n= 1,639, 83.5%) were aged 18 years. The sample included 1223 (62.3%) residents, and 739 (37.7%) non-residents. Fifty-one (2.6%) students identified as international students compared to 1,911 (97.4%) of the students who were from the United States. Because of limited variability in status as an
Table 4.1 Sample demographics
Category Frequency %
Gender
Male 889 45.3
Female 1071 54.6
Missing 2 0.1
Total (N = 1962) 1962 100.0
Student Age
Age 16 5 0.3
Age 17 125 6.4
Age 18 1639 83.5
Age 19 193 9.8
Total (N = 1962) 1962 100.0
In-State Resident
No 739 37.7
Yes 1223 62.3
Total (N = 1962) 1962 100.0
International Student
No 1911 97.4
Yes 51 2.6
Total (N = 1962) 1962 100.0
High school academic performance is reported in Table 4.2. The average high school GPA was 3.432 (SD = .374) from 1,930 students. Students’ standardized test scores included a SAT mean of 1062 (SD = 143.642) from the 955 students who reported an SAT score, and an ACT mean score of 23.01 (SD = 3.829) among 1426 students reporting ACT scores. The Admissions index, a standardized combination of high school GPAs and test scores, averaged 58.14 (SD = 15.634) and was available for 1,858