DOI: 10.30954/0424-2513.2.2018.34
©2018 New Delhi Publishers. All rights reserved
Statistical Investigation of Production Performance of Cumin
in India
P. Mishra
1*, K. Padmanaban
2, B.S. Dhekale
3and A.K. Tailor
41College of Agriculture, Jawaharlal Nehru Krishi Vishwa Vidyalaya, Powarkheda, Madhya Pradesh, India
2Department of Agricultural Statistics, Bidhan Chandra Krishi Viswavidyalaya, Mohanpur, Nadia, West Bengal, India 3Sher-e-Kashmir University of Agriculture Sciences and Technology, Kashmir, J&K, India
4Department of Statistics, National Horticultural Research and Development Foundation, Regional Research Station, Nashik, Maharashtra, India
*Corresponding author: [email protected]
ABSTRACT
Cumin is the dried, white fruit with greyish brown colour of a small slender annual herb. The surface of the fruit has 5 primary ridges, alternatively has 4 less distinct secondary ridges bearing numerous short
hairs. The flowers are white or rose-colored in small umbels. By and large there has been considerable
expansion in area and production of cumin in Gujarat, Rajasthan and whole India. Considering the productivity of cumin except Gujarat remaining state Rajasthan and whole India registered the negative
growth rate. Moreover, in states and whole India different factors are influencing productivity of cumin;
by and large nitrogen is the major factor to significantly effect on the cumin productivity. Also forecasting has been done using comparing ARIMA and GARCH model for year 2020. Globally seeing the cumin seed demandthis forecasting can be used policy implications and future trend of production and productivity
of cumin in India and major states. This helps shows that cumin production reached 375 and 562 ‘000 tonnes in year 2020 for Gujarat and whole India respectively.
Keywords: Trend analysis, factor ofproduction, ARIMA, GARCH, forecasting
The major countries that produce jeera or cumin seeds are India, Turkey, Syria, Iran and China. India is the biggest producer of Cumin Seeds in global spice market and new crop of Indian Cumin Seeds start every year February, this year crop expected 3.30 thousand metric tons out of this more than 70% of the crop consumed by domestic & Globally exported, since next new crop – 2017 have to go long path of 8 months and this year price are already high than comparing to previous years (Spices board of India, 2017). Syria stands second in the list with a production figure of 25000 tons. This clears out the India is far more dominant in this context than any other country as it also possess the maximum area in the cultivation of the spice. Turkey and Iran have the same level of production i.e. 15000 to 20000 tons of cumin seeds and that makes them both stand third in the leading producer’s list.
contain certain health-benefiting essential oils such as cuminaldehyde. The active principles in the cumin may improve gut motility and help in digestion by augmenting gastro-intestinal enzyme secretions. The spice is an excellent source of minerals like iron, copper, calcium, potassium, manganese, selenium, zinc and magnesium. It also contains very good amounts of B-complex vitamins such as thiamine, vitamin B-6, niacin, riboflavin, and other vital anti-oxidant vitamins like vitamin E, vitamin A, and vitamin C. Mishra et al. (2017) studied the future trend of black pepper in India. Sahu and Mishra (2017) forecasted for total species for India and China using ARIMA model. In present Investigation
the factors like fertilizers, environmental factors etc. affecting the production of cumin in India and its
future performance using forecasting models.
MATERIALS AND METHODS
India is the largest producer and consumer of cumin in the world. Indian output is currently estimated to
be around 445 thousand tonnes in the year of 2014.
Gujarat and Rajasthan are the major production centers of cumin in the country contributing 99 percentage of total production. For our study data of cumin area, production and productivity from
1991-2000 to 2013-14 were collected and analysed.
Descriptive statistics
Descriptive statistics are used to summarize and describe data. Some measures that are commonly used to describe a data set are measures of central tendency and measures of variability or dispersion and measures of association. Measures of central tendency include the mean, median and mode, while measures of variability include the standard deviation (or variance), range, the minimum and maximum values of the variables, kurtosis, skewness, simple growth rate and compound growth rate.
Trend models
Trend models generally pictures the overall movement of any time series. For this study parametric models were explored to trace the trends
of the production and trade behaviour (Borthakur and Bhattacharya, 1998) of cumin in India. The best fit models which are chosen for estimating the growth pattern is based on the R2 values obtained.
The model with highest R2 value is considered as
the best model.
Regression analysis
For the purpose of present study, the following regression model will be assumed.
Y = f (RF, Tmax, Tmin, N, P,K)
where,
Y = Cumin productivity (kg per hectare) RF = Rainfall (mm)
Tmax= Mean maximum temperature (oC)
Tmin= Mean minimum temperature (oC) N = Total nitrogen fertilizer consumption P = Total phosphorous fertilizer consumption K = Total potash fertilizer consumption Autoregressive Integrated Moving Average (ARIMA) Model
The ARIMA methodology is also called as
Box-Jenkins methodology. The emphasis of these methods is not on constructing single equation or
simultaneous equation models but on analyzing the
probabilistic or stochastic properties of economic time series on their own under the philosophy let the data speak for themselves and allow Yt to be explained by past or lagged values of Y itself and stochastic error terms.
The Box-Jenkins methodology
Box-Jenkins methodology helps to find the values of p, d and q of an ARIMA model for a time series.
Autoregressive model
The notation AR (p) refers to the autoregressive
model of order p. The AR(p) model is written:
1 P
t i t t
i
X c ρX ε
=
= +
∑
+where, ρ1, ρ2,…… ρp are the parameters of the model,
c is a constant and εt is white noise. Sometimes the
constant term is avoided.
Moving Average model
The notation MA (q) refers to the moving average
1 q
t t i t i
i
X µ ε θ ε−
=
= + +
∑
Where the θ1, ..., θq are the parameters of the model, μ is the expectation of Xt (often assumed to equal 0), and the εt, εt–1…
GARCH (Generalized Autoregressive Conditional Heteroskedasticity)
Bollerslev (1986) proposed the Generalized Auto Regressive Conditional Heteroscedascity (GARCH)
model in which conditional variance is also a linear
function of its own lags and has the following form:
2 2
t 0 1 t 1 q t q 1 t 1 p t p
h
= α + α ε + + α ε + β
−...
−h
−+ + β
...
h
−2 0
1 1
q p
t i t i j t j
i j
h
a
a
ε
−b h
−= =
= +
∑
+
∑
…(1)A sufficient condition for the conditional variance
to be positive is,
0 0, i , 1, 2,..., ; j 0, 1, 2,..., a > a ≥o i= q b ≥ j= p
The GARCH (p, q) process is weakly stationary if and only if
1 1 1 q p i j i j a b = = + <
∑ ∑
. The most popularGARCH model in applications is the GARCH(1,1)
model. The express GARCH model in terms of ARMA model, denote 2
t t ht
η ε
= − . Then from eq.(1).
(
)
( , ) 2 2 0 1 1Max p q p
t i j t i t j t j
i j
a
a
b
b
ε
ε
−η
η
−= =
= +
∑
+
+ +
∑
…(2)Thus, a GARCH model can be regarded as an
extension of the ARMA approach to squared series
{ }
2t
ε
.RESULTS AND DISCUSSION
Per se performance of cumin production in India
Per se performance of cumin is presented in Table 1. From the table, one can find that in India, the area of cumin cultivation increased from 73.60 thousand hectares (1991) to 858.90 thousand hectares (2014) with an average area of 321.88 thousand hectares
with registered simple growth rate of India is 14.96
over the study period. Leptokurtic and positively skewed nature of Gujarat, Rajasthan and whole India indicates that the steady improvement in area during the early period under consideration and remain almost same in later half. Considering the
states, Gujarat regarded highest average area (236.28 thousand hectares) of cumin followed by Rajasthan (221.83 thousand hectares) with registered simple growth rate of 4.25 percent for Gujarat and 4.80
percent for Rajasthan.
Cumin production in India has increased from 28.20 thousand tonnes (1991) to 513.90 thousand tonnes (2014) during the study period and has registered a simple growth rate of 41.90 percent per annum.
In case of Gujarat production has increased from
28.80 thousand tonnes to 283 thousand tonnes and registered growth rate of 23.74 percent. Considering Rajasthan, the production has increased from 23.67 thousand tonnes to 178 thousand tonnes and with simple growth rate of 18.77 percent. Both states
and whole India, positive skewness and kurtosis indicates that the maximum growth has taken place during the early period under study and
remained almost same in the latter half. In India, cumin with an average productivity of 413.34 kg/ha and productivity varied from 330 kg per hectare (1991) to 498.67 kg per hectare (2014) with the registered simple growth rate of -0.01 percent.
Gujarat (an average productivity of 469.36 kg/ha
and productivity varied from 303.01 kg per hectare to 589.64 kg per hectare) is the best state followed by Rajasthan (an average productivity of 351.76 kg/ ha and productivity varied from 219.42 to 531.02 kg/ha) with simple growth rate of 3.58 percent (Gujarat) and -1.34 percent (Rajasthan) respectively. In Gujarat, the negative value of kurtosis (-1.34) and skewness (-0.34) indicates that there has been marginal shift of productivity under cumin during recent year under study. Both Rajasthan and whole India, platykurtic and negative skewness (-0.01)
reveals that steady improvement in productivity during the early period under study and remain almost same in later half.
From the table it is clear that Gujarat is the single largest producer of cumin in the country accounting
for 60 per cent of total production and the rest
of cumin production in the country. Both Gujarat
and Rajasthan used to produce almost equal
amount output until the early 2000s. But output
from Gujarat increased rather steeply from year
2001 onwards and became the single largest producer. Though, Negative growth rate of cumin
productivity in Rajasthan is the reason behind it’s number two position in the cumin production.
Unseasonal rainfall at the time flowering is likely to affects the productivity of Rajasthan. Research on development of off season cumin varieties may
sustain the productivity of cumin in Rajasthan.
Trend analysis of area, production and productivity of cumin
Knowing the above overall performance, path of movement of the series was traced through parametric trends models. To workout the trends in area, production and yield of cumin different parametric model like polynomial, logarithmic, compound, growth, and exponential models as discussed in material and method section are attempted too. Among the competitive models the best model is selected on the basis of the maximum R2 value, significance of the model and
Table 1: Per se performance of cumin production in major states of India during 1991- 2014
Area (‘000 ha) Production (‘000 t) Productivity (kg/ha)
Gujarat Rajasthan India Gujarat Rajasthan India Gujarat Rajasthan India
Mean 236.28 221.83 321.88 110.25 75.87 182.28 469.36 351.76 413.34
SE 12.87 14.19 33.92 16.72 8.92 25.98 19.04 16.13 7.19
Kurtosis 0.78 -0.84 -0.03 0.27 0.11 -0.30 -1.34 -0.24 -0.52
Skewness 1.14 0.58 0.82 1.19 1.00 1.13 -0.34 0.44 0.19
Minimum 149.60 135.11 73.60 28.80 23.67 28.20 303.01 219.42 330.00
Maximum 374.00 368.00 858.90 283.00 178.00 513.90 589.64 531.02 498.67
SGR % 4.25 4.80 14.96 23.74 18.77 41.90 3.58 -1.34 -0.01
CGR % 2.97 3.25 6.05 8.25 7.36 7.59 2.62 -1.61 -0.01
Table 2: Trends in area, production and productivity of cumin in major states of India
Area (‘000 ha)
States Equation
Model Summary Parameter Estimates
R2 F df1 df2 Sig. Const. b1 b2 b3
Gujarat Quadratic 0.91 52.29 2 21 0.00 201 -5.81* (3.31) 0.530** (0.12)
Rajasthan Cubic 0.59 3.47 3 20 0.03 104 49.41* (19.75) -5.04* (1.81) 0.140** (0.04)
India Linear 0.66 17.48 1 22 0.00 77 8.44** (2.02)
Production (‘000 tonnes)
States Equation
Model Summary Parameter Estimates
R2 F df1 df2 Sig. Const. b1 b2 b3
Gujarat Quadratic 0.96 163.44 2 21 0.00 66 -8.97** (2.59) 0.766** (0.10)
Rajasthan Cubic 0.63 4.40 3 20 0.01 11 21.79* (11.88) -2.220** (1.09) 0.06* (0.02)
India Linear 0.57 10.55 1 22 0.04 44 2.83** (0.873)
Productivity (kg/ha)
States Equation Model Summary Parameter Estimates
R2 F df1 df2 Sig. Const. b1 b2 b3
Gujarat Linear 0.79 36.89 1 22 0.00 339 10.45** (1.72)
Rajasthan Linear 0.52 8.05 1 22 0.01 424 -6.46* (2.28)
India Linear 0.68 32.37 1 37 0.00 331 2.98** (0.52)
its coefficients. The following section presents the results of this exercise (Table 2).
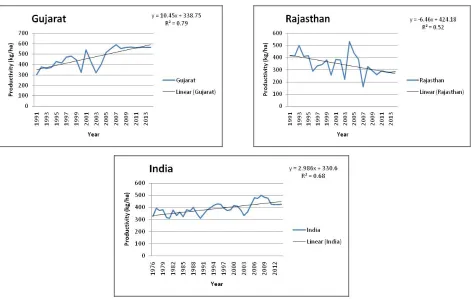
In all data series of area, production and productivity
of cumin in major states and whole India, non-linear patterns are revealed (Fig. 1.A, B and C) that, area
and production series of Gujarat and Rajasthan
fitted well with quadratic model and cubic model
respectively. Productivity of both states and all data series of whole India follow the linear trend. Positive
nature of third coefficient indicates increasing in
recent past in area and production of cumin in Rajasthan. Linear trend in productivity indicates that there is no change in productivity of cumin over the study period.
Thus from the test of trend analysis of area, production and productivity of cumin in major states of India the following important features has
emerges out. All data series of cumin production
follows the definite pattern of trend. Rajasthan shows increasing trend in area and production series. Trend in area and production of cumin in Gujarat and Rajasthan shows the increased
in nature, visualized by positive b2 coefficient
in Gujarat and b3 coefficient in Rajasthan. The increased trend shows interest of farmers to grow
cumin; whereas productivity of cumin fitted with
linear trend, almost straight line in entire study period. So meet the global need necessary actions are required to increase the production of cumin.
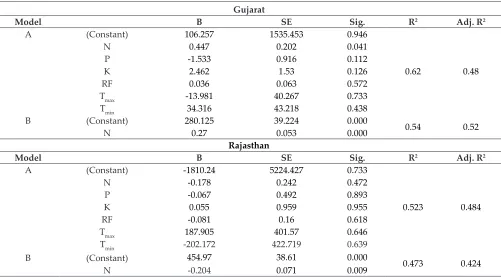
Regression analysis of factor affecting the
productivity of cumin in major states of India In order to find out the relationship of productivity with climatological and nutrients factors multiple linear regression equations are fitted. The most important factors influencing cumin productivity in major states is identified by using step-down regression analysis (Table 3). A significant coefficient
of nitrogen factor on productivity of cumin noticed in Gujarat and Rajasthan. A unit change in nitrogen fertilizer would lead to an increase in productivity of cumin by 0.27 kg per hectare in Gujarat and decrease in productivity by 0.204 kg per hectare in Rajasthan respectively. Similarly, in whole India potassium fertilizer and Tmin had significant coefficient on cumin productivity. Thus, one unit change in potassium fertilizer and Tmin would lead to increase in productivity of cumin by 0.016 kg per hectare and 29.205 kg per hectare respectively. From the above table it is clearly visible that not
all factors are equally effective on productivity of cumin. Moreover, in states and whole India different
Table 3: Regression analysis of factor affecting the productivity of cumin in major states of India
Gujarat
Model B SE Sig. R2 Adj. R2
A (Constant) 106.257 1535.453 0.946
0.62 0.48
N 0.447 0.202 0.041
P -1.533 0.916 0.112
K 2.462 1.53 0.126
RF 0.036 0.063 0.572
Tmax -13.981 40.267 0.733
Tmin 34.316 43.218 0.438
B (Constant) 280.125 39.224 0.000
0.54 0.52
N 0.27 0.053 0.000
Rajasthan
Model B SE Sig. R2 Adj. R2
A (Constant) -1810.24 5224.427 0.733
0.523 0.484
N -0.178 0.242 0.472
P -0.067 0.492 0.893
K 0.055 0.959 0.955
RF -0.081 0.16 0.618
Tmax 187.905 401.57 0.646
Tmin -202.172 422.719 0.639
B (Constant) 454.97 38.61 0.000 0.473 0.424
India
Model B SE Sig. R2 Adj. R2
A (Constant) 299.318 437.853 0.498
0.697 0.586
N 0.007 0.007 0.325
P -0.048 0.024 0.053
K 0.084 0.034 0.019
RF 0.092 0.065 0.164
Tmax -39.895 25.443 0.125
Tmin 73.79 30.939 0.022
B (Constant) -109.571 267.617 0.684
0.593 0.554
K 0.016 0.007 0.027
Tmin 29.205 15.69 0.070
Note: A is full model; B is step-down regression model.
Fig. 1A: Observed and expected trends of area under cumin in major states of India
Table 4: Best fitted ARIMA and GARCH models for area under cumin in India
State Model Model Selection Criteria
AIC BIC ME RMSE MAE MPE MAPE MASE R2
Area (000’ha)
Gujarat ARIMA(1,2,1)* 212.51 213.55 8.69 35.51 26.69 1.91 12.24 0.95 0.51 No GARCH
Rajasthan ARIMA(1,1,2)* 244.08 247.36 1.51 53.34 44.96 -5.58 21.42 0.95 0.58
GARCH (1,2) 278.95 287.19 2.44 57.36 52.17 -3.53 24.21 1.75 0.52
India ARIMA(1,1,2)* 445.83 453.74 0.35 20.72 19.42 -11.71 5.42 0.96 0.85 No GARCH
Production (‘000 tonnes)
Gujarat ARIMA(1,1,1)* 197.81 199.00 0.00 23.86 18.11 -11.39 24.59 0.97 0.88 No GARCH
Rajasthan ARIMA(1,1,2)* 226.16 230.10 0.45 36.43 30.27 -26.00 50.78 0.88 0.61
GARCH (1,2) 254.24 262.49 0.78 39.25 31.40 -19.49 50.78 1.23 0.49
India ARIMA(1,2,1)* 405.62 408.89 0.00 47.11 33.38 -11.62 29.15 0.99 0.91 No GARCH
Productivity (Kg/Ha)
Gujarat ARIMA(1,1,1) 243.50 244.55 11.92 74.28 52.56 1.29 12.15 0.95 0.58
GARCH (1)* 239.43 241.32 9.88 71.24 41.41 0.99 10.31 0.79 0.57
Rajasthan ARIMA(0,2,1)* 251.91 253.05 -5.48 54.20 40.60 -2.83 12.02 0.96 0.68
GARCH (1) 279.32 285.21 -4.87 57.74 56.01 -1.00 17.62 1.57 0.53
India ARIMA(2,1,1)* 375.66 382.31 -0.33 26.53 21.39 -0.51 5.28 0.77 0.64
GARCH (1,2) 447.18 459.83 0.47 28.78 23.25 -1.23 5.77 0.98 0.54
Note: * indicates the best model and used further for forecasting purpose.
factors are influencing productivity of cumin; by
and large nitrogen is the major factor to significantly effect on the cumin productivity.
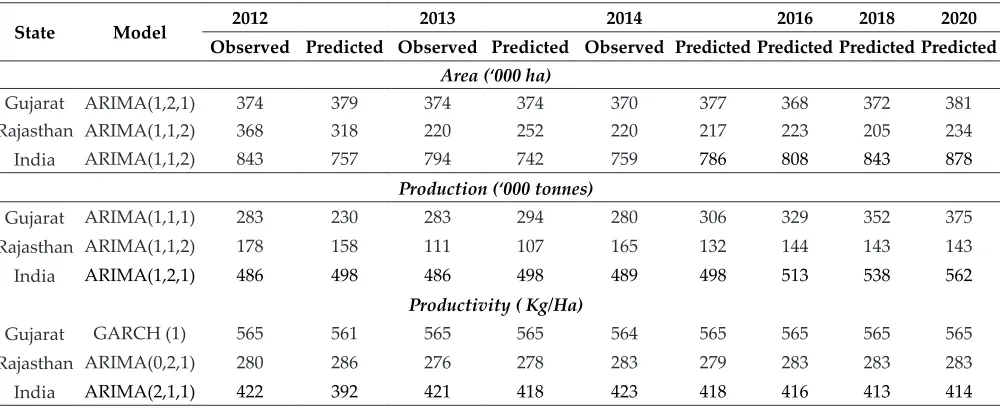
Modeling and Forecasting
From Table 4, shows the comparison between the GARCH and ARIMA model and used for forecasting purpose up to 2020. Best of ARIMA and GARCH models are selected based on the minimum value AIC, BIC, ME, RMSE, MAE, MPE, MAPE and
maximum value of R2. The selected models are also
validated for accuracy by using last three years data and observed that the actual and predicted
values are in range (Table 5). From the table it is clear that ARIMA(1,2,1) for Gujarat, ARIMA(1,1,2) for Rajasthan and whole India are found to be best ARIMA model for modeling area of cumin cultivation. Similarly among the various GARCH models, GARCH(1,2) for Rajasthan was best fitted GARCH models, whereas data series of area under cumin in Gujarat and whole India is found not to have GARCH effect. From the Table 4, it is clear
that ARIMA(1,2,1), ARIMA(1,1,1) and ARIMA(1,1,2) are found to be best ARIMA models for modeling
cumin production in Gujarat, Rajasthan and whole India respectively. In the same way, among the
various GARCH models, GARCH(1,2) for Rajasthan was best fitted GARCH model, whereas data series
of cumin production in Gujarat and whole India are
found not to have GARCH models. For modeling
cumin productivity in Rajasthan and whole India
ARIMA models are found to be better than GARCH. Considering Gujarat data series, GARCH(1) model
is found to be the best fitted.. Rajasthan shows no improvement, future year value remains same
as base year 2014 value and whole India shows declined value for future 2020 as compared to base year 2014.
CONCLUSION
Thus, from the study of per se performance of area, production and productivity of cumin the following salient features are emerge out. Gujarat is highest contributor of cumin followed by Rajasthan in India. Considering the annual growth rate the state Rajasthan registered highest in case of area and production. Gujarat registered highest annual growth rate in case of productivity. Cumin,
ARIMA model fitted well most compare to GARCH
model. On the basis of forecasted value, area of
cumin, whole India will be reached 878 ‘000 ha in year 2020. In production Forecasted value shows
increased trend in productivity as compared to the base year in the state of Gujarat. The state Gujarat indicates there would be marginal improvement in
cumin productivity for 2020. Appropriate policies
and high yielding varieties, resistant to adverse environmental condition varieties are required to increase the cumin productivity.
REFERENCES
Anonymous. 2016. Cumin seasonal synopsis, http://www.
commodityindia.com/ last accessed 10/07/2017.
Table 5: Validation and forecasting of area under cumin in India on the basis of selected best model
State Model 2012 2013 2014 2016 2018 2020 Observed Predicted Observed Predicted Observed Predicted Predicted Predicted Predicted
Area (‘000 ha)
Gujarat ARIMA(1,2,1) 374 379 374 374 370 377 368 372 381
Rajasthan ARIMA(1,1,2) 368 318 220 252 220 217 223 205 234
India ARIMA(1,1,2) 843 757 794 742 759 786 808 843 878
Production (‘000 tonnes)
Gujarat ARIMA(1,1,1) 283 230 283 294 280 306 329 352 375
Rajasthan ARIMA(1,1,2) 178 158 111 107 165 132 144 143 143
India ARIMA(1,2,1) 486 498 486 498 489 498 513 538 562
Productivity ( Kg/Ha)
Gujarat GARCH (1) 565 561 565 565 564 565 565 565 565
Rajasthan ARIMA(0,2,1) 280 286 276 278 283 279 283 283 283
Anonymous. 2017. Major state wise production of spices
in India, http://www.indianspices.com/ last accessed
13/07/2017.
Borthakur, S. and Bhattacharya, B.K. 1998. Trend analysis of area, production and productivity of potato in Assam”.
Economic Affairs, 43(4): 221-226.
Box, G.E.P. and Jenkins, G.M. 1976. Time series analysis:
Forecasting and control. Holden- day, San Fransisco. Bollerslev, T. 1986. Generalized Autoregressive Conditional
Heteroskedasticity. J Econnmet., 31(4): 307-327.
Mishra, P.,Padmanaban, K. and Dwivedi Meenakshee 2017. Modelling and Forecasting of Black Pepper Production in
India. Indian Journal of Ecology, 44(4): 741-745.
Sahu, P.K. and Mishra, P. 2013. Modelling and forecasting production behaviour and import- export of total spices