ISSN: 2149-214X
www.jeseh.net
Testing Measurement Invariance
of
Academic
Self-Efficacy
Scale
for
Singapore, Spain and Turkey
Ozen Yildirim, Eren Can Aybek 1
Pamukkale University
To cite this article:
Yildirim, O. & Aybek, E.C. (2019). Testing measurement invariance of academic
self-efficacy scale for Singapore, Spain and Turkey.
Journal of Education in Science,
Environment and Health (JESEH), 5(2), 156-163.
DOI:10.21891/jeseh.
585605
This article may be used for research, teaching, and private study purposes.
Any substantial or systematic reproduction, redistribution, reselling, loan, sub-licensing,
systematic supply, or distribution in any form to anyone is expressly forbidden.
Authors alone are responsible for the contents of their articles. The journal owns the
copyright of the articles.
Testing Measurement Invariance of Academic Self-Efficacy Scale for
Singapore, Spain and Turkey
Ozen Yildirim, Eren Can Aybek
Article Info
Abstract
Article History
Received: 12 January 2019
A scale that does not measure the same structure in different cultures should not be used in the cross-cultural comparison-based studies. The validity of the scales should be tested primarily for the countries. In this study, as the evidence of validity of the Programme for International Student Assessment (PISA) 2015 science self-efficacy scale, the measurement invariance has been tested for different cultures. As determined in scientific studies, general self-efficacy is focused on more and this should be examined in academic self-efficacy known to be to student learning and achievement. In the analysis of the data, the measurement model is initially tested. Then, the measurement invariance is tested with a series of analysis. As a result, the scale confirms a unidimensional structure for each country. However, it has provided partial measurement invariance. This indicates that item-based analysis should be conducted.
Accepted: 06 June 2019
Keywords
Measurement invariance Self-efficacy
PISA
Introduction
Determining the performance of the students and the related variables has an important place in educational research. Defended in terms of the effect of students’ characteristics on learning, the most important approach is that the students' own behaviors are important in the development of their motivation towards the lesson and thus in the realization of learning. In this research, one of the student behavior’s structure, the academic self-efficacy, is examined in terms of cultures. According to Bandura (1977a; 1977b) self-efficacy as one of the students' beliefs, is an important component in social cognitive theory. Self-efficacy can be assessed in three characteristics: Level, generality, and strength, throughout activities and contexts. The level of self-efficacy refers to the degree of difficulty of a given task. Generality, relates to the transferability of self-belief among activities. The strength of the efficacy is measured by the amount of certainty of carrying out a given task. Despite a general self-efficacy structure defined for everyone, Bandura states that self-efficacy is peculiar to a task and domain. Therefore, there are different kinds of self-beliefs, including social self-efficacy, emotional efficacy, and academic efficacy. The current study focused on academic efficacy (science self-efficacy), which concerns the individual's beliefs about his ability to reach the goals in the school context on his own. (Muris, 2001).
Academic self-efficacy is essential for learning and academic performance (Zimmerman, 2000). It is a positive predictor of academic achievement in different courses such as mathematics, reading, and science (Schunk, Pintrich, & Meece, 2008). In a meta-analysis study by Multon, Brown, and Lent (1991), it was stated that self-efficacy is a significant predictor of achievement and motivation in different population and environments. Similarly, low self-efficacy has been reported from low-performance students, while high-performance students has reported high self-efficacy and given greater value for their learning (Zusho, Pintrich, & Coppola, 2003).
157
J Educ Sci Environ Health
Current study focuses on academic self-efficacy rather than general self-efficacy, and the sample includes Asian, Middle Eastern and European cultures with different languages and cultural backgrounds. It includes Singapore from Asia, Turkey from the Middle East, and Spain from Europe. Lifestyle, the way of cultivation and the differentiation in their language can also differentiate the self-efficiency context in which students upload their academic self-efficacy. In the research, the validity of the self-efficiency scale specified in the Programme for International Student Assessment (PISA) 2015 for these countries is tested by the measurement invariance. When the literature is examined, the number of studies which evaluate the academic self-efficacy structure based on cross-cultural studies is determined to be limited. Ansong, Eisensmith, Masa, & Chowa (2016) tested the measurement invariance of the self-efficacy scale adapted for Ghana by emphasizing the differentiation by gender but not tested for different cultures. Teo and Kam (2014) tested measurement invariance of the general self-efficacy scale for Germany and Singapore as different cultures. Kıbrıslıoğlu Uysal and Akın Arıkan (2018) did not examine the intercultural comparison, but only tested the measurement invariance of PISA 2015 and PISA 2006 self-efficacy scale by years for Turkey sample.
PISA is a large-scale assessment, which reveals what students learn and how they can use mathematics, science, reading literacy in their daily life. PISA collects information about the characteristics of students, teachers, and schools which are related to performance (Organisation for Economic Co-operation and Development [OECD], 2017a). Around 70 countries participate in the PISA and these countries guide their own education policies based on the results obtained. However, such international measurement and assessment practices also inevitably bring along like a league of skills. After the explanation of the results of each test, the rankings of the countries draw attention. Performance and characteristics of the students are compared by country. Although PISA is developed by the specialists, any students from different cultures are subject to this test, and this causes the question of whether the tests in PISA measure the same structures in each country or not. There is uncertainty about whether the differences in the scale mean scores can be attributed to actual differences between countries or to differences in measurement between countries due to cultural biases in response, translation errors or cultural differences in understanding the underlying structure (Rutkowski & Svetina, 2014). Without any evidence supporting measurement equivalence, any claim or conclusion on comparative differences will necessarily remain weak (Vandenberg & Lance, 2000). An important criterion for intercultural comparison of scores from a scale is to understand and measure the latent variable in all cultures in the same way. This characteristic is often called as measurement invariance (Meredith, 1993), the absence of differential item functioning (Hambleton & Rogers, 1989; Swaminathan & Rogers, 1990) or lack of bias (Lord, 1980). The measurement invariance relates to whether the items in a measurement tool state the same construct for the individuals in different groups or not. Generally, measurement invariance surveys focus on whether the latent variable (self-efficacy, etc.) can be compared between heterogeneous groups (Rutkowski & Svetina, 2014).
Method
Sample
In this study that aims at a comparison of the academic self-efficacy structures between the students from different cultures; a group of 15-year-old students, who study in Singapore, Spain, and Turkey, constitute the research group. When the PISA 2015 technical report (OECD, 2017a) is examined, it is understood that the sample is selected by stratified sampling method by taking any characteristics such as schools, regions, etc. into consideration. This scale is applied to 6115 students from Singapore, 6736 students from Spain and 5895 students from Turkey. The outliers are removed from the data to make the data suitable for analysis. After the outliers are removed, the research is carried out with the data of 5521 students from Singapore, 5260 students from Spain and 4633 students from Turkey.
Data Collection
How easy do you think it would be for you to perform the following tasks on your own? 1. Recognize the science question that underlies a newspaper report on a health issue. 2. Explain why earthquakes occur more frequently in some areas than in others. 3. Describe the role of antibiotics in the treatment of diseases.
4. Identify the science question associated with the disposal of garbage.
5. Predict how changes in an environment will affect the survival of certain species. 6. Interpret the scientific information provided on the labelling of food items.
7. Discuss how new evidence can lead you to change your understanding about the possibility of life on Mars.
8. Identify the better of two explanations for the formation of acid rain.
For the items, there is a four-answer category: I could do this easily, I could do this with a bit of effort, I would struggle to do this on my own, and I couldn’t do this. For Singapore, Spain, and Turkey, Cronbach alpha coefficients of internal consistency are calculated for the answers given to the self-efficacy scale and in turn .88, .89 and .91 values are obtained.
Data Analysis
Before the analysis is conducted, the data is prepared for the analysis and assumptions have been tested. After PISA 2015 data is downloaded for this, all the data of Singapore, Spain, and Turkey is selected and data of other countries are removed from the data set. Then, to determine the outliers, the Mahalanobis distance coefficients are calculated and the persons with p < .001 are deemed as the outlier (Mertler & Reinhart, 2016) then removed from the data set. The study has been carried out with the data of 5521 students from Singapore, 5260 students from Spain and 4633 students from Turkey.
The multivariate statistics are used for testing the measurement invariance. Therefore, any particular assumptions must be met. Multivariate normal distribution of data is tested to this end. For this, R 3.5.1 (R Core Team, 2018) is used as the statistic software and the Henze-Zirkler tests are conducted by MVN 5.5 software package (Korkmaz, Goksuluk, & Zararsiz, 2014). For three countries, the result of the Henze-Zirkler test is calculated as p < .01. This shows that the data doesn’t meet multivariate normality assumption (Mecklin & Mundfrom, 2003). Therefore, the Robust Maximum Likelihood method is used in all estimates.
The semTools 0.5-1 (Jorgensen, Pornprasertmanit, Schoemann, & Rosseel, 2018) and semPlot 1.1 (Epskamp & Stuber, 2017) software packages are used for determining the measurement invariance. For this, firstly measurement model has individually tested via the confirmatory factor analysis for Singapore, Spain, and Turkey. Kline (2005) states that χ2/df ratio must be equal to or less than 3.00, and Tabachnick and Fidell (2007) state that the values equal to or less than 0.80 are acceptable for RMSEA. The values less than 0.08 indicate a good fit for SRMR (Hu & Bentler, 1995), and the values larger than 0.95 indicate a good fit for CFI and TLI (Brown, 2006).
After the confirmatory factor analysis, to determine whether the measurement invariance is met or not for three countries, “configural invariance (equal form); metric invariance (equal factor loadings), scalar invariance (equal indicator intercepts) and strict factorial invariance (equal indicator error variances) are tested in turn. Brown (2006, p.268) stated that “Number of factors and pattern of indicator-factor loadings is identical across groups” for the configural invariance. Only the factor loadings are equal between groups in the metric invariance, and it’s mean that respondents attribute the same meaning to the latent construct for all groups (van de Schoot, Lugtig, & Hox, 2012). Scalar invariance means that “the regression equations of the observed variables on the latent factors are equivalent across groups” (Schimitt & Kuljanin, 2008, p.212). And the strict invariance would be met if the indicator residuals are equal (Brown, 2006).
159
J Educ Sci Environ Health
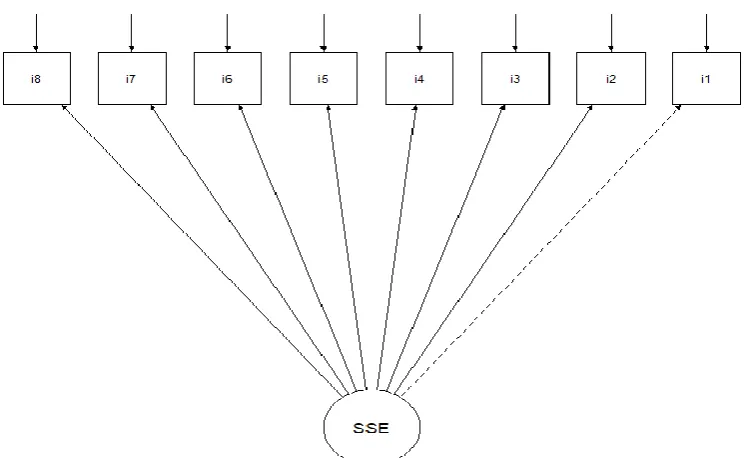
Figure 1.Tested measurement model
Results
Findings on Testing of the Measurement Model
Firstly, the measurement model shown in Figure 1 for Singapore, Spain, and Turkey is examined by the confirmatory factor analysis. The goodness of fit indexes obtained for confirmatory factor analysis is given in Table 1.
Table 1. Confirmatory factor analysis parameters for countries χ2
/sd RMSEA [90%CI] SRMR CFI TLI
Singapore 21.161 .060 [.056 - .065] .030 .970 .959 Spain 19.041 .059 [.054 - .063] .025 .976 .966 Turkey 25.776 .073 [.069 - .077] .034 .958 .941
When Singapore, Spain, Turkey, and three countries are considered together (All-Data), according to table 1, the RSMEA, SRMR, CFI and TLI values show that the unidimensional structure is verified. Only χ2
/df value is out of the acceptable limits but χ2 statistics depend on the sample size (Kline, 2005). As a result of the analysis, it is determined that the model is compatible with the data because the other fit indices are within acceptable limits. All the parameters obtained according to the confirmatory factor analysis results are shown in Table 2.
Table 2. Robust maximum likelihood estimates for self-efficacy scale
Singapore Spain Turkey
UFL SE SFL z UFL SE SFL z UFL SE SFL z
i1 1.000 .709 1.00 .716 1.000 .681
i2 .994 .022 .620 44.065 .928 .019 .674 48.894 1.082 .021 .736 51.286 i3 1.237 .025 .721 48.551 1.103 .018 .737 60.830 1.197 .026 .744 45.706 i4 1.223 .024 .765 50.181 1.030 .017 .736 60.282 1.217 .027 .795 45.662 i5 1.155 .024 .755 48.372 1.095 .019 .760 58.250 1.212 .028 .789 43.568 i6 1.214 .025 .758 49.372 1.025 .019 .722 55.050 1.219 .028 .773 43.947 i7 1.212 .026 .691 46.766 1.057 .020 .708 53.529 1.164 .029 .688 40.815 i8 1.063 .024 .660 43.562 1.103 .020 .730 54.766 1.230 .028 .756 43.498
When the unstandardized factor loadings for the items and z values for these factor loadings are examined, it is observed that the factor loadings obtained for all items are significant. The goodness of fit indexes shown in Table 1 and the Robust Maximum Likelihood Estimates given in Table 2 are considered, it is understood that the science self-efficacy is measured unidimensional for all of the countries.
Findings on Testing of the Measurement Invariance
After the measurement model is verified for the countries, the invariance of the structure to be measured by the science self-efficacy scale between the countries is tested. For this, the configural, metric, scalar and strict invariance are tested in turn. As a result of the analysis, the fit indexes and ΔCFI values are examined. The findings on the analysis of the measurement invariance are given in Table 3.
Table 3. Findings on testing of the measurement invariance
Measurement invariance df χ2 RMSEA SRMR TLI CFI ΔCFI
Configural 60 1337.121 .064 .027 .955 .968
Metric 74 1556.188 .062 .036 .961 .966 .002
Scalar 88 3766.122 .090 .059 .922 .919 .047
Strict 90 4074.569 .093 .079 .918 .912 .007
When Table 3 is examined, it is understood that the self-efficacy scale provides the configural invariance (CFI > .95; RMSEA < .08). In other words, the science self-efficacy scale has the same factor structure for all three countries. Furthermore, the other findings provide additional evidence for configural invariance.
When the findings obtained for metric invariance are examined, it is observed that ΔCFI value is less than 0.01. Thus, the science efficacy scale also provides the metric invariance. In other words, the science self-efficacy scale shows invariance between the countries in terms of factor structure and factor loadings.
However, when the scalar invariance findings are examined, it is determined that ΔCFI value between the metric and scalar invariance models is larger than 0.01. Namely, the indicator intercepts and indicator error variances doesn’t show invariance between the countries. Therefore, it is concluded that the PISA 2015 science self-efficacy scale has a partial invariance between Singapore, Spain, and Turkey.
Discussion and Conclusion
In the research, the structure and measurement invariance of the science self-efficacy scale, used in the PISA 2015 assessment, tested for Singapore, Spain and Turkey which have a different culture and language. The findings of the measurement invariance studies have important effects on the use of the scale in different cultures. A validated scale should be sensitive to measure changes in self-efficacy independent of cultural characteristics (Bialosiewicz, Murphy, & Berry, 2013).
161
J Educ Sci Environ Health
At the second step of the research, the measurement invariance of the scale is tested. The scale provides the configural invariance structure. The fit indexes are at the acceptable level. If the configural invariance structure is provided, it is pointed out that students adopt the same conceptual perspective for the science self-efficacy in Singapore, Spain, and Turkey. The metric invariance is also provided between the countries. Metric invariance is achieved when different groups respond in a similar way to the same item. This means that the strength of the relationship between item and structure is the same among groups. When metric invariance is achieved, the scores obtained from the items can be compared between groups, and the variation observed in items may indicate differentiation between the groups in terms of the measured structure (Milfont & Fischer, 2010). As a result of the study, it can be said that the relationships between the characteristics of the scale items and the self-efficacy structure are similar for the countries. It is generally seen as satisfactory when the configured invariance is met (Sholz et al. 2002). The metric invariance is a prerequisite for testing scalar invariance analysis. The scalar invariance of the self-efficacy structure is not provided between the countries. Scalar invariance must be ensured to compare mean scores. The observed scores are related to the latent variable and individuals have the same score mean that they have the same score of structure regardless of group membership (Milfont & Fischer, 2010). If you do not have proof for scalar invariance, the latent structure cannot be compared among groups. Failure to provide scalar invariance also indicates that items can show bias relative to countries and in this case, it is not possible to make comparisons among countries (Steenkamp & Baumgartner, 1998). Students who are in the same population and are members of different groups may differ in their tendency to correctly answer a question or to endorse a category. This situation is associated with item bias (Yavuz, Dogan, Hambleton, & Yurtcu, 2018; Zumbo, 1999). When examining item properties, it is important to examine item bias depend on many different group characteristics (gender, language, socio-economic status, culture, etc.) (Millsap & Everson, 1993).
When the items listed in the self-efficacy scale are also reviewed, it is observed that the items are written by considering the natural events that may be encountered by the students in their life. For example, “Explain why earthquakes occur more frequently in some areas than in others” and etc. The context imposed by the student on the relevant event may differentiate by cultures, this can also lead to inter-group differentiation. The item properties must be discussed and the item bias must be reviewed in a separate study.
References
Ansong, D., Eisensmith, S. R., Masa, R. D. & Chowa, G. A. (2016) Academic self‐efficacy among junior high school students in Ghana: Evaluating factor structure and measurement invariance across gender.
Psychology in the School, 53(10), 1057-1070 doi: 10.1002/pits.21975
Bandura, A. (1977a). Self-efficacy: Toward a unifying theory of behavioral change. Psychological Review, 84(2), 191-215. doi:10.1037/0033-295X.84.2.191
Bandura, A. (1977b). Social learning theory. Englewood Cliffs, New Jersey: Prentice-Hall
Bandura, A., Pastorelli, C., Barbaranelli, C., & Caprara, G.V. (1999). Self-efficacy pathways to childhood depression. Journal of Personality and Social Psychology, 76(2), 258-269. doi:10.1037/0022-3514.76.2.258
Bialosiewicz, S., Murphy, K., & Berry, T. (October, 2013). An introduction to measurement invariance testing: Resource packet for participants. Do our measures measure up? The critical role of measurement invariance? Demonstration Session American Evaluation Association, Washington, DC Retrieved from http://comm.eval.org/HigherLogic/System/DownloadDocumentFile.ashx?DocumentFileKey=63758fed -a490-43f2-8862-2de0217a08b8
Brown, T. A. (2006). Confirmatory factor analysis for applied research. New York, NY, US: Guilford Press. Chen, F. F. (2007). Sensitivity of goodness of fit indexes to lack of measurement invariance. Structural equation
modeling, 14(3), 464-504.
Cheung, G. W., & Rensvold, R. B. (2002). Evaluating goodness-of-fit indexes for testing measurement invariance. Structural equation modeling, 9(2), 233-255.
Epskamp, S. & Stuber, S. (2017). semPlot: Path diagrams and visual analysis of various SEM Packages' Output. R package version 1.1. Retrieved from https://CRAN.R-project.org/package=semPlot
Hambleton, R.K., & Rogers, H.J. (1989). Detecting potentially biased test items: Comparison of IRT area and Mantel-Haenszel methods. Applied Measurement in Education, 2(4), 313-334 doi: 10.1207/s15324818ame0204_4
Jorgensen, T. D., Pornprasertmanit, S., Schoemann, A. M., & Rosseel, Y. (2018). semTools: Useful tools for structural equation modeling. R package version 0.5-1. Retrieved from https://CRAN.R-project.org/package=semTools
Kıbrıslıoğlu Uysal, N, & Akın Arıkan, Ç. (2018). Measurement invariance of science self-efficacy scale in PISA. International Journal of Assessment Tools in Education, 5 (2), 325-338. doi: 10.21449/ijate.379508
Kline, R.B. (2005). Principles and practices of structural equation modelling. New York: The Guilford Press. Korkmaz S, Goksuluk D, & Zararsiz G. (2014). MVN: An R Package for Assessing Multivariate Normality.
The R Journal. 6(2):151-162.
Lord, F. M. (1980). Applications of item response theory to practical testing problems. Hillsdale, NJ: Lawrence Erlbaum Associates.
Meade, A. W., Johnson, E. C., & Braddy, P. W. (2008). Power and sensitivity of alternative fit indices in tests of measurement invariance. Journal of applied psychology, 93(3), 568-592. doi: 10.1037/0021-9010.93.3.568.
Mecklin, C. J., & Mundfrom, D. J. (2003). On using asymptotic critical values in testing for multivariate
normality. InterStat, 1(1-12), 152. Retrieved from
https://pdfs.semanticscholar.org/c6c9/d37cf66a225bdc251d421c18688ca7cefc95.pdf
Meredith, W. (1993). Measurement invariance, factor analysis and factorial invariance. Psychometrika, 58(4), 525-543. doi:10.1007/BF02294825
Mertler, C. A., & Reinhart, R. V. (2016). Advanced and multivariate statistical methods: Practical application and interpretation. Routledge.
Milfont, T. L., Fischer, R., (2010). Testing measurement invariance across groups: applications in cross-cultural research. International Journal of Psychological Research, 3(1), 111-121.
Millsap, R. E., Everson, H. T., (1993). Methodology review: Statistical approaches for assessing measurement bias. ApplPsychol Measure, 17(4), 297-334. doi: 10.1177/014662169301700401
Multon, K. D., Brown, S. D., & Lent, R. W. (1991). Relation of self-efficacy beliefs to academic outcomes: A meta-analytic investigation. Journal of Counseling Psychology, 38(1), 30-38. doi:10.1037/0022-0167.38.1.30
Muris, P. (2001). A brief questionnaire for measuring self-efficacy in youths. Journal of Psychopathology and Behavioral Assessment, 23(3), 145-149. doi: 10.1023/A:1010961119608
Organisation for Economic Co-operation and Development. (2010). TALIS 2008 Technical Report. Retrieved from http://www.oecd.org/education/school/44978960.pdf on 20.11.2018.
Organisation for Economic Co-operation and Development. (2017a). Programme for International Students
(PISA) 2015 Technical Report. Retrieved from http://www.oecd.org/
pisa/sitedocument/PISA-2015-technical-report-final.pdf on 15.11.2018.
Organisation for Economic Co-operation and Development. (2017b). Student Questionnaire for PISA 2015.
Retrieved from http://vs-web-fs-1.oecd.org/pisa/PISA2015-ENG_Quest.zip on 15.08.2018.
R Core Team (2018). R: A language and environment for statistical computing. R Foundation for Statistical Computing, Vienna, Austria. Retrieved from https://www.R-project.org/.
Rutkowski, L., & Svetina, D. (2014). Assessing the hypothesis of measurement invariance in the context of large-scale international surveys. Educational and Psychological Measurement, 74(1), 31-57.
Schmitt, N., & Kuljanin, G. (2008). Measurement invariance: Review of practice and implications. Human Resource Management Review. 18. 210-222. doi: 10.1016/j.hrmr.2008.03.003
Scholz, U., Doña, B. G., Sud, S., & Schwarzer, R. (2002). Is general self-efficacy a universal construct? Psychometric findings from 25 countries. European Journal of Psychological Assessment, 18(3), 242-251.
Schunk, D.H., Pintrich, P.R., & Meece, J.L. (2008). Motivation in education: Theory, research, and applications. Upper Saddle River, NJ: Pearson/Merrill Prentice Hall.
Steenkamp, J. E. M., & Baumgartner, H. (1998). Assessing measurement invariance in cross‐national consumer research. Journal of Consumer Research, 25(1), 78-107. doi:10.1086/209528
Swaminathan, H., & Rogers, H.J. (1990). Detecting differential item functioning using logistic regression procedures. Journal of Educational Measurement, 27(4), 361-370.
Tabachnick, B. G., & Fidell, L. S. (2007). Using multivariate statistics. USA: Pearson Education.
Teo, T., & Kam, C. (2014). A Measurement invariance analysis of the general self-efficacy scale on two different Cultures. Journal of Psychoeducational Assessment, 32(8), 762– 767. doi:10.1177/0734282914531707
163
J Educ Sci Environ Health
van de Schoot, R., Lugtig, P., & Hox, J. (2012). A checklist for testing measurement invariance. European Journal of Developmental Psychology. 9(4). 486-492. doi: 10.1080/17405629.2012.686740
Yavuz, S., Dogan, N., Hambleton, R. K., & Yurtcu M. (2018). The comparison of differential item functioning predicted through experts and statistical techniques. Cypriot Journal of Educational Science. 13(2), 137-148
Zimmerman, B.J. (2000). Self-Efficacy: An essential motive to learn. Contemporary Educational Psychology, 25(1),82-91 doi: 10.1006/ceps.1999.1016
Zumbo, B. D. (1999). A handbook on the theory and methods of differential item functioning (DIF): Logistic regression modeling as a unitary framework for binary and likert-type (ordinal) item scores. Ottawa, ON: Directorate of Human Resources Research and Evaluation, Department of National Defense. Zusho, A., Pintrich, P. R., & Coppola, B. (2003). Skill and will: The role of motivation and cognition in the
learning of college chemistry. International Journal ofScience Education, 25(9), 1081-1094.doi: 10.1080/0950069032000052207
Author Information
Özen Yıldırım
Pamukkale University
Faculty of Education, Pamukkale Denizli / TURKEY
Contact e-mail: [email protected]
Eren Can Aybek
Pamukkale University