Impact of Women Labour and its Utilization under different
Agro-Climatic Zones with Reference to different Farm Size
Groups in State of Assam
Mrinali Gogoi Borah and Amod Sharma*
1Department of Agriculture, Government of Assam, Jorhat, India.2Department of Agricultural Economics, Nagaland University, SASRD, Medziphema Campus, Dimapur, Nagaland, India. Corresponding author: [email protected]
Paper No. 219 Received: 24 January 2015 Accepted: 20 April 2015
ABSTRACT
In this paper an attempt has been made to estimate the impact of women labour and its utilization undertaken based on different agro-climatic zones with reference to different farm size group in the state of Assam, study further reveals that out of the total population in the sampled households, 48.27 per cent are female, out of that 23.07 per cent were comprising between the age group of 15-59 years, 16.42 per cent were below 15 years and it was least with 8.78 per cent were above 59 years. The availability of human labour was found to be 763.61 mandays (out of that 733.79 mandays are of family and 29.8 mandays attached labour) per farm of which 50.58 per cent was female labour. On the other hand, per hectare availability was recorded to be 515.8 mandays. The above study brought out the fact that in Assam, women participation was substantial in crop production activities. The utilization of female labour in rice cultivation, especially in HYV rice, is most noteworthy, respectively.
Keywords: Impact, women, utilization, rice, crop, production.
Women constitute almost half of the world’s population. Role of women in agriculture has become an important issue since it was discussed by Boserup as early as in 1970 and distinguished between male, female and mixed farming system (Subrahmanyam, 1999). Since then, last few decades have seen a transformation of agricultural sector with increasing number of women joining agricultural workforce. In India, agriculture and allied activities are the main stay of economic, social, cultural and political fabric of the nation. Among the working force in India, 50.19 per cent earns livelihood from agriculture (Economic Survey, 2013). Rural Indian women are extensively involved in agriculture activities. The mode of female participation in agriculture production varies with the land owing status of farm households. According to Krishna (2006) in rural India, the percentage of women who depend on agriculture
for their livelihood is as high as 84 per cent. Women make up about 33.00 per cent of cultivators and about 47.00 per cent percent of agricultural laborers. These statistics do not account for work in livestock, fisheries and various other ancillary forms of food production in the country. During 2009, out of the total women agricultural labor force in crop cultivation, 94.00 per cent of was engaged in cereal production, while 1.40 per cent worked in vegetable production and 3.72 per cent was associated with fruits, nuts, beverages, and spice crops (Singh and Sengupta, 2009). Another study by the Centre for Trade and Development and Heinrich Boell Foundation (2009) recorded that women’s participation rate in the agricultural sectors is about 47.00 per cent in tea plantations, 46.84 per cent in cotton cultivation, 45.43 per cent growing oil seeds and 39.13 per cent in vegetable production. Cultivation of these crops is labor-intensive and the work is considered quite unskilled.
almost similar to country’s overall picture. Assam is a typical backward economy. The participation of Assamese women is quite prominent in the primary sectors. The field of activities of women in Assam can broadly be grouped into 3 different divisions viz; Household work without direct economic benefit, participation in the family farms in different agricultural operations and wage earning employment.
Table 1. Selection of sample farmers and its household size to its total population
S.
No. Size group
Numbers of
house-hold
Percen-tage to total
Total Population
Male Female Total
1. Marginal 251 41.83 718
(53.34) (46.66)628 (100.00)1346
2. Small 250 41.67 704
(50.83) (49.17)681 (100.00)1385
3. Medium 73 12.17 263
(51.37) (48.63)249 (100.00)512
4. Large 26 4.33 95
(47.98) (52.02)103 (100.00)193
All farms sample 600 100 1780
(51.73) (48.27)1661 (100.00)3441
(Figure in parenthesis indicates percentage to total) The participation of women in agriculture is increasing at all India level (Kaur, 1991). Due to illiteracy and poverty, large populations of women in rural areas are engaged in agricultural works as farm labourers or cultivators for improving their economic status. Some other reasons for increased demand for women labour in agriculture are introduction of HYV seeds and mechanization in paddy cultivation. These two opposing forces on labour demand has the net effect of a mild increase in demand for total labour, but a sharp increase in the demand for women labour by 85.00 per cent (Subarhmanyam, 1999). Men have withdrawn from agricultural activities leaving women to take up the slack (Meenakshi. 1999). The participation of women is consistently higher vis-a-vis men in the farm sector because of occupational shift by men towards secondary and tertiary sectors. Low literacy rate and poor skill levels of women constrain them to stay in the farm sector (Dahiya et. al., 1999). In most of the
their own family farms and homestead gardens. In Orissa, kitchen gardening provides employment to 84.00 per cent of women while 52.00 to 72.00 per cent of them are employed in forestry activities (Behura et. al., 1999). Significant role of women in all daily household and agricultural activities is also reported by Roy (1999). Women contribute 60.00 per cent of the labour need in dairy and more than 45.00 per cent of the total labour requirement in sericulture and agricultural activities in karnataka (Jyothi., et.al 1999). Likewise in Maharastra, contribution of women labour, both hired and owned, constitute 61.58 per cent of the total labour required in the process of crop production and 18.00 per cent in livestock management (Birari et. al.1990). The contribution of women to total income in all the important crops and livestock is higher than that of male labour in Himachal Prodesh (Singh, 1999). In the hills of Uttar Pradesh, annual contribution of women in crop production is 230 days/ha accounting for 80 per cent of total labour (Tripathi, 1999). Out of total labour time spent by women on various activities, their active participation in farm operations accounted for more than 80 per cent (Bhuvaneswari and Kannan, 1998). In Andhra Pradesh, each hectare net area generates employment for 137 days of which more than 50 per cent is women (Rao, 2006).
So far in Assam, few studies on contribution of women in different activities have been carried out. Among them a study conducted by Subrahmanyam (1999) reports that on an average woman are employed for 222.61 days / year of which 38.00 per cent on crop production. 7.50 per cent on food processing, 15.20 per cent on handloom weaving while 39.30 per cent on animal care activities. Women workforce participation rate in crop production is 42.00 per cent almost equal male participation rate of 47.00 per cent. Women carryout 31.01 per cent works in agriculture and allied activities, 42.85 per cent works in rearing of livestock and other animals (Gogoi, 1999).
Methodology
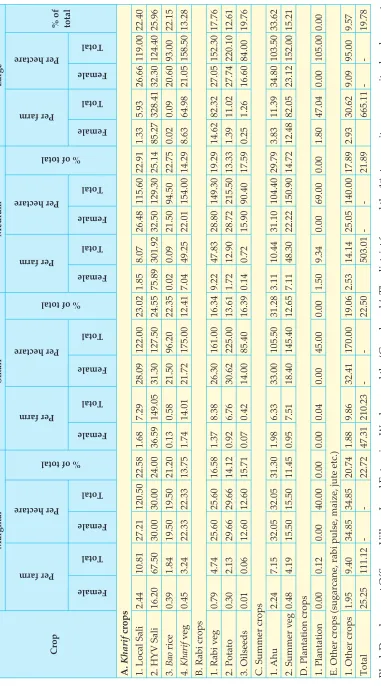
Table 2. Cr
op wise utilization of women labour
(in mandays) Crop Marginal Small Medium Large Per farm Per hectare
% of total Per farm
Per hectare % of total Per farm
Per hectare % of total Per farm
Per hectare % of total
Female Total Female Total Female Total Female Total Female Total Female Total Female Total Female Total A. Kharif crops
1. Local Sali
2.44 10.81 27.21 120.50 22.58 1.68 7.29 28.09 122.00 23.02 1.85 8.07 26.48 115.60 22.91 1.33 5.93 26.66 119.00 22.40
2. HYV Sali
16.20 67.50 30.00 30.00 24.00 36.59 149.05 31.30 127.50 24.55 75.89 301.92 32.50 129.30 25.14 85.27 328.41 32.30 124.40 25.96 3. Bao rice 0.39 1.84 19.50 19.50 21.20 0.13 0.58 21.50 96.20 22.35 0.02 0.09 21.50 94.50 22.75 0.02 0.09 20.60 93.00 22.15 4. Kharif v eg 0.45 3.24 22.33 22.33 13.75 1.74 14.01 21.72 175.00 12.41 7.04 49.25 22.01 154.00 14.29 8.63 64.98 21.05 158.50 13.28
B. Rabi crops 1. Rabi v
eg 0.79 4.74 25.60 25.60 16.58 1.37 8.38 26.30 161.00 16.34 9.22 47.83 28.80 149.30 19.29 14.62 82.32 27.05 152.30 17.76 2. Potato 0.30 2.13 29.66 29.66 14.12 0.92 6.76 30.62 225.00 13.61 1.72 12.90 28.72 215.50 13.33 1.39 11.02 27.74 220.10 12.61 3. Oilseeds 0.01 0.06 12.60 12.60 15.71 0.07 0.42 14.00 85.40 16.39 0.14 0.72 15.90 90.40 17.59 0.25 1.26 16.60 84.00 19.76
C. Summer crops 1. Ahu
2.24 7.15 32.05 32.05 31.30 1.98 6.33 33.00 105.50 31.28 3.11 10.44 31.10 104.40 29.79 3.83 11.39 34.80 103.50 33.62
2. Summer v
eg 0.48 4.19 15.50 15.50 11.45 0.95 7.51 18.40 145.40 12.65 7.11 48.30 22.22 150.90 14.72 12.48 82.05 23.12 152.00 15.21 D. P lantation crops 1. P lantation 0.00 0.12 0.00 40.00 0.00 0.00 0.04 0.00 45.00 0.00 1.50 9.34 0.00 69.00 0.00 1.80 47.04 0.00 105.00 0.00
E. Other crops (sugarcane, rabi pulse, maize, jute etc.) 1. Other crops
1.95 9.40 34.85 34.85 20.74 1.88 9.86 32.41 170.00 19.06 2.53 14.14 25.05 140.00 17.89 2.93 30.62 9.09 95.00 9.57 Total 25.25 111.12 -22.72 47.31 210.23 -22.50 503.01 -21.89 665.11 -19.78 Block Dev elopment Officers, V illage Lev el Extension Workers and the ‘Gaonburah’. The district formed the 1
st stage
units,
community
dev
elopment
blocks the 2
nd stage and village selected formed the 3 rd stage units. In the 4 th stage, the ultimate households w
sample size
S. No Name of the District Name of the Block Name of the Villages
1.
Sivasagar Chepangoni DuliaNatun Lunpuria Puroni Lunpuria 4. Maiguri Chetia 5. Dhepor
2.
Nagoan Khagorijan 1. Simoluguri2. Kachamari 3. Bahuabheti 4. Raidangia 5. Juria
3.
Nalbari Pub-Nalbari SariahtoliGhograpar Janjiabari 4. Hagarkuchi 5. Dihjari
4.
Dhemaji Sisiborgaon JalokiahutiJorigaon Halakhani 4. Michukochari 5. Silabali
5.
Karbi Anlong Lumbajong RangkanthirNepali Basti Lurulangso 4. Beltola 5. Rangniihang
6.
Karimganj NorthKarimganj Aagbarpur Khujab
Maizdihy 4. Dorakuna 5. Ulukandi
In the 1st stage of sampling design, one district was
randomly selected from each of the 6 (six) agro-climatic zones. For the selection of blocks, all the blocks were listed for each of the selected district and one block from each district was selected using random number. In the 3rd stage, 5 numbers of villages were selected from the list of villages in
finally selected for collection of primary data. In the selection of households, a list of households for each of the selected village was prepared based on their occupational holding. The occupational holdings of the households were arranged in ascending order of their size and categorized into 4 distinct size groups, e.g. marginal (up to 1 hectare), small (1.01 to 2.0 hectare), medium (2.02 to 3.0 hectare) and large (above 3.0 hectare) farms. A sample of 20 households was selected from each of selected village in proportion to the number of household in each category. Thus a total of 600 households were finally selected for the study comprising of 251 marginal, 250 small, and 73 medium and 26 large farms.
The relevant secondary data were collected from the respective District Agriculture officers, Sub-divisional Agriculture Officers and Block Development Officers. For the purpose of collecting primary data, the women member of the selected households was interviewed with a set of specially designed schedules and questionnaires during the
year 2012 and 2013.
The collected data were processed and tabulated according to different size categories of farms. Relevant information on various parameters was computed and expressed on the basis of per farm and per hectare. Mostly tabular analysis was carried out to present the result of the study by using statistical tools like average and percentage.
Results and Discussion
Table 1 reveals that the crop wise utilization of female labour in different size group of farms on per farm and per hectare basis have been worked out that among all the crops, potato was recorded to be the most labour intensive crop, while in bao rice
As far as female labour was concerned, it was observed that female labour utilization was more in rice followed by vegetables and potato. On the other hand, female labour utilization was nil in maintenance of plantation crops, since the men folk usually engaged in most of these operations. Among the crops under different size categories, labour utilization was found to be the highest (34.80 mandays per hectare) in ahu rice in large size group and the lowest (12.60 mandays per hectare) in oilseed in marginal farms.
In terms of percentage of female labour to total labour, it was recorded that higher percentage of female labour was utilized in cultivation of HYV rice followed by local rice and vegetables and minimum in oilseeds. Among all the crops under study across different size categories of farms, female labour utilization ranged from as low as 11.45 per cent in summer vegetables in marginal size group to as high as 33.62 per cent in ahu rice in large size group of farms.
The study on intergroup utilization of female labour in different activities revealed ahu rice (HYV) as the most important in all the groups where utilization of female labour 32.05 (31.30 per cent of total labour), 33.00 (31.28 per cent of total labour), 31.10 (29.79 per cent of total labour) and 34.80 (33.62 per cent of total labour) mandays per hectare in marginal, small, medium and large size group of farms, respectively. Next to ahu, utilization of female labour was found to be higher in HYV sali with 24.00 (30.00 mandays), 24.55 (31.3 mandays), 25.14 (32.50 mandays) and 25.96 (32.30 mandays) per cent of total labour in marginal small, medium and large group of farms, respectively.
Policy Implications
The following policy implications are derived from the present study:
1. First of all education of women both formal and informal in specialized field will lead to meaningful participation of female in different agricultural and allied activities. So, policy makers should enact appropriate policy to educate women in specialized field of activities.
2. Education of women will lead to take equal participation with their male counter
parts in non-farm economic activities. Of course, now-a-days women are given equal privilege with male to become educated as one desires to be.
3. Promotion and implementation of employment oriented home based subsidiary occupational programmes for women such as poultry, dairy, piggery, bee keeping, sericulture, mushroom cultivation, weaving, tailoring, knitting and cutting, beautician, boutique, embroidery etc. will generate additional gainful employment for rural women. Due importance need to be given to such occupations.
4. Training on potential employment oriented activities to create awareness, generate interest, motivate learning, impart knowledge and generate skill on the part of women worker is very much essential. So, appropriate policies should be made to provide such training.
5. Development of agro-based and small scale industries will help in generating employment opportunities for women. So policies should be made to develop such
industries.
6. Policies to develop programmes like women’s co-operative should be made to promote a healthy outlook and right type of attitude of women for transformation of the village community.
References
Behura, D., Roy, P. and Sakia, DC. 1999. An Economic assessment of Role of Women in Traditional farming
society in Orissa: A case study. Indian J Agricultural Economics. 5(3): 300-306.
Bhuvaneswary, S. and Kannan, K. 1999. Women in Agriculture
and Rural Development. Indian J Agricultural Economics.
54(3): 319-324.
Birary, KS. Nawadkar, DS. and Mali, BK. 1999. Employment pattern of women with special reference to Agriculture in
Maharastra.Indian J Agricultural Economics.54(3): 299-314.
Dahiya, PS. Saraswat, SP. and Sharma, A. 1999. Participation of women vis-à-vis men in labour force in farm and non
farm sector in Himachal Pradesh. Indian J Agricultural
Economics.54(3): 325-326.
and Decision making by Rural Women - an economic
study in Karnataka. Indian J Agricultural Economics.54(3)
: 305-308.
Kaur, S. 1991. Plight of Women Agricultural Labourers.
Kurukshetra. 21(9): p13-16.
Meenakshi, JV. 1999. Rapporteur’s report on women in
agriculture and rural economy. Indian J Agricultural
Economics. 54(3): 442-446.
Rao, E. Krishna, Role of Women in Agriculture: A Micro Level Study.; 2006
Roy, U. Status of Rural Women. A M. Sc. (Home Science) Thesis, Assam Agricultural University, Jorhat, Assam, India ; 1999
of natura sources: A case study from Kenya. Indian J
Agricultural Economics. 54 (3): 308-312.
Singh, Roopam and Sengupta, Ranja, 2009. EU FTA and the Likely Impact on Indian Women Executive Summary. Centre for Trade and Development and Heinrich Boell
Foundation.
Subrahmanyam, S. 1999. Female labour absorption in Andhra
Pradesh Agriculture. Indian J Agricultural Economics. 54(3):
272-281.
Tripathi, RS. 1999. Role of women in Hill economy of Uttar Pradesh and their participation in decision making
process. Indian J Agricultural Economics. 54(3): 303-304.