Volume 15 Number 3 pp. 384–392 C The Authors 2012 doi:10.1017/thg.2012.6
Individual Differences in EEG Spectral Power
Reflect Genetic Variance in Gray and White
Matter Volumes
Dirk J. A. Smit,1,2Dorret I. Boomsma,1,2,3Hugo G. Schnack,4Hilleke E. Hulshoff Pol,4
and Eco J. C. de Geus1,2,3
1Biological Psychology, VU University, van der Boechorststraat 1, 1081 BT, Amsterdam, The Netherlands.
2Neuroscience Campus Amsterdam, VU University, De Boelelaan 1085, 1081 HV, Amsterdam, The Netherlands.
3EMGO+Institute, VU Medical Centre, Van der Boechorststraat 7, 1081 BT Amsterdam, The Netherlands
4Department of Psychiatry, University Medical Center Utrecht, P.O. Box 85500, 3508 GA, Utrecht, The Netherlands
The human electroencephalogram (EEG) consists of oscillations that reflect the summation of postsynaptic potentials at the dendritic tree of cortical neurons. The strength of the oscillations (EEG power) is a highly genetic trait that has been related to individual differences in many phenotypes, including intelligence and liability for psychopathology. Here, we investigated whether brain anatomy underlies these EEG power differences by correlating it to gray and white matter volumes (GMV, WMV), and additionally investigated whether this association can be attributed to genes or environmental factors. EEG was measured in a sample of 405 young adult twins and their siblings, and power in the theta (∼4 Hz), alpha (∼10 Hz), and beta (∼20 Hz) frequency bands determined. A subset of 121 subjects were also scanned in a 1.5 T MRI scanner, and gray and white matter volumes defined as the total of cortical and subcortical volumes, excluding cerebellum. Both MRI-based volumes and EEG power spectra were highly heritable. GMV and WMV correlated .25 to .29 with EEG power for the slower oscillations (theta, alpha). Moreover, these phenotypic correlations largely reflected genetic covariation, irrespective of oscillation frequency and volume type. Genetic correlations (.31<rA <.43) revealed that only moderate proportions of the heritable variance overlapped between MRI volumes and EEG power. The results suggest that MRI volumes and EEG power share genetic sources of variation, which may reflect such processes as myelination, synaptic density, and dendritic outgrowth.
Keywords:Gray matter volume, white matter volume, electroencephalography, endophenotype, MRI, development
Electroencephalograpic (EEG) recordings of electrical brain activity during rest and task conditions have been a prime target to serve as endophenotypes of brain function, cog-nition, and brain disorder. EEG consists of oscillations that reflect the summation of postsynaptic potentials at the den-dritic tree of cortical neurons. These constituent oscilla-tions include alpha oscillaoscilla-tions of about 10 Hz that reflect the inactivity of the cortical area producing the rhythm (Niedermeyer, 1999a). Theta rhythms of 4 Hz to about 6 Hz, represent working memory processing in adults (Gevins et al., 1997), but may reflect the relative immaturity of the brain (Niedermeyer, 1999b; Smit et al., 2011) or drowsiness (Niedermeyer, 1999c). Beta oscillations of about 15 to 25 Hz reflect active processing or movement-related oscilla-tions (Niedermeyer, 1999c).
A large body of research has linked EEG parameters to cognitive ability (Anokhin & Vogel, 1996; Jauˇsovec & Jauˇsovec, 2000; Onton et al., 2005; Tesche & Karhu, 2000; Thatcher et al., 2008) and various psychopathologies in-cluding ADHD, depression, alcoholism, and autism (Barry et al., 2003; Cameron et al., 2003; Kemner et al., 1999; Linkenkaer-Hansen et al., 2005; Porjesz & Begleiter, 2003). Many EEG parameters are influenced by genetic factors. For example, the strength of EEG oscillation (EEG power),
RECEIVED2 November 2011;ACCEPTED22 November 2011.
connectivity between brain areas (measured with EEG co-herence or synchronization likelihood), and more complex measures (network efficiency, dynamical signal complex-ity, and the decay in autocorrelation) all show moderate to high heritability (Almasy et al., 1999; Anokhin et al., 2001; Posthuma et al., 2005; Smit et al., 2005, 2008, 2010; van Baal et al., 1996; van Beijsterveldt et al., 1996, 1998a, b; Zietsch et al., 2007). As such, these EEG-derived parameters fulfill two important criteria of the endophenotype concept (de Geus, 2002): they are related to the (heritable) phenotype, and they are heritable traits.
Increased use of structural and functional magnetic res-onance imaging (MRI) scans in cognitive and clinical neu-roscience also has produced a large body of evidence link-ing MRI volumetric measures to brain function, cognition, and brain disorder. As with the EEG parameters, MRI vol-umetric brain measures tend to be highly heritable, both in childhood and later in life. This is seen for whole-brain measures of cerebral gray and white matter volumes (GMV and WMV), cortical thickness, and volumes of subcortical structures such as hippocampal volume (Hulshoff Pol et al., 2006; Peper et al., 2007; Posthuma et al., 2002, 2003; van Leeuwen et al., 2009).
Variation in both EEG power and MRI volumes has of-ten been related to the same phenotypes. For example, EEG power and MRI volumes show correlations with cogni-tive performance across normal and patient subject groups. Both WMV and GMV show correlations with intelligence ranging from .25 to .40 (Luders et al., 2009; Posthuma et al., 2002). EEG power of various frequencies has also been found to be significantly correlated with IQ in several stud-ies, including 10 Hz alpha (Thatcher et al., 2005) and 6 Hz theta in elderly subjects (Finnigan et al., 2011), albeit with slightly smaller effect sizes (aboutr=0.20). Schizophrenia may serve as another example. Here, a triad of effects has been reported between gray matter changes, IQ deteriora-tion, and ∼10 Hz alpha power reduction (Leeson et al., 2011; Sponheim et al., 1994; Sun et al., 2009). In sum, for many phenotypes that have correlations with brain volume, correlations with EEG power have also been reported.
In sum, MRI volumes and EEG-derived parameters show substantial overlap in their relation with brain function, cognition, and brain disorder. This overlap in the individ-ual differences in EEG and MRI may perhaps be explained by the same neurodevelopmental processes, notably includ-ing myelination and synaptic formation and pruninclud-ing (Casey et al., 2005; Huttenlocher, 1979; Huttenlocher & Dabholkar, 1997; Lenroot & Giedd, 2006; Paus, 2010). If so, they would be expected to share a common etiology, including genetic and environmental determinants. Here we will focus on the relation between EEG power and MRI volumes. Whitford et al. (2007) showed that EEG power and MRI volumes are indeed correlated (in the ranger=.24 tor=.30 for alpha oscillations). We aim to replicate these findings in a sam-ple of healthy adults and test for significance of phenotypic
correlations between EEG power and MRI volumes. Next, we aim to make use of the extended twin design of monozy-gotic (MZ) and dizymonozy-gotic (DZ) twins (and their siblings) to investigate through multivariate genetic modeling whether MRI volumes and EEG indeed share part of their genetic and environmental determinants.
Methods
SubjectsSubjects were recruited from The Netherlands Twin Reg-istry as part of projects on the genetics of cognition and adult brain functions. Adult twins and their non-twin sib-lings were asked to participate in a testing protocol last-ing 4.5 hours. In total, 405 twins and sibllast-ings (213 female; 192 male) from 160 twin families participated in the study. The sample consisted of a young adult age cohort (M=
26.2 years,SD=4.1). The sample included 61 MZ and 77 DZ complete twin pairs, and 114 siblings. Of these, 121 sub-jects (average age 27.4 years) also took part in an MRI study (48 male, 73 female; 20 complete MZ pairs, 23 complete DZ twin pairs, and 25 siblings).
EEG Acquisition and Analysis
A detailed description of EEG acquisition can be found else-where (Smit et al., 2005). In short, we obtained 3-minute eyes closed background EEG on 19 scalp positions (F7, F3, F1, Fz, F2, F4, F8, T7, C3, Cz, C4, T8, P7, P3, Pz, P4, P8, O1, and O2) using Ag/AgCl electrodes mounted in an electro-cap. Vertical and horizontal eye movement was measured using bipolar derivations. The EEG was amplified, digitized at 250 Hz, and stored for offline processing.
All EEG signals were re-referenced to average earlobes. After visual inspection, Independent Components Analysis was performed and components reflecting eye movements removed. A minimum of 100 s of data was required. Power was calculated using Thomson’s multitaper method as im-plemented in MATLAB. Finally, the resulting power values were 10×log10transformed averaged into the theta (3.0–5.4 Hz), alpha (6.0–13.0 Hz) and beta (15.0–25.0 Hz) frequency bins.
Structural MRI Assessment
pow gmv wmv pow gmv wmv
2 r e b m e m y li m a F 1
r e b m e m y li m a F
FIGURE 1
Trivariate saturated model used in the statistical analysis of EEG power (pow), gray matter volume (gmv), and white matter volume (wmv). The model estimates phenotypic correlations (black arrows), twin correlations (gray arrows), and cross-twin-cross-trait correlations (CTCT; dashed gray arrows). Family members can be mono zygous (MZ) twins, dizygous (DZ) twins, or twin-sibling pairs with separate CTCT and twin correlations. Correlations between DZ twin pairs and twin-sibling pairs were fixed to be equal. All models used age-fixed and sex-fixed effects on the means. Separate analyses were performed for EEG oscillation power in the three frequency bands and are listed as Model 1 in Table 4.
A1 A2 A3
E1 E2 E3
pow gmv wmv
e11
e21
e31
e22 e33
e32
a11 a21
a31
a22
a33
a32
A1 A2 A3
E1 E2 E3
pow gmv wmv
e11
e21
e31
e22 e33
e32
a11 a21
a31
a22
a33
a32 2 r e b m e m y li m a F 1
r e b m e m y li m a F
MZ: 1 ; DZ/sibling: .5
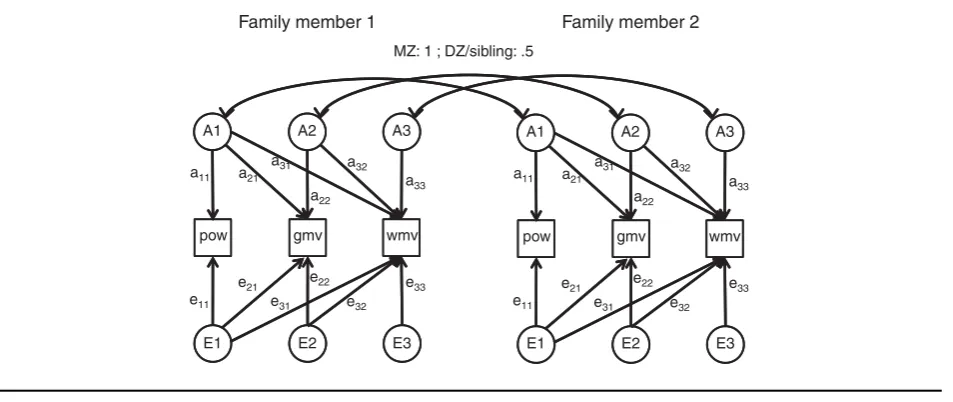
FIGURE 2
Trivariate path model used in the statistical analysis of EEG power (pow), gray matter volume (gmv), and white matter volume (wmv). Family members can be monozygous (MZ) twins, dizygous (DZ) twins, or twin sibling pairs. The path model describes the relation between pairs of family members, but can easily be expanded to include>2 family members. Additive genetic factors (A) are correlated 1 between MZ twins, 0.5 between DZ twins and siblings, and 0 between unrelated subjects. Unique environmental factors (E) are uncorrelated across family members, but may still mediate phenotypic correlation between the variables. Separate analyses were performed for EEG oscillation power in the three frequency bands and are listed as Model 5 in Table 4. Model 10 in Table 4 (theta and alpha oscillations) is the same model with path loadings e21 and e31 removed. Model 10 (beta oscillations) has path loadings e21, e31, a21, and a31 removed.
Statistical Methods
Phenotypic correlations between MRI volumes and EEG power, and correlations between MZ and DZ/Sib pairs for all traits, as well as cross-twin-cross-trait correlations among MRI and EEG traits, were estimated in a so-called saturated model in trivariate models with EEG power, GMV, and WMV, which specifies correlations among rel-atives, but does not put any constraints on the correla-tional structure. In addition, variances are freely estimated for each variable. Previous results had suggested no sex differences in correlation structure for EEG power (Smit et al., 2005; Zietsch et al., 2007) or for MRI volumes
(Baar´e, 2001), and we therefore did not model this effect. Note, however, that all models include sex and age as lin-ear fixed effects (covariates). Figure 1 shows the saturated model.
TABLE 1
Heritabilities and Twin Correlations of EEG Power and MRI Volumes
Variable h2 r
MZ rDZ
EEG power
theta 0.76 [0.66, 0.84] 0.77 [0.67, 0.84] 0.35 [0.21, 0.48]
alpha 0.93 [0.89, 0.95] 0.93 [0.89, 0.95] 0.51 [0.38, 0.61]
beta 0.85 [0.78, 0.89] 0.85 [0.77, 0.90] 0.56 [0.45, 0.66]
GMV 0.73 [0.56, 0.84] 0.71 [0.49, 0.84] 0.36 [0.09, 0.59]
WMV 0.90 [0.77, 0.95] 0.89 [0.76, 0.94] 0.27 [0.00, 0.51]
Note: GMV=gray matter volume, WMV=white matter volume; values in
brackets are 95% Confidence Intervals; EEG power from oscillations in the theta (3.0–5.6 Hz), alpha (6.0–13.0 Hz) and beta (15.0–25.0 Hz); heritability from multivariate AE models; twin correlations from saturated models.
(A) factors can explain resemblance among family mem-bers; they correlate 1 between MZ twins and, on average, .5 between DZ twins and siblings. Unique environmental factors (E) cause differences between family members, in-cluding between MZ twins. The effect of these latent factors on the observed, univariate, or multivariate phenotypes can be estimated by genetic structural equation modeling. Figure 2 shows the path model used. Data were analyzed in a series of trivariate models including GMV, WMV, and EEG power (separate models for the alpha, beta, and theta fre-quency bands). The model included three latent A and three latent E factors; the first A and E factors influence all 3 traits, the second A and E factors influence only 2 traits and the last A and E factor only influences one trait. Through this parameterization, the phenotypic covariance matrix is de-composed into a genetic and an environmental part (P= A+E). Standardization of each of these matrices pro-vides phenotypic, genetic, and environmental correlations among traits. Note that the correlations do not necessar-ily add up (rP=rA +rE) due to each covariance being standardized to different variances.
Statistical modeling was done in Mx version 1.54 (Neale et al., 2003). Mx computes the likelihood of a model based on the observed and expected (modeled) covariance ma-trixes, then maximizes the likelihood by stepwise changing of the model parameters. After fitting parameters for the full saturated model, we applied constraints; for example, by constraining the values of parameters to each other or by dropping them to zero. This results in a nested sub-model with a different likelihood. Twice the difference in likelihood between the full model and a nested sub-model with re-stricted number of parameters is asymptotically chi-square distributed, with the number of constrained parameters as degrees of freedom. If the test is significant, this indicates that the parameter significantly contributes to the model and needs to be retained.
Specifically, after fitting the saturated model we tested for the significance of the phenotypic correlation by setting it to zero. If significant, we tested whether the AE model provided a nonsignificant deterioration of model fit. In this model we tested whether the correlation between GMV and EEG
TABLE 2
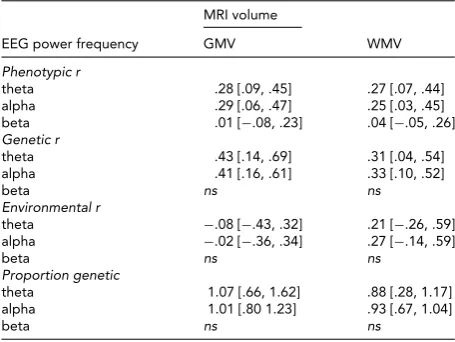
Phenotypic Correlations Between EEG Power and MRI Volumes
MRI volume
EEG power frequency GMV WMV
Phenotypic r
theta .28 [.09, .45] .27 [.07, .44]
alpha .29 [.06, .47] .25 [.03, .45]
beta .01 [−.08, .23] .04 [−.05, .26]
Genetic r
theta .43 [.14, .69] .31 [.04, .54]
alpha .41 [.16, .61] .33 [.10, .52]
beta ns ns
Environmental r
theta −.08 [−.43, .32] .21 [−.26, .59]
alpha −.02 [−.36, .34] .27 [−.14, .59]
beta ns ns
Proportion genetic
theta 1.07 [.66, 1.62] .88 [.28, 1.17]
alpha 1.01 [.80 1.23] .93 [.67, 1.04]
beta ns ns
Note: GMV=gray matter volume, WMV=white matter volume; values in
brackets are 95% Confidence Intervals; EEG power in theta (3.0–5.6 Hz), alpha (6.0–13.0 Hz) and beta (15.0–25.0 Hz) frequency bands.
Correlations were estimated in the saturated model. Genetic r
represents the correlation between additive genetic factors and, thus, the proportion of heritable variance shared between the two
phenotypes; Environmental r represents the correlation between
the environmental factors and, thus, the proportion shared
environ-mental variance between the two phenotypes;Proportion genetic
represents the proportion of the phenotypic correlation that can be
attributed to genes; values>1 indicate opposite sign in
environmen-tal and genetic correlations.ns=no significant phenotypic correlation.
power was mediated by genetic or environmental factors by dropping path loadings e21 and a21 respectively (see Figure 2). Similarly, the etiology of the relation between WMV and EEG power was tested by dropping e31 and a31. Nonsignificant path loadings were removed. Finally, we tested the significance of the genetic effects on each of the variables EEG power, GMV, and WMV by dropping all path loadings from the variables to A.
Results
TABLE 3
Cross-Twin-Cross-Trait Twin Correlations Between EEG Power and MRI Volumes
GMV WMV
EEG power frequency CTCTMZ CTCTDZ CTCTMZ CTCTDZ
theta .28 [.07, .47] .15 [−.04, .33] .25 [.04, .44] .00 [−.20, .19]
alpha .29 [.06, .48] .05 [−.17, .27] .23 [.01, .43] −.06 [−.28, .17]
beta .01 [−.19, .24] −.09 [−.25, .05] .05 [.00, .26] −.12 [−.30, .11]
Note: GMV=gray matter volume, WMV=white matter volume, CTCT=cross-twin-cross-trait twin correlations, MZ=monozygous, DZ=dizygous; values
in brackets are 95% Confidence Intervals; EEG power from oscillations in the theta (3.0–5.6 Hz), alpha (6.0–13.0 Hz) and beta (15.0–25.0 Hz); estimated in the saturated model.
TABLE 4
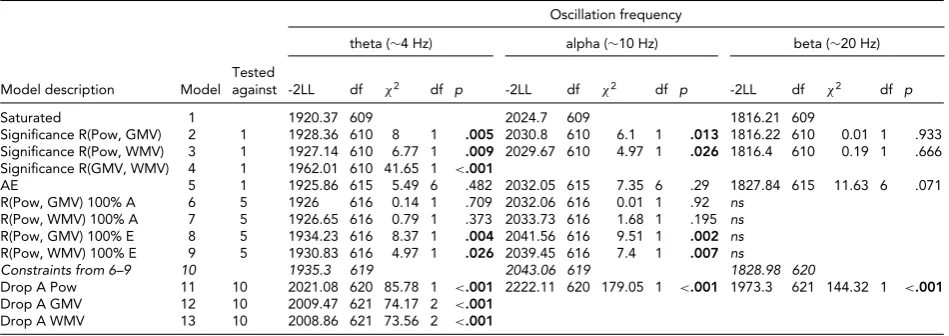
Multivariate Model Fit Between EEG Power and MRI Volumes
Oscillation frequency
theta (∼4 Hz) alpha (∼10 Hz) beta (∼20 Hz)
Tested
Model description Model against -2LL df χ2 df p -2LL df χ2 df p -2LL df χ2 df p
Saturated 1 1920.37 609 2024.7 609 1816.21 609
Significance R(Pow, GMV) 2 1 1928.36 610 8 1 .005 2030.8 610 6.1 1 .013 1816.22 610 0.01 1 .933
Significance R(Pow, WMV) 3 1 1927.14 610 6.77 1 .009 2029.67 610 4.97 1 .026 1816.4 610 0.19 1 .666
Significance R(GMV, WMV) 4 1 1962.01 610 41.65 1 <.001
AE 5 1 1925.86 615 5.49 6 .482 2032.05 615 7.35 6 .29 1827.84 615 11.63 6 .071
R(Pow, GMV) 100% A 6 5 1926 616 0.14 1 .709 2032.06 616 0.01 1 .92 ns
R(Pow, WMV) 100% A 7 5 1926.65 616 0.79 1 .373 2033.73 616 1.68 1 .195 ns
R(Pow, GMV) 100% E 8 5 1934.23 616 8.37 1 .004 2041.56 616 9.51 1 .002 ns
R(Pow, WMV) 100% E 9 5 1930.83 616 4.97 1 .026 2039.45 616 7.4 1 .007 ns
Constraints from 6–9 10 1935.3 619 2043.06 619 1828.98 620
Drop A Pow 11 10 2021.08 620 85.78 1 <.001 2222.11 620 179.05 1 <.001 1973.3 621 144.32 1 <.001
Drop A GMV 12 10 2009.47 621 74.17 2 <.001
Drop A WMV 13 10 2008.86 621 73.56 2 <.001
Note: Pow=EEG power, GMV=cerebral grey matter volume, WMV=cerebral white matter volume; EEG power from oscillations in the theta (3.0–5.6 Hz),
alpha (6.0–13.0 Hz) and beta (15.0–25.0 Hz); model fit from a trivariateSEM model with sex and age as covariates on all variables. Model 5 is the AE
model (Figure 2) and is equivalent to a saturated model with allrDZand CTCTDZconstrained to .5 times their MZ counterparts, and therefore nested in
the saturated model.
Table 4 shows the results from the formal testing of these correlations for each of the frequency bands. For both al-pha and theta oscillations, the phenotypic correlations were significant for both WMV and GMV,χ2(1)>4.97, p< .05. Next, we observed that the saturated model could be constrained to an AE model,χ2(6)<11.6,p>.05. Note that this model is equivalent to constraining all DZ cor-relations (including DZ cross-twin cross-trait correlation) to half the MZ equivalent, and is therefore nested in the saturated model. This test provides further evidence that non-additive genetic effects and effects of common envi-ronment are absent for both EEG power and MRI volumes. Next, we tested the source of the phenotypic correlations in the AE model. Path loadings e21 and e31 could both be dropped,χ2(1)<1.59, but not path loadings a21 and a31,χ2(1)>4.97,p<.05. Thus, for alpha and theta band EEG power, the phenotypic correlations with GMV and WMV were entirely explained by additive genetic factors. The heritabilities for power and MRI volumes were highly significant and are shown in Table 1.
Table 5 shows the effects of the covariates on the mean. The effect of sex on MRI volumes was quite large and highly significant, whereas the effect of age was much weaker — al-though a significant yearly decrease was found for GMV (see
e.g., Walhovd et al., 2005). EEG power showed well-known effects of higher power in females and a strong decrease in theta power (Smit et al., 2011).
Discussion
We have shown that the power of EEG alpha and theta oscil-lations was significantly correlated with MRI-derived WM and GM volumes in a sample of young adult subjects. We therefore fully replicated the results reported by Whitford et al. (2007), who found similar correlations (.24<r<.30 for alpha oscillations, .21<r<.36 for combined delta-theta oscillations). In addition, we have shown for the first time that these correlations are entirely genetically mediated.
TABLE 5
Means and Effects of Covariates
Variable M bage bsex
EEG power
alpha (dB) 4.1 −.04 −.68∗
beta (dB) −4.8 −.01 −.84∗∗∗
theta (dB) 3.5 −.13∗∗∗ −.65∗∗
MRI volumes
GMV (ml) 653.1 −2.8∗ 56.7∗∗∗
WMV (ml) 461.2 2.0 77.8∗∗∗
Note: Age covariate as increase in dB per year (EEG power) or ml per year (MRI volumes); sex covariate coded as males relative to females;
GMV=cerebral grey matter volume, WMV=cerebral white matter
volume.
∗p<.05,∗∗p<.01,∗∗∗p<.001.
EEG power reflected only a subset of the genes causing variation in MRI volumes. This is consistent with the view that MRI volumes reflect multiple processes — pruning and dendritic outgrowth, and increased axonal myelina-tion causing increases in WMV and decreases in GMV (e.g., Casey et al., 2004; Lenroot & Giedd, 2006). EEG power, on the other hand, is likely to reflect more directly the postsy-naptic potentials of the apical dendrites of cortical pyrami-dal cells, and to reflect the synaptic density and the tendency of the thalamo-cortical loops to oscillate. Nevertheless, EEG power and MRI volumes pick up shared genetic factors that influence individual differences in two — at first sight — rather diverse brain measures.
What is the nature of these genetic factors and how do they cause the association between EEG power and MRI vol-umes? Formally, three explanations exist, which may also co-occur. First, the shared genetic factor observed in this study may cause variation in the volumetric measures, in turn causing variance in the EEG power spectrum. For ex-ample, there may be GMW-related alterations in conductive properties of the neural tissue, and WMV could be related to EEG power as the result of increased effectiveness in cortico-cortical and thalamo-cortico-cortical connectivity, both important aspects in oscillation generation (Steriade, 1999). Second, the correlated activity reflected in EEG power could actu-ally cause volumes to increase because increased activity may cause extended dendritic branching (Peng et al., 2009; Sin et al., 2002; Yu & Malenka, 2003). Third, both EEG power and MRI volumes may show individual differences as a result of underlying differences in neurohistological variables such as dendritic arborization, expansion, synap-tic density, and myelination. A possible design to tackle the core question of causality is the longitudinal assessment of both types of parameters in large twin samples (De Moor et al., 2008).
Although EEG power reflected only part of the (genetic) variation in MRI volumes, other — and perhaps more com-plex — derivations of the EEG signal than EEG power may provide additional explanatory power. Such variables have often been shown to be heritable, including dynamic
com-plexity (Anokhin et al., 1999), connectivity (van Baal et al., 2001; Posthuma et al., 2005; Smit et al., 2010), decay in tem-poral autocorrelations (Linkenkaer-Hansen et al., 2007), and graph theoretical analysis of the brain network (Smit et al., 2010; Smit et al., in press). It was also observed that these measures are, to at least some degree, not correlated with EEG power. For example, the power-law decay in auto-correlations is largely unrelated to EEG power (Linkenkaer-Hansen, 2007). Also, connectivity was, to some degree, ge-netically uncorrelated with EEG power (Smit et al., 2010).
MRI volumes, and especially GMV, have well-documented changes in psychopathological states such as ADHD (Casey et al., 1997; Castellanos et al., 2002; Durston et al., 2004; Rubia et al., 1999) and schizophrenia (Chua et al., 2007; Gur, Cowell, et al., 2000; Gur, Turetsky, et al., 2000; Honea et al., 2005; Hulshoff Pol et al., 2001; Wright et al., 2000). The current results suggest that EEG could serve as an endophenotype for the structural brain changes characterizing these disease states. Its usefulness may ben-efit from source localization of EEG activity to the implied cortical structures (Wright et al., 2000), compared to the whole-brain approach used in the current study. Future in-vestigations may reveal whether these brain-projected EEG power values predict — as one would expect — cortical volumes of the same brain areas.
In sum, these results show that simple, inexpensive, and widely available EEG recordings reflect genetic structural brain parameters. Studies that require large numbers of ob-servations — such as genome-wide studies — may benefit from the more widespread availability of EEG apparatus when exploring the genetics of structural brain parameters. Replication of loci with significant genome-wide associa-tion could include cohorts with resting EEG power data. Rather than focusing on complex compound measures, fo-cusing on the covariation between EEG power and MRI vol-umes may isolate specific processes such as synaptic density that underlie both traits.
Acknowledgments
This research was funded by VU University VU-USF 96/22 to D.B., the Human Frontiers of Science Program (HFSP) RG0154/1998-B to D.B. and E.d.G., and The Netherlands Science Foundation NWO/MagW VENI-451-08-026 to D.S.
References
Almasy, L., Porjesz, B., Blangero, J., Chorlian, D., O’Connor, S., Kuperman, S., Rohrbaugh, J., Bauer, L. O., Reich, T., Polich, J., & Begleiter, H. (1999). Heritability of event-related brain potentials in families with a history of alcoholism.American Journal of Medical Genetics: Neuropsychiatric Genetics, 88, 383–390.
between the P300 event-related brain potential and the EEG power spectrum.Behavior Genetics, 31, 545–554.
Anokhin, A., & Vogel, F. (1996). EEG Alpha rhythm frequency and intelligence in normal adults.Intelligence, 23, 1–14. Anokhin, A. P., Lutzenberger, W., & Birbaumer, N. (1999).
Spatiotemporal organization of brain dynamics and intel-ligence: An EEG study in adolescents.International Journal of Psychophysiology, 33, 259–273.
Baar´e, W. F. C., Hulshoff Pol, H. E., Boomsma, D. I., Posthuma, D., De Geus, E. J. C., Schnack, H. G., van Haren, N. E. M., van Oel, C. J., & Kahn, R. S. (2001). Quantitative genetic modeling of variation in human brain morphology. Cere-bral Cortex, 11, 816–824.
Barry, R. J., Johnstone, S. J., & Clarke, A. R. (2003). A review of electrophysiology in attention-deficit/hyperactivity dis-order: II. Event-related potentials.Clinical Neurophysiology, 114, 184–198.
Cameron, A. M., Geffen, G. M., Kavanagh, D. J., Wright, M. J., McGrath, J. J., & Geffen, L. B. (2003). Event-related poten-tial correlates of impaired visuospapoten-tial working memory in schizophrenia.Psychophysiology, 40, 702–715.
Casey, B., Tottenham, N., Liston, C., & Durston, S. (2005). Imaging the developing brain: What have we learned about cognitive development?Trends in Cognitive Sciences, 9, 104– 110.
Casey, B. J., Trainor, R. J., Orendi, J. L., Schubert, A. B., Nys-trom, L. E., Giedd, J. N., Castellanos, F. X., Haxby, J. V., Noll, D. C., Cohen, J. D., Forman, S. D., Dahl, R. E., & Rapoport, J. L. (1997). A developmental functional MRI study of pre-frontal activation during performance of a go-no-go task.
Journal of Cognitive Neuroscience, 9, 835–847.
Castellanos, F. X., Lee, P. P., Sharp, W., Jeffries, N. O., Green-stein, D. K., Clasen, L. S., Blumenthal, J. D., James, R. S., Ebens, C. L., Walter, J. M., Zijdenbos, A., Evans, A. C., Giedd, J. N., & Rapoport, J. L. (2002). Developmental tra-jectories of brain volume abnormalities in children and adolescents with attention-deficit/hyperactivity disorder.
JAMA: the Journal of the American Medical Association, 288, 1740.
Chua, S. E., Cheung, C., Cheung, V., Tsang, J. T. K., Chen, E. Y. H., Wong, J. C. H., Cheung, J. P. Y., Yip, L., Tai, K. S., Suckling, J., & McAlonan, G. M. (2007). Cerebral grey, white matter and CSF in never-medicated, first-episode schizophrenia.Schizophrenia Research, 89, 12–21.
de Geus, E. J. C. (2002). Introducing genetic psychophysiology.
Biological Psychology, 61, 1–10.
De Moor, M. H. M., Boomsma, D. I., Stubbe, J. H., Willemsen, G., & de Geus, E. J. C. (2008). Testing causality in the asso-ciation between regular exercise and symptoms of anxiety and depression.Archives of General Psychiatry, 65, 897. Durston, S., Pol, H. E. H., Schnack, H. G., Buitelaar, J. K.,
Steenhuis, M. P., Minderaa, R. B., & Kahn, R. S. (2004). Magnetic resonance imaging of boys with attention-deficit/hyperactivity disorder and their unaffected siblings.
Journal of the American Academy of Child & Adolescent Psy-chiatry, 43, 332–340.
Finnigan, S., Robertson, I. H., Finnigan, S., & Robertson, I. H. (2011). Resting EEG theta power correlates with cognitive
performance in healthy older adults.Psychophysiology, 48, 1083–1087.
Gevins, A., Smith, M.E., McEvoy, L., & Yu, D. (1997). High-resolution EEG mapping of cortical activation related to working memory: Effects of task difficulty, type of process-ing, and practice.Cerebral Cortex, 7, 374–385.
Gur, R. E., Cowell, P. E., Latshaw, A., Turetsky, B. I., Grossman, R. I., Arnold, S. E., Bilker, W. B., & Gur, W. C. (2000). Reduced dorsal and orbital prefrontal gray matter volumes in schizophrenia.Archives of General Psychiatry, 57, 761. Gur, R. E., Turetsky, B. I., Cowell, P. E., Finkelman, C., Maany,
V., Grossman, R. I., Arnold, S. E., Bilker, W. B., & Gur, R. C. (2000). Temporolimbic volume reductions in schizophre-nia.Archives of General Psychiatry, 57, 769.
Honea, R., Crow, T. J., Passingham, D., & Mackay, C. E. (2005). Regional deficits in brain volume in schizophre-nia: A meta-analysis of voxel-based morphometry studies.
American Journal of Psychiatry, 162, 2233.
Hulshoff Pol, H. E., Schnack, H. G., Mandl, R. C. W., van Haren, N. E. M., Koning, H., Collins, D. L., Evans, A. C., & Kahn, R. S. (2001). Focal gray matter density changes in schizophrenia.Archives of General Psychiatry, 58, 1118. Hulshoff Pol, H. E., Schnack, H. G., Posthuma, D., Mandl, R. C.
W., Baar´e, W. F., van Oel, C., van Haren, N. E., Collins, D. L., Evans, A. C., Amunts, K., B¨urgel, U., Zilles, K., de Geus, E., Boomsma, D. I., & Kahn, R. S. (2006). Genetic contributions to human brain morphology and intelligence.The Journal of Neuroscience, 26, 10235.
Huttenlocher, P. R. (1979). Synaptic density in human frontal cortex — developmental changes and effects of aging.Brain Research, 163, 195–205.
Huttenlocher, P. R., & Dabholkar, A. S. (1997). Regional dif-ferences in synaptogenesis in human cerebral cortex.The Journal of Comparative Neurology, 387, 167–178.
Jauˇsovec, N., & Jauˇsovec, K. (2000). Differences in resting EEG related to ability.Brain Topography, 12, 229–240.
Kemner, C., van der Gaag, R. J., Verbaten, M., & van Engeland, H. (1999). ERP differences among subtypes of pervasive developmental disorders.Biological Psychiatry, 46, 781–789. Leeson, V. C., Sharma, P., Harrison, M., Ron, M. A., Barnes, T. R. E., & Joyce, E. M. (2011). IQ trajectory, cognitive reserve, and clinical outcome following a first episode of psychosis: A 3-year longitudinal study.Schizophrenia Bul-letin, 37, 768.
Lenroot, R. K., & Giedd, J. N. (2006). Brain development in children and adolescents: Insights from anatomical mag-netic resonance imaging.Neuroscience & Biobehavioral Re-views, 30, 718–729.
Linkenkaer-Hansen, K., Monto, S., Ryts¨al¨a, H., Suominen, K., Isomets¨a, E., & K¨ahk¨onen, S. (2005). Breakdown of long-range temporal correlations in theta oscillations in patients with major depressive disorder.The Journal of Neuroscience, 25, 10131–10137.
Linkenkaer-Hansen, K., Smit, D. J. A., Barkil, A., van Bei-jsterveldt, T. E. M., Brussaard, A. B., Boomsma, D. I., van Ooyen, A., & de Geus, E. J. C. (2007). Genetic contributions to long-range temporal correlations in ongoing oscillations.
Luders, E., Narr, K. L., Thompson, P. M., & Toga, A. W. (2009). Neuroanatomical correlates of intelligence.Intelligence, 37, 156–163.
Neale, M. C., Boker, S. M., Xie, G., & Maes, H. H. (2003).
Mx: Statistical modeling (6th ed.). Richmond, VA: VCU, Department of Psychiatry.
Niedermeyer, E. (1999a). The normal EEG of the waking adult. In E. Niedermeyer & F. Lopes da Silva (Eds.), Elec-troencephalography: Basic principles, clinical applications, and related fields(pp. 149–173). Philadelphia: Lippincott, Williams & Wilkins.
Niedermeyer, E. (1999b). Maturation of the EEG: Develop-ment of waking and sleep patterns. In E. Niedermeyer & F. Lopes da Silva (Eds.),Electroencephalography: Basic prin-ciples, clinical applications, and related fields(pp. 189–214). Philadelphia: Lippincott, Williams & Wilkins.
Niedermeyer, E. (1999c). Sleep and EEG. In E. Niedermeyer & F. Lopes da Silva (Eds.),Electroencephalography: Basic principles, clinical applications, and related fields(pp. 174– 188). Philadelphia: Lippincott, Williams & Wilkins. Onton, J., Delorme, A., & Makeig, S. (2005). Frontal midline
EEG dynamics during working memory.Neuroimage, 27, 341–356.
Paus, T. (2010). Growth of white matter in the adolescent brain: Myelin or axon?Brain and Cognition, 72, 26–35.
Peng, Y. R., He, S., Marie, H., Zeng, S. Y., Ma, J., Tan, Z. J., Lee, S. Y., Malenka, R. C., & Yu, X. (2009). Coordinated changes in dendritic arborization and synaptic strength during neural circuit development.Neuron, 61, 71–84.
Peper, J. S., Brouwer, R. M., Boomsma, D. I., Kahn, R. S., & Hulshoff Pol, H. E. (2007). Genetic influences on human brain structure: A review of brain imaging studies in twins.
Human Brain Mapping, 28, 464–473.
Posthuma, D., Baar´e, W. F. C., Hulshoff Pol, H. E., Kahn, R. S., Boomsma, D. I., & De Geus, E. J. C. (2003). Genetic correlations between brain volumes and the WAIS-III di-mensions of verbal comprehension, working memory, per-ceptual organization, and processing speed.Twin Research and Human Genetics, 6, 131–139.
Posthuma, D., De Geus, E. J. C., Baar´e, W. F. C., Hulshoff Pol, H. E., Kahn, R. S., & Boomsma, D. I. (2002). The association between brain volume and intelligence is of genetic origin.
Nature Neuroscience, 5, 83–84.
Posthuma, D., De Geus, E. J. C., Mulder, E. J. C. M., Smit, D. J. A., Boomsma, D. I., & Stam, C. J. (2005). Genetic components of functional connectivity in the brain: The heritability of synchronization likelihood. Human Brain Mapping, 26, 191–198.
Rubia, K., Overmeyer, S., Taylor, E., Brammer, M., Williams, S. C. R., Simmons, A., & Bullmore, E. T. (1999). Hypofrontality in attention deficit hyperactivity disor-der during higher-ordisor-der motor control: A study with functional MRI. American Journal of Psychiatry, 156, 891.
Schnack, H., Hulshoff Pol, H., Baar´e, W. F. C., Viergever, M., & Kahn, R. (2001). Automatic segmentation of the ventricular system from MR images of the human brain.NeuroImage, 14, 95–104.
Sin, W. C., Haas, K., Ruthazer, E. S., & Cline, H. T. (2002). Den-drite growth increased by visual activity requires NMDA receptor and Rho GTPases.Nature, 419, 475–480. Sled, J. G., Zijdenbos, A. P., & Evans, A. C. (1998). A
non-parametric method for automatic correction of intensity nonuniformity in MRI data.Medical Imaging, IEEE Trans-actions, 17, 87–97.
Smit, D. J. A., Boersma, M., van Beijsterveldt, C. E. M., Posthuma, D., Boomsma, D. I., Stam, C. J., & de Geus, E. J. C. (2010). Endophenotypes in a dynamically connected brain.Behavior Genetics, 40, 167–177.
Smit, D. J. A., Boersma, M., Schnack, H.G., Micheloyannis, S., Boomsma, D. I., Hulshoff Pol, H. E., Stam, C. J., & de Geus, E. J. C. (in press). The brain matures with stronger functional connectivity and decreased randomness of its network.PLoS One.
Smit, D. J. A., de Geus, E. J. C., van de Nieuwenhuijzen, M. E., van Beijsterveldt, C. E. M., van Baal, G. C. M., Mansvelder, H. D., Boomsma, D. I., & Linkenkaer-Hansen, K. (2011). Scale-free modulation of resting-state neuronal oscillations reflects prolonged brain maturation in humans.The Journal of Neuroscience, 31, 13128–13136.
Smit, D. J. A., Posthuma, D., Boomsma, D., & Geus, E. J. C. (2005). Heritability of background EEG across the power spectrum.Psychophysiology, 42, 691–697.
Smit, D. J. A., Stam, C. J., Posthuma, D., Boomsma, D. I., & de Geus, E. J. C. (2008). Heritability of ‘small-world’ networks in the brain: A graph theoretical analysis of resting-state EEG functional connectivity.Human Brain Mapping, 29, 1368–1378.
Sponheim, S. R., Clementz, B. A., Iacono, W. G., & Beiser, M. (1994). Resting EEG in first-episode and chronic schizophrenia.Psychophysiology, 31, 37–43.
Steriade, M. (1999). Coherent oscillations and short-term plas-ticity in corticothalamic networks.Trends in neurosciences, 22, 337–345.
Sun, D., Phillips, L., Velakoulis, D., Yung, A., McGorry, P. D., Wood, S. J., van Erp, T. G. M., Thompson, P. M., Toga, A. W., Cannon, T. D., & Pantelis, C. (2009). Progressive brain structural changes mapped as psychosis develops in ‘at risk’individuals.Schizophrenia Research, 108, 85–92. Talairach, J., & Tornoux, P. (1988).Co-planar stereotaxic atlas
of the human brain: 3-dimensional proportional system: An approach to cerebral imaging. Stuttgart: Georg Thieme. Tesche, C., & Karhu, J. (2000). Theta oscillations index
hu-man hippocampal activation during a working memory task.Proceedings of the National Academy of Sciences, 97, 919.
Thatcher, R. W., North, D., & Biver, C. (2005). EEG and in-telligence: Relations between EEG coherence, EEG phase delay and power. Clinical Neurophysiology, 116, 2129– 2141.
Thatcher, R., North, D., & Biver, C. (2008). Intelligence and EEG phase reset: A two compartmental model of phase shift and lock.NeuroImage, 42, 1639–1653.
Van Baal, G., De Geus, E., & Boomsma, D. (1996). Genetic architecture of EEG power spectra in early life. Electroen-cephalography and Clinical Neurophysiology, 98, 502–514. Van Beijsterveldt, C. E., Molenaar, P., De Geus, E., & Boomsma,
D. (1996). Heritability of human brain functioning as as-sessed by electroencephalography.American Journal of Hu-man Genetics, 58, 562.
Van Beijsterveldt, C. E. M., Molenaar, P., De Geus, E., & Boomsma, D. (1998a). Genetic and environmental influ-ences on EEG coherence.Behavior Genetics, 28, 443–453. Van Beijsterveldt, C. E. M., Molenaar, P., De Geus, E., &
Boomsma, D. (1998b). Individual differences in P300 am-plitude: A genetic study in adolescent twins.Biological Psy-chology, 47, 97–120.
van Leeuwen, M., Peper, J. S., van den Berg, S. M., Brouwer, R. M., Hulshoff Pol, H. E., Kahn, R. S., & Boomsma, D. I. (2009). A genetic analysis of brain volumes and IQ in children.Intelligence, 37, 181–191.
Walhovd, K. B., Fjell, A. M., Reinvang, I., Lundervold, A., Dale, A. M., Eilertsen, D. E., Quinn, B. T., Salat, D., Makris, N., &
Fischl, B. (2005). Effects of age on volumes of cortex, white matter and subcortical structures.Neurobiology of Aging, 26, 1261–1270.
Whitford, T. J., Rennie, C. J., Grieve, S. M., Clark, C. R., Gordon, E., & Williams, L. M. (2007). Brain matura-tion in adolescence: Concurrent changes in neuroanatomy and neurophysiology. Human Brain Mapping, 28, 228– 237.
Wright, I. C., Rabe-Hesketh, S., Woodruff, P. W. R., David, A. S., Murray, R. M., & Bullmore, E. T. (2000). Meta-analysis of regional brain volumes in schizophrenia.American Jour-nal of Psychiatry, 157, 16.
Yu, X., & Malenka, R. C. (2003). Beta-catenin is critical for dendritic morphogenesis. Nature Neuroscience, 6, 1169– 1177.