Original Research Article
Assessment of under nutrition using composite index of anthropometric
failure among under five children of tribal population
Ram Prabhakar
1*, Hemalatha Kumarasamy
2, Anitha Dhanapal
3INTRODUCTION
Under nutrition is one of the major causes for all deaths in children. It does this by deteriorating children’s strength and making illness more perilous. For an undernourished child it is difficult to withstand an attack of pneumonia, diarrhoea or any other illness. The main reason for under nutrition is poor feeding, care and infections. Nutritional deficiency makes children fatigued and fragile, and drops their IQs, so thereby leading to
their poor performances in school. The sequence of under nutrition and poverty repeats itself, generation to generation. Exclusive breastfeeding for the atleast first 6 months and initiation of complementary feeding along with breast feeding can have a major impact on children’s survival, growth and development.1
Under nutrition in children can present itself in several ways, and it is most commonly assessed by anthropometric measurements like height, weight and
ABSTRACT
Background: Under nutrition is one of the most imperative problems among children that needed to be addressed in the realm of public health. Undernourished children cannot maintain natural biological abilities, such as growth, recuperating from ailments, learning and physical development. Poor feeding practices along with illnesses like diarrhoea, pneumonia, helminthic infections etc. are major determinants of under nutrition in India. The tribal populations in India are identified to be the autochthonous people of the land thereby being one of the major sufferers of under nutrition. This study aimed at finding out the prevalence of under nutrition among under-five children in tribal population in Tiruchirappalli district of Tamil Nadu.
Methods: This community based cross-sectional analytical study was done among Malayali Tribes population of Puthur village, Pachamalai Hills, Trichy to determine the prevalence of under-nutrition using CIAF and WHO Z scoring system and its risk factors by multivariate analysis.
Results: Out of 100 children, about 85% were undernourished as per CIAF criteria. In the Multivariate analysis, children of employed mother and children who were not given exclusive breast feeding were associated with Under nutrition which was statistically significant (p<0.05).
Conclusions: CIAF could be considered as a better measure than any other single index to identify the problem in the community. The study also emphasizes the significance of proper IYCF practices among employed mothers and improvement of MCH services in Tribal population during antenatal and immediate postnatal period to bring down the prevalence of under nutrition.
Keywords: Under nutrition, Tribal, CIAF, IYCF
Department of Community Medicine, 1Assistant Professor, Theni Government Medical College, Theni, 2Assistant Professor, 3CRRI, Chennai Medical College Hospital and Research Centre, Tiruchirappalli, Tamil Nadu, India
Received: 07 February 2019
Revised: 03 April 2019
Accepted: 04 April 2019
*Correspondence:
Dr. Ram Prabhakar,
E-mail: [email protected]
Copyright: © the author(s), publisher and licensee Medip Academy. This is an open-access article distributed under the terms of the Creative Commons Attribution Non-Commercial License, which permits unrestricted non-commercial use, distribution, and reproduction in any medium, provided the original work is properly cited.
mid upper arm circumference. A child is called stunted when he or she is too short for his or her age and called wasted when he or she have low weight for height and called underweight when he or she has low weight for his or her age. A child can present with underweight or stunted or wasted or with any of the combinations. Worldwide, under nutrition affects one in three people and each of its major forms dwarfs most other diseases globally (WHO, 2000). Under nutrition affects all age groups, but it is especially common among the poor and those with insufficient access to adequate food, water and health care facilities. More than 70% of children with protein-energy malnutrition were present in Asia, 26% in Africa, and 4% in Latin America and the Caribbean (WHO 2000). South Asia has the maximum proportions and by far the principal number of undernourished children in the world.1
In India alone there are nearly 60 million children who are underweight, and the prevalence is higher in rural than the urban areas.2,3 The number of malnourished children in India is among the highest in the world and is twice than that of the sub-Saharan region.4 According to WHO, the projected numbers (in million) of underweight, stunted and wasted preschool children in 2015 in Asia is around 60, 84 and 39 million respectively. According to NFHS-3, among under five children, about 43.1% males and 43.9% females are underweight, about 47.9% males and 48% females are stunted, about 20.7% males and 19.3% females are wasted.5
The tribal population of the country, as per 2011 census, is 10.43 crore, constituting 8.61% of the total population. The state of Tamil Nadu contains 7,94,697 number of ST (Scheduled Tribes).6 Their proportion in the state is 1.1% to that of other population as per 2011 census. Malayali tribes are the majority in Tamil Nadu with around 89,225 mainly located in districts of Dharmapuri, North Arcot, Pudukottai, Salem, South Arcot and Tiruchirapalli.7 In Tamil Nadu, about 29.8% were underweight, 30.9% were stunted and 22.2% were wasted among the under five children.5
CIAF is the latest, comparatively strong index as it predicts all the parameters for approximation of nutritional status of a child.8 CIAF provides the burden of under-nutrition as a solitary indicator and helps in detection of children with multiple anthropometric failures. The tribal population are poor in some key health indicators viz infant mortality, neonatal mortality, child mortality, antenatal check-up, percentage of institutional deliveries, maternal mortality, child full immunization etc. as per NFHS 3 data.5 This study aimed at finding out the prevalence of under nutrition among under-five children in tribal population in Tiruchirappalli district of Tamil Nadu.
METHODS
Study area
A community based cross sectional study was conducted among Malayali tribes population of Pachamalai hills located between the districts of Tiruchirappalli, Perambalur and Salem, Tamil Nadu, South India. The hill is situated 2000 to 3000 feet above mean sea level and lies between 78.31’ East and 11.28’ North latitude. The total area is 14,122 sq. km. Pachaimalai, also known as the Pachais, are hills which are part of Eastern Ghats in Tamil Nadu in Trichy district. The geographical location of the area is 11°11′N 78°21′E / 11.18°N 78.35°E / 11.18; 78.35. There are about 21 villages with tribal population in and around Pachamalai Hills.7 The list of villages is as follows: Manalodai, Thonur, Chinna Iluppur, Periya Iluppur, Sikkadu, Puthur, Puttur, Parathal, Nagur, Palayam, Thenpadi, Thalar, Kuruchi, Sengathur, Valaiyur, Kinathur, Thaneerpallam, Ramanathapuram, Chinna Vallam, Silaiyur and Nasakulam. The total population of all the villages is 8864 with around 1102 households. Among these 21 villages, Puthur was selected purposively as the study area.
Study population
The under five children (0-5 yrs of age) residing in Puthur village were the study population.
Study duration: Six months.
Study period: 10th June 2015 to 10th December 2015.
Study design
The study was a community based cross-sectional analytical study.
Sample size
Taking the prevalence of underweight in tribal (scheduled tribes) under five children in NFHS-3 data = 54.5%,5 allowable absolute error=10%, the sample size comes around 99.19. Keeping 10% for non-responsiveness, final sample size required was 100.
Sampling design: Simple Random sampling
Study instruments
A pre-designed pre-tested schedule (interviewer administered questionnaire)
Salter weighing machine
Standard weighing (bathroom) scale) A non-stretchable measuring tape Infantometer
Stethoscope
Modified BG Prasad’s scale (modified for May 2014)
WHO Anthro for personal computers, version 3.2.2, 2011 Software
Epi info statistical software
Data collection
The purpose of the study was explained to all the mothers of the children and they were assured of confidentiality. After obtaining written consent for participation in the study, the schedule (interviewer administered questionnaire) was applied. A pre-designed, pre tested schedule in the local language (Tamil) which was translated and back-translated to verify content, criteria and semantic equivalence by bilingual and monolingual experts was prepared and used on the mothers of the under 5 children.
All the children were examined clinically, their anthropometric measurements like weight, height, mid upper arm circumference (MUAC) were taken using standard operating procedures, after taking written consent from their mothers with the help of a predesigned and pre tested schedule. The data included were weight, recumbent length (for children less than 24 months of age), height (for children more than 24 months of age) and mid upper arm circumference (for children 1-5 years of age). Weight was measured to the nearest 0.1 Kg in a Salter weighing machine and standard weighing (bathroom) scale. Height was measured against a non-stretchable tape fixed to a vertical wall, with the participant standing on a firm/level surface and it was measured to the nearest 0.1 cm. recumbent length (for children less than 24 months of age) was measured by using an infantometer. Each measurement was done twice, and the mean of the two readings was recorded. Socio-economic status (SES) was determined by using Modified Prasad’s scale (modified for 2014). Anthropometric data was analyzed using WHO Anthro for personal computers, version 3.2.2, 2011 Software (for children aged 0 to 59 months) for assessing growth and development of the children.
Operational definitions
The definitions used for the study are as follows:
Wasting (acute malnutrition) is defined as a Weight for Height Z-score (WHZ) of <-2. Severe wasting is considered if WHZ is <-3 OR if MUAC <11.5 cm Stunting (chronic malnutrition) is defined as a height
for age Z-score (HAZ) of <-2. Severe stunting is considered if HAZ is <-3.
Underweight (mixed acute and chronic malnutrition) is defined as weight for age Z-score (WAZ) of <-2. Severe underweight is considered if WAZ is <-3
Thinness (measure of body fat) is defined as a BMIZ of <-2. Severe thinnesswas considered if BMIZ was <-3
Composite Index of Anthropometric failure (CIAF) includes all children who are wasted, stunted, or underweight and their combinations (groups B–Y).8
Statistical analysis
All the data was initially entered to Microsoft Excel 2010 and later these spreadsheets were used for analysis. Statistical analysis was done using Epi info statistical software. Descriptive statistics were calculated as frequency, percentage, mean and standard deviation, median and inter-quartile range. Descriptive data were represented using tables. For inferential statistics, various tests of significance were used according to the type of variables dealt with. For all the statistical tests of significance, p<0.05 was considered to reject the null hypothesis. Taking presence of under nutrition [present or absent] as a dichotomous variable, logistic regression analysis was used. Firstly, a bivariate analysis was done to ascertain the relationship of dependent variable with other variables. Then, all the variables found to be significant in bivariate analysis were entered into a multivariate logistic regression analysis (Link Function=Logistic). Diagnostic tests were done after modelling to assess goodness-of-fit and assumptions pertaining to logistic regression.
RESULTS
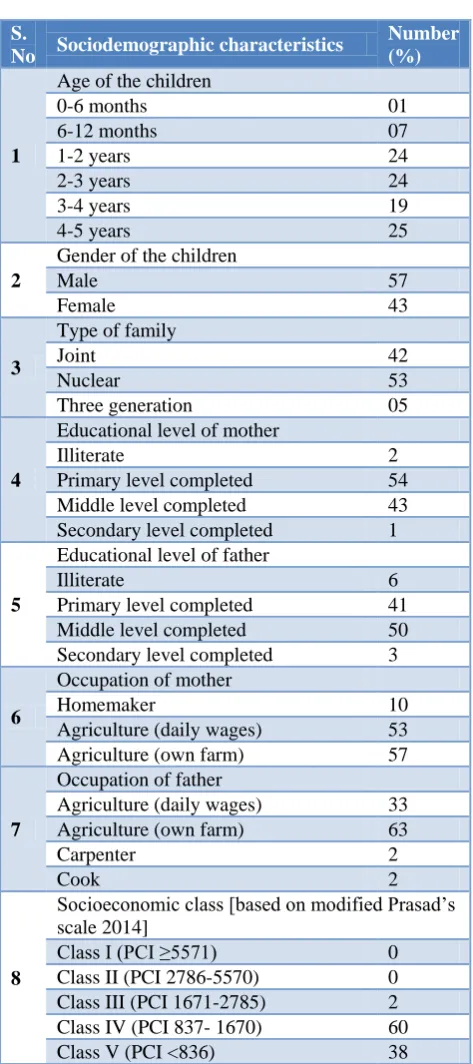
A total of 100 children below five years of age were surveyed. The mean age of children was: Mean±SD= 33.6±15.2 [months]. Majority of the children (25%) were in the age group of 4-5 years, 57% were males. All the children belonged to Hindu religion and Malayali tribes caste. Most of the children (53%) had a nuclear type of family. 54% of the mothers had completed till the primary level of education and 50% of the fathers had completed till the middle level of education. Majority of the mothers (53%) were Agricultural labourers working in farms as daily wages while the fathers (65%) were agricultural labourers working in farms as daily wages. The mean per capita income of the study population was: Mean±SD = 851.9±101.1 [PCI]. 60% of the children belonged to the upper lower socio economic class (Table 1).
6 months. Complementary feeding started at 6-7 months with semisolid food was considered proper and about 93% had started complementary feeding properly. Complementary feeding was not applicable for one child@ since it was less than 6 months of age. Regarding the morbidity in children, diarrhoea was seen in 11%, acute respiratory infections in 18%, skin rashes in 9% and pallor in 13% (Table 2).
Table 1: Sociodemographic characteristics (n=100).
S.
No Sociodemographic characteristics
Number (%)
1
Age of the children
0-6 months 01
6-12 months 07
1-2 years 24
2-3 years 24
3-4 years 19
4-5 years 25
2
Gender of the children
Male 57
Female 43
3
Type of family
Joint 42
Nuclear 53
Three generation 05
4
Educational level of mother
Illiterate 2
Primary level completed 54 Middle level completed 43 Secondary level completed 1
5
Educational level of father
Illiterate 6
Primary level completed 41 Middle level completed 50 Secondary level completed 3
6
Occupation of mother
Homemaker 10
Agriculture (daily wages) 53 Agriculture (own farm) 57
7
Occupation of father
Agriculture (daily wages) 33 Agriculture (own farm) 63
Carpenter 2
Cook 2
8
Socioeconomic class [based on modified Prasad’s scale 2014]
Class I (PCI ≥5571) 0 Class II (PCI 2786-5570) 0 Class III (PCI 1671-2785) 2 Class IV (PCI 837- 1670) 60 Class V (PCI <836) 38 The descriptive measures of mean weight, height or length and mid upper arm circumference (MUAC) were shown in (Table 3).
Table 2: Birth weight, birth order, IYCF practices and morbidity (n=100).
S.No Child health data Number
(%)
1.
Birth weight of children
Normal (≥2.5 kg) 66 LBW (<2.5 kg)# 34
2.
Birth order
First 43
Second 38
Third 16
Four and above 3
3.
Term/preterm pregnancy
Term 79
Preterm 21
4.
IYCF practices Prelacteal feeds
Given 23
Not given 77
Exclusive Breast feeding
Given 48
Not given 52
Complementary feeding
Started properly 93
Not started 6
Not applicable@ 1
5.
Morbidity (past 2 weeks) Diarrhoea
Yes 11
No 89
Acute respiratory tract Infections
Yes 18
No 82
Skin rashes
Yes 9
No 91
Pallor
Yes 13
No 87
Table 3: Descriptive statistics of weight, height and MUAC (n=100).
Measures Weight (kg)
Height/length (cms)
MUAC (cms)
Mean 10.2 83.4 12.2
Median 10.0 84 12
SD 3.7 14.7 1.6
one of the last 6 criteria [B, C, D, E, F or Y] and except the first one [A]. In the current study, about 85% were
undernourished according to CIAF criteria (Table 4).
Table 4: Nutritional status of children (n=100).
S. No Nutritional status of children Number or (%)
1.
Wasting (WHZ score)
No wasting 51
Wasting 19
Severe wasting 30
Stunting (HAZ score)
No stunting 28
Stunting 24
Severe stunting 48
Underweight (WAZ score)
No underweight 38
Underweight 9
Severe underweight 53
Thinness (BMIZ score)
No thinness 53
Thinness 22
Severe thinness 25
2.
CIAF Criteria
Group Description
A No failure 15
B Wasting only 4
C Wasting & underweight 9
D Wasting, stunting & underweight 36
E Stunting & underweight 17
F Stunting only 19
Y Underweight only 0
3.
Undernutrition [as per CIAF Criteria]
Absent/Normal 15
Present 85
Table 5: Bivariate logistic regression analysis of under nutrition with various factors (n=100).
Independent variable Undernutrition
present N (%) OR (95% CI) P value
Age of child (continuous variable) --- 0.966(0.929-1.004) 0.077
Gender of child
Male (57) 54 (94.7) 6.96(1.82-26.6)
0.005
Female (ref) (43) 31 (72.1) 1
Type of family
Joint (42) 37 (88.1) 1.85(0.17-20) 0.613
Nuclear(53) 44 (83) 1.22(0.12-12.2) 0.865
Three generation (ref) (5) 5 (80) 1
PCI
(continuous variable) --- 12.9(0.95-361.78) 0.931
Education of mother
Above middle (56) 47 (83.9) 0.82(0.26-2.5)
0.524 Below middle (Ref) (44) 38 (86.3) 1
Education of father
Above middle (53) 48 (90.5) 2.5(0.81-8.24)
Independent variable Under nutrition
present N (%) OR(95% CI) P value
Occupation of mother
Employed (90) 80 (88.9) 8.0(1.96-32.5)
0.002
Homemaker (Ref) (10) 5 (50) 1
Birth weight
<2.5 Kg (34) 30 (88.2) 1.5(0.4-5.1)
0.911 ≥2.5 kg (Ref) (66) 55 (83.3) 1
Birth order
1st (43) 36 (83.7) 0.83(0.27-2.52)
0.543 2nd & above(Ref) (57) 49 (85.9) 1
EBF
Not given (52) 49 (94.2) 5.4(1.43-20.7)
0.029
Given (Ref) (48) 36 (75) 1
Complementary feeding
Improper (7) 2 (28.5) 0.4(0.07-2.31)
0.743
Proper(Ref) (93) 80 (86.0) 1
Morbidity (past 2 weeks)
Yes (21) 20 (95.2) 4.30(0.53-34.8)
0.790
No (79) 65 (82.2) 1
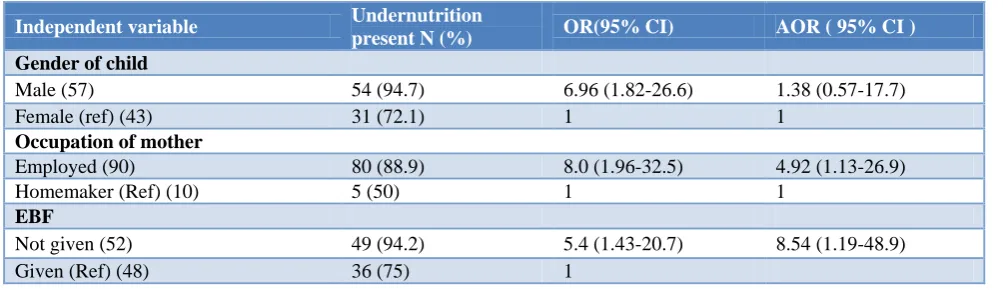
Table 6: Multivariate logistic regression analysis of under nutrition with various factors (n=100).
Independent variable Undernutrition
present N (%) OR(95% CI) AOR ( 95% CI )
Gender of child
Male (57) 54 (94.7) 6.96 (1.82-26.6) 1.38 (0.57-17.7)
Female (ref) (43) 31 (72.1) 1 1
Occupation of mother
Employed (90) 80 (88.9) 8.0 (1.96-32.5) 4.92 (1.13-26.9)
Homemaker (Ref) (10) 5 (50) 1 1
EBF
Not given (52) 49 (94.2) 5.4 (1.43-20.7) 8.54 (1.19-48.9)
Given (Ref) (48) 36 (75) 1
In the bivariate analysis, independent variables like gender of the child, occupation of mother and exclusive breast feeding showed association with the dependent variable under nutrition. Male child, children of employed mother and children who were not given exclusive breast feeding were associated with under nutrition which was statistically significant in bivariate logistic regression (p<0.05) (Table 5).
In the multivariate logistic regression, children of employed mother and children who were not given exclusive breast feeding were associated with under nutrition which was statistically significant (p<0.05) (Table 6).
DISCUSSION
In this cross sectional study done over a period of 2 months it was found that around 25% of children belonged to the age group of 4-5 years. About 57% were males and 53% lived in nuclear families. It was evident
pre lacteal feeds with honey and sweet water most commonly. Exclusive breast feeding was strictly followed for only 48% children in which was very less when compared to another study by Brahmbhatt et al where 86.5% were exclusively breast fed.12 Initiation of complementary feeds was proper in 93% of children. In comparison with each subset of CIAF score in this study A (15%) B (4%) C (9%), D (36%), E (17%), F (19%) to a similar study by Brahmbhatt et al A (1.8%) B (1.8%) C (21.6%) D (58.4%) E (15.8%) F (0.6%) the current study showed a huge prevalence of under nutrition in all aspects.12 In this study 49% were wasted, 72% were stunted, 62% were underweight which was also high in comparison to a study done by Sen et al where prevalence of under-nutrition was observed to be 21.5% (wasting), 43.3% (stunting) and 52.0% (underweight) and in Seetharaman et al where 49.6% were stunted, 46.7% underweight and 20.2% were wasted.13,14 It was also higher than the National level data where underweight, stunting and wasting were 47%, 45.5% and 15.5% respectively and the corresponding values for Tamil Nadu were 36.7%, 29.4% and 19.9%. Under nutrition was present in 85% of the children in this study which is more than observed by Seetharaman et al (68.6%) in Tamil Nadu lesser than observed by Brahmbhatt et al (98.2%) in Dakshina Kannada region of Karnataka. The study by Sen et al showed 63.6% using the CIAF.12-14 Similar studies done in other parts of India reveal Mandal et al (73.1%) in Hooghly district of West Bengal, Anwar et al (62.5%) in rural Varanasi, Deshmukh et al (59.6%) in rural Wardha.15-17
From the logistic analysis it is evident that the gender of the child (p=0.005), occupational status of the mother (p=0.002) and exclusive breast feeding of the child (p=0.029) has a direct bearing on the CIAF scores and nutritional status of the child which was similar in comparison to the study done by Sen et al where multinomial logistic regression odds showed that children suffering from double and multiple failures were significantly associated with the socio-economic and demographic variables.13
CONCLUSION
The study revealed higher proportion of under nutrition (85%) among tribal under five children. With multivariate analysis occupation of the mother and absence of exclusive breastfeeding were identified as the two important factors contributing to under nourishment in the study group. Improving child care practices among employed mothers and promoting exclusive breast feeding should be given due importance. Emphasizing the above two measures during antenatal period and immediate postnatal period would be helpful since the mother will be more receptive in these phases.
62% of the children had underweight and 49% had wasting. 72% of the children had stunted growth which reflects chronic under nutrition in these children. Based
on CIAF criteria 85% of the children were under nourished. CIAF criteria were able to identify the overall proportion of affected children. CIAF could be a considered as a better measure than any other single index to identify the under nourished children in the community.
ACKNOWLEDGEMENTS
All the mothers and children who had participated in the study had been acknowledged. We the authors of the study thank the Village President of Puthur village for support and cooperation. We are very much thankful to Dr. S. Elango MBBS.,DPH.,MD (Late), former Director of Public Health and Preventive Medicine, Tamil Nadu and former Professor & Head of the Department of Community Medicine, Chennai Medical College Hospital & Research Centre, Trichy for his leadership, guidance and supervision in this study. We also thank Indian Council of Medical Research (ICMR) for their financial assistance to this study.
Funding: Indian Council of Medical Research (ICMR) Reference ID: 2015-00554
Conflict of interest: None declared
Ethical approval: The study was approved by the
Institutional Ethics Committee,Chennai Medical College
Hospital & Research Centre, Trichy
REFERENCES
1. World Bank. India, Undernourished children: A call for reform and action. Available at http://web. worldbank.org/WBSITE/EXTERNAL/COUNTRIE S/SOUTHASIAEXT/0,,contentMDK:
20916955~pagePK:146736~piPK:146830~theSiteP K:223547,00.html. Accessed on 05 February 2019. 2. Haddad L, Ross J, Oshaug A, Torheim LE, Cogill
B. 5th report on the world nutrition situation. Nutrition for improved development outcomes. 2004.
3. Smith LC, Ruel MT, Ndiaye A. Why is child malnutrition lower in urban than rural areas? International Food Policy Research Institute (IFPRI); 2004.
4. Gragnolati M, Bredenkamp C, Shekar M, Das Gupta M, Lee YK. India's undernourished children: a call for reform and action. The World Bank; 2006. 5. International Institute for Population Sciences (IIPS)
and Macro International. National Family Health Survey (NFHS-3), 2005–06: India: Volume I. Mumbai: IIPS. 2007.
6. Censusindia.gov.in. Available at http://censusindia. gov.in/Tables_Published/SCST/dh_st_Tamil Nadu.pdf. Accessed 05 February 2019.
7. Wikimapia.org. Available at http://wikimapia. org/9501280/PACHAMALAI-HILLS. Accessed 05 February 2019.
morbidity: new evidence from India. Bulletin of the World Health Organization. 2005;83:210-6.
9. The United Nations International Children's Emergency Fund. New York. Available at http://www.unicef.org/progressforchildren/2006n4/i ndex_undernutrition.html. Accessed 05 February 2019.
10. Dudala SR, Reddy KA, Prabhu GR. Prasad's socio-economic status classification-An update for 2014. Int J Res Health Sci. 2014;2(3):875-.
11. World Health Organization. Geneva. Available at http://www.who.int/childgrowth/software/en/. Accessed 05 February 2019.
12. Brahmbhatt KR, Hameed S, Naik PM, Prasanna KS, Jayram S. Role of new anthropometric indices, validity of MUAC and Weech’s formula in detecting under-nutrition among under-five children in Karnataka. Int J Biomed Adv Res. 2013;3(12):896-900.
13. Sen J, Mondal N. Socio-economic and demographic factors affecting the Composite Index of Anthropometric Failure (CIAF). Ann Human Biol. 2012;39(2):129-36.
14. Seetharaman N, Chacko TV, Shankar SL, Mathew AC. Measuring malnutrition-The role of Z scores and the composite index of anthropometric failure (CIAF). Indian J Community Med. 2007;32(1):35. 15. Mandal G, Bose K. Assessment of overall
prevalence of undernutrition using composite index of anthropometric failure (CIAF) among preschool children of West Bengal, India. Iranian J Pediatr. 2009;19(3):237-43.
16. Anwar F, Gupta MK, Prabha C, Srivastava RK. Malnutrition among rural Indian children: An assessment using web of indices. Int J Public Health Epidemiol. 2013;2:78-84.
17. Deshmukh PR, Dongre AR, Sinha N, Garg BS. Acute childhood morbidities in rural Wardha: some epidemiological correlates and health care seeking. Indian J Med Sci. 2009;63(8):345-54.