A Comparison of Cluster Method and Nearest Neighbor Method
for Non-sample Area in the Small Area Estimation
Annastasia Nika Susanti1, Kusman Sadik2, Anang Kurnia3
1,2,3Department of Statistics, Bogor Agricultural University, Bogor, West Java, Indonesia
Corresponding Author: Kusman Sadik ( [email protected] ) ABSTRACT
Small area estimation is an indirect method to estimate the parameter of a population by using the model approach. The problem that often arises in the small area estimation is non-sampled area then the area random effect of non-sampled areas is can not estimate because no sample units are available in these areas. This paper proposed a method to solve the non-sampled area problem by adding the cluster information and by using the nearest neighbor area to estimate the area random effect through the Fast Hierarchical Bayes (FHB) approach. These methods are compared by using the simulation study and the evaluation is based on the Absolute Relative Bias (ARB) and Relative Root Mean Square Error (RRMSE). The result shows that the estimation by using the cluster method has smaller ARB and RRMSE values than the estimation by using the nearest neighbor area in various sample sizes and various population sizes. Then it can be said that cluster method is better to provide the estimators of non-sampled area than the nearest neighbor area method.
Keywords : Small Area Estimation, Non-Sampled Area, Cluster Method, The Nearest Neighbor Area, Poverty Indicators.
I.
INTRODUCTIONSmall area estimation is one of parameter estimation methods that has been applied in many fields since it can provide estimation to a small area level. This method is used when the availability of sample size on an area is too small. Based on Kurnia (2009), small area estimation method uses the additional information in the form of auxiliary variables from outside the area, from within the area itself, and from outside the survey. The auxiliary variables can be obtained from a census or administrative data (Ghosh and Rao, 1994). This method basically uses the model approach to estimate the parameter so it is also called as indirect estimation method (Molina et al., 2014)
In the small area estimation method, the possible problems that might occur are some non-sample areas in the survey. This problem causes the area random effects of the non-sampled area cannot be estimated.
HB method is ineffective to use when the population size is very large since the number of samples to be generated in each Monte Carlo iteration is as much as
. As an alternative to this problem, there is a faster version of the HB method which is called as fast hierarchical Bayes (FHB) method. It is called faster since the methods just needs as much as the original sample size in every Monte Carlo iteration. The FHB approach can be implemented analogously to the fast EB (FEB) approach (Molina et al. 2012).
Based on that background, the authors are interested to study deeply about the non-sampled area in the small area estimation model mainly by using the FHB method since the method is more simple to use. The authors try to provide another solution to resolve the non-sampled area problem by using the nearest neighbor (NN) area. Then the results will be compared with the estimation by using the cluster information. The goodness of estimation is measured by the Absolute Relative Bias (ARB) and Relative Root Mean Square Error (RRMSE).
The organization of this paper is as follows. Section 2 describes the estimation algorithm of the FHB method. Section 3 presents the result of the simulation study to compare the estimators between nearest neighbor area and cluster information. Finally, in Section 4 gives some concluding remarks of the research.
II.
METHODS AND MATERIALThis paper is done by using a simulation study with the design based simulation to estimate the poverty indicators, such as poverty incidence ( ), poverty gap ( ), and poverty severity ( ) index. The number of Monte Carlo repetition is and the number of sampling repetition is . This simulation uses the various sample sizes ( n , n , and n ) and the various population area sizes ( , N , and N ). The
FHB method is done by forming the posterior distribution just as on the HB method by Molina et al. (2014) which is defined by
( )
( ) ( ) ( ) ( ) ( )
The simulation is started as follows :
1) Generated of the population, which the number of areas ( ) is 40 areas where three of them are assumed non-sampled ( area 16, 21, and 40), the coefficient regression i ( ), the random area effects i , and the error variance i .
2) Generated of variable of interest based on the
Nested Error Model (NER) as in Molina et al. (2014) below:
( )
with is a random effect of area which is distributed as ( ), and
is
errors which is distributed as
( ). The auxiliary variable is
generated by ( )
and ( ).
3) Draw the sample unit without replacement and assumed that area 16, 21, and 40 are non-sampled then calculated the parameters and the direct estimators of the poverty indicators.
4) Generated the posterior distribution as follows : 4.1) Generated the distribution of , the
intra-class
corelation which makes a grid then the ( ) can be written as
( ) ( )
∑ ( ) ( ) 4.2) Generated as much by discrete
distribution * ( )+ then add it to
5) Generated the error variance distribution ( ) as below
( ( )) ( )
Then take .
6) Generated the ( ) distribution i.e ( ̂( ) ( ) ( )) ( )
7) Generated the area random effects from
* ( )( ̅ ̅ ) (
( ))
+ ( )
The area random effects of the non-sampled area are estimated by following this method.
7.1) The nearest neighbor area (NN)
The area random effects of non-sampled area is generated from the equation (6) with
mean ( )( ̅ ̅ ) and variance
* ( )( ̅ ̅ ) ( ( ))
+ where
is the nearest area from the non-sampled area.
7.2) The cluster information
The area random effect of the non-sampled area by using the cluster information is done by clustering all areas first, then the non-sampled area will be known lied on which cluster. Furthermore, the area random effects are generated by using (6) with mean and variance obtained by averaging the , ̅ , and ̅ from others area in the same cluster with non-sampled area.
8) Finally the posterior distribution of ( ) is
( ) ( )
9) Generated the variable of interest based on (7) as much of the original sample size, then calculated the FHB estimator of the poverty indicators from
times Monte Carlo repetition as below
̂ ̂ ( ) ∑ ̂ ( )
∑ ̂ ( )
( )
with
( )
( ) [∑ (
)
( )
∑ ( ( )) (
( ) )
] ( )
is the poverty line and
( ) {
( )
( )
10)The last step repeats the step (3) until step (9) as much of times sampling repetition, then calculated the average of estimators which is obtained by direct estimators, HB method, and FHB method.
III. RESULTS AND DISCUSSION
The simulation study in this research is basically done to see how well both methods provide an estimator for the parameter of the population. The measure of goodness which is used in this research is ARB and RRMSE. The smaller the value indicates that the method is better than others. The simulation is done by using various sample sizes to see the effect of sample increasing towards the estimator. In this study, the non-sampled areas are assumed in area 16, 21, and 40. Then, based on the simulation study, the result of the ARB and RRMSE values for each non-sampled area in the various sample sizes is presented in the following tables.
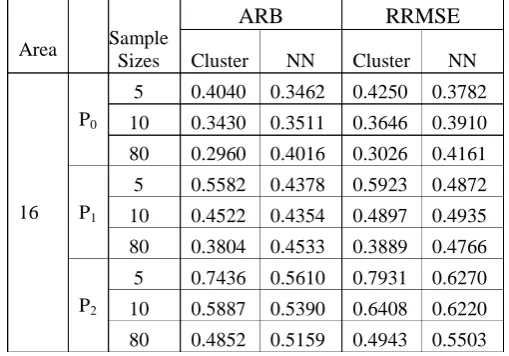
Table 1: The ARB and RRMSE value of area 16 in the various sample sizes
Area Sample Sizes
ARB RRMSE
Cluster NN Cluster NN
16 P0
5 0.4040 0.3462 0.4250 0.3782
10 0.3430 0.3511 0.3646 0.3910
80 0.2960 0.4016 0.3026 0.4161
P1
5 0.5582 0.4378 0.5923 0.4872
10 0.4522 0.4354 0.4897 0.4935
80 0.3804 0.4533 0.3889 0.4766
P2
5 0.7436 0.5610 0.7931 0.6270
10 0.5887 0.5390 0.6408 0.6220
Based on the table it can be seen that the increasing in the number of sample sizes resulted in the ARB and RRMSE values which is obtained by the direct estimation, HB, and FHB method becoming smaller based on cluster method. On the other hand, the ARB and RRMSE values which obtained by the Nearest Neighbor (NN) method is tend to be fluctuation as the increasing of sample sizes. The ARB and RRMSE values from NN method generally can be said that it is getting bigger as the increasing of the sample sizes. If the ARB and RRMSE values which obtained by the cluster method and the NN method is compared, it can be concluded that based on the Table 1, cluster method produces the smaller value of ARB and RRMSE than the NN method. Then the results for area 21 are presented in the Table 2 below.
Table 2: The ARB and RRMSE value of area 21 in the various sample sizes
Based on the Table 2, it can be seen that the increasing of sample sizes causes the value of ARB and RRMSE which is produced by cluster method for area 21 is getting smaller. Otherwise, the ARB and RRMSE values of NN method for area 21 are getting bigger. Table 2 shows that the cluster method provides a better estimator than the NN method since the value of the ARB and RRMSE is smaller than the NN method. The last result to know the effects of sample sizes is presented in the table below for area 40.
Table 3: The ARB and RRMSE value of area 40 in the various sample sizes
Table 3 for area 40, presented the differences result from the previous tables. Based on the Table 3 it can be seen that the cluster method tends to produce the fluctuating value of ARB and RRMSE while the ARB and RRMSE values of NN method is getting bigger as the increasing of sample sizes. Yet, if we compared the ARB and RRMSE values of those methods, the cluster method is better than the NN method since it produces the smaller value. This shows that the nearest neighbor area does not always guarantee that they have the similar characteristics. Otherwise, the average of other areas which is laid on the same cluster can produce better estimators.
This simulation also uses some population area sizes i.e. , N , and N . It aimed to see the effect of population sizes toward the ARB and RRMSE values of both methods. The result of each non-sampled area is presented in the following tables.
Table 4: The ARB and RRMSE value of area 16 in the various population sizes
Area Sample Sizes
ARB RRMSE
Cluster NN Cluster NN
21 P0
5 0.7849 1.0080 0.8173 1.0869
10 0.7335 1.0747 0.7593 1.1452
80 0.7024 1.3112 0.7090 1.3382
P1
5 1.1207 1.4300 1.1784 1.5598
10 1.0332 1.4964 1.0741 1.6199
80 0.9508 1.7705 0.9609 1.8159
P2
5 1.4293 1.8173 1.5214 2.0075
10 1.2953 1.8731 1.3551 2.0603
80 1.1444 2.1667 1.1586 2.2325
Area Sample
Sizes
ARB RRMSE
Cluster NN Cluster NN
40 P0
5 0.2626 0.2475 0.3061 0.3237
10 0.2290 0.3321 0.2658 0.4145
80 0.2829 0.4394 0.2901 0.4691
P1
5 0.3932 0.3784 0.4570 0.5003
10 0.3356 0.4780 0.3890 0.6037
80 0.3937 0.6122 0.4038 0.6518
P2
5 0.5322 0.5222 0.6206 0.7037
10 0.4474 0.6271 0.5164 0.7987
80 0.5035 0.7781 0.5164 0.8273
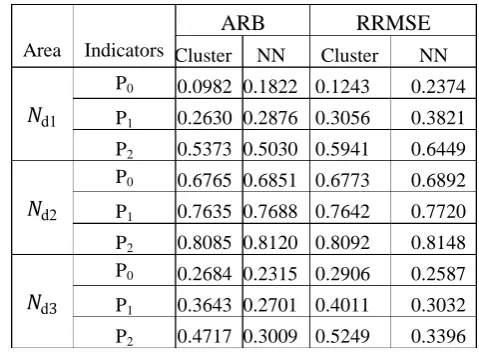
Area Indicators
ARB RRMSE
Cluster NN Cluster NN
𝑁d1
P0 0.0982 0.1822 0.1243 0.2374
P1 0.2630 0.2876 0.3056 0.3821
P2 0.5373 0.5030 0.5941 0.6449
𝑁d2
P0 0.6765 0.6851 0.6773 0.6892
P1 0.7635 0.7688 0.7642 0.7720
P2 0.8085 0.8120 0.8092 0.8148
𝑁d
P0 0.2684 0.2315 0.2906 0.2587
P1 0.3643 0.2701 0.4011 0.3032
Based on the Table 4, it can be seen that generally the increasing of population area sizes causes the ARB and RRMSE values also getting bigger in the cluster method and the NN method. It can be known from Table 4 that the ARB value which is obtained by a cluster method is smaller than the NN method in all population area sizes. The same result is given by area 21 and area 40 then in this case, those results no need to display.
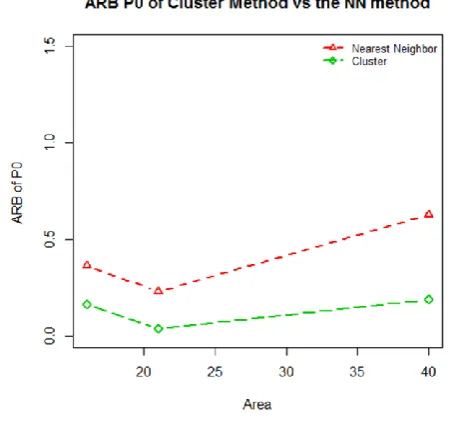
The comparison of the ARB and RRMSE value of cluster method and the NN method is presented in the following figures for P0 indicators as an example. The figures were obtained by using the biggest population area sizes since the FHB method is better to use in the large population and by using the sample sizes as much of 80 each area.
Fig 1: The ARB of poverty incidence by using cluster method and nearest neighbor method
Fig. 1 shows that the cluster method gives the smaller ARB and RRMSE value than the nearest neighbor method. It can be said that the cluster information can provide a better estimation of non-sampled area in terms of small area estimation. The next figure below shows the RRMSE values of P0 indicators as an example by using the cluster method and the nearest neighbor method. The figure also shows the same
result as the Fig. 1. The RRMSE values of the cluster method are smaller than the nearest neighbor method. Therefore, the cluster method is better to use than the nearest neighbor in the small area estimation when there are some non-sampled areas.
Fig 2: The RRMSE of poverty incidence by using cluster method and nearest neighbor method
IV.CONCLUSION
Based on the simulation study, it can be concluded that cluster method is better than the nearest neighbor method since it provides a smaller value of ARB and RRMSE than the nearest neighbor area method for non-sampled area. It can be said that the non-sampled area not always guarantee will have the similar characteristics with its nearest area .
V. REFERENCES
[1] K rnia A 9 ”An empirical best prediction method for logarithmic transformation model in small area estimation with particular application to susenas data” [doctoral dissertation] Bogor Agricultural University, Indonesia.
[3] Molina I, Nandram B, Rao JNK. 2014. “Small area estimation of general parameters with application to poverty indicators: a hierarchical Bayes approach”. The Annals of Applied Statistics. 8 (2): 852-885 DOI: 10.1214/13-AOAS702
[4] Ani a R, K rnia A, an In ahwati 4 “Cluster Information of Non-sampled Area in Small Area Estimation”. IOSR Journal of Mathematics (IOSR-JM).10(1): 15-19.
[5] Wahyudi, Notodiputro KA, Kurnia A, and Anisa R 6 “A Study of Area Clustering using Factor Analysis in Small Area Estimation (An Analysis of Per Capita Expenditures of Subdistricts Level in Regency and Municipality of Bogor)” AIP
Conference Proceedings.1707(1). DOI :
10.1063/1.4940874
[6] Sundara VY, Sadik K, and Kurnia A. 2017. “Cluster Information of Non-sampled Area in Small Area Estimation of Poverty Indicators using Empirical Bayes”, AIP Conference Proceedings. 1827(1). DOI : 10.1063/1.4979442
[7] Molina I an Rao JNK ”Small Area E timation of Poverty In icator ” The Canadian Journal of Statistics. 38(3) : 369 – 385